Galveston County Investment Properties for Sale
Browse homes for sale and investment properties in Galveston County. Refine your search by price, property type, or more.
Best cash flowing properties in Galveston County
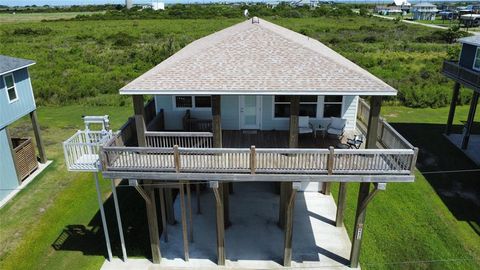
Active
$439,700
3
bds
|
3
ba
|
1,648
sqft
|
built
2006
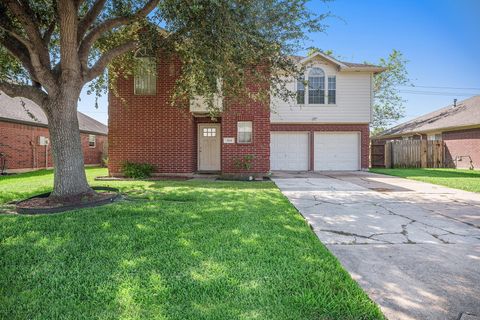
70 Tarpon St, Bayou Vista, TX 77563
$127
Cash flow
1.5%
Cash-on-Cash Return
6.0%
Cap rate
0.7%
Rent to Value Ratio

Active
$148,000
3
bds
|
2
ba
|
1,064
sqft
|
built
1980
1518 3rd Ave N, Texas City, TX 77590
$116
Cash flow
4.1%
Cash-on-Cash Return
6.6%
Cap rate
1.1%
Rent to Value Ratio
1,649 out of 1,971 properties for sale in Galveston County
Limited Results Shown
Create a free account, or log in to reveal all property listings and enjoy the complete experience.
Active
$2,490,000
6
bds
|
7
ba
|
4,305
sqft
|
built
1990
18223 E De Vaca, Galveston, TX 77554
$-7,328
Cash flow
-15.4%
Cash-on-Cash Return
2.1%
Cap rate
0.4%
Rent to Value Ratio

Active
$1,250,000
4
bds
|
3
ba
|
3,301
sqft
|
built
1888
1116 Church St, Galveston, TX 77550
$-4,598
Cash flow
-19.2%
Cash-on-Cash Return
1.3%
Cap rate
0.3%
Rent to Value Ratio
Active
$520,000
3
bds
|
3
ba
|
1,906
sqft
|
built
1908
1824 Avenue O, Galveston, TX 77550
$-1,412
Cash flow
-14.2%
Cash-on-Cash Return
2.4%
Cap rate
0.5%
Rent to Value Ratio
Active
$845,000
5
bds
|
4
ba
|
4,229
sqft
|
built
1975
47 Colony Park Cir, Galveston, TX 77551
$-1,573
Cash flow
-9.7%
Cash-on-Cash Return
3.4%
Cap rate
0.6%
Rent to Value Ratio
Active
$229,900
3
bds
|
3
ba
|
1,729
sqft
|
built
1997
5114 Chase Court Dr, Bacliff, TX 77518
$-99
Cash flow
-2.2%
Cash-on-Cash Return
5.2%
Cap rate
0.9%
Rent to Value Ratio

Active
$309,500
3
bds
|
1
ba
|
1,192
sqft
|
built
1965
112 Tuna St, Galveston, TX 77550
$-301
Cash flow
-5.1%
Cash-on-Cash Return
4.5%
Cap rate
0.6%
Rent to Value Ratio
Active
$630,000
4
bds
|
2
ba
|
1,958
sqft
|
built
2001
18614 Warrior Rd, Galveston, TX 77554
$-1,372
Cash flow
-11.4%
Cash-on-Cash Return
3.1%
Cap rate
0.6%
Rent to Value Ratio
Active
$495,000
3
bds
|
2
ba
|
1,269
sqft
|
built
2018
23159 Fresca St, Galveston, TX 77554
$-1,089
Cash flow
-11.5%
Cash-on-Cash Return
3.0%
Cap rate
0.6%
Rent to Value Ratio

Active
$369,000
2
bds
|
2
ba
|
1,176
sqft
|
built
1984
4125 5th St, Galveston, TX 77554
$-569
Cash flow
-8.0%
Cash-on-Cash Return
3.8%
Cap rate
0.6%
Rent to Value Ratio
Active
$3,800,000
2
bds
|
2
ba
|
1,888
sqft
|
built
1985
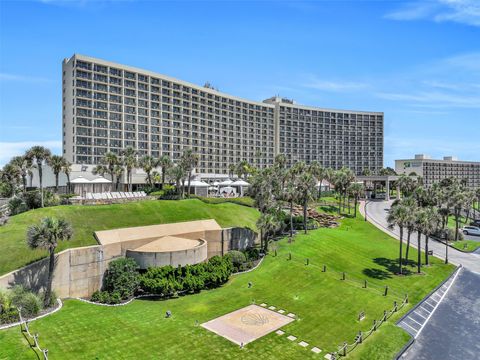
5220 Seawall Blvd, Galveston, TX 77551
$-21,795
Cash flow
-29.9%
Cash-on-Cash Return
-1.2%
Cap rate
0.1%
Rent to Value Ratio

Active
$499,000
2
bds
|
2
ba
|
1,505
sqft
|
built
1965
4711 Sherman Blvd, Galveston, TX 77551
$-1,223
Cash flow
-12.8%
Cash-on-Cash Return
2.7%
Cap rate
0.5%
Rent to Value Ratio

Active
$395,000
3
bds
|
1
ba
|
1,053
sqft
|
built
1984
16530 Captain Kidd Rd, Jamaica Beach, TX 77554
$-882
Cash flow
-11.6%
Cash-on-Cash Return
3.0%
Cap rate
0.6%
Rent to Value Ratio
Active
$399,999
3
bds
|
2
ba
|
1,479
sqft
|
built
2015
1021 Dolphin Rd, Gilchrist, TX 77617
$-648
Cash flow
-8.5%
Cash-on-Cash Return
3.7%
Cap rate
0.6%
Rent to Value Ratio
Active
$399,900
3
bds
|
2
ba
|
1,304
sqft
|
built
2005
721 Marlin St, Bayou Vista, TX 77563
$-817
Cash flow
-10.7%
Cash-on-Cash Return
3.2%
Cap rate
0.7%
Rent to Value Ratio
Active
$439,000
2
bds
|
2
ba
|
814
sqft
|
built
1968
16619 Bermuda Way, Jamaica Beach, TX 77554
$-863
Cash flow
-10.3%
Cash-on-Cash Return
3.3%
Cap rate
0.6%
Rent to Value Ratio

Active
$695,000
3
bds
|
3
ba
|
1,760
sqft
|
built
1980
631 E Shore Dr, Clear Lake Shores, TX 77565
$-2,064
Cash flow
-15.5%
Cash-on-Cash Return
2.1%
Cap rate
0.4%
Rent to Value Ratio

Active
$289,999
4
bds
|
2
ba
|
1,688
sqft
|
built
2021
8216 Tourmaline Way, Texas City, TX 77591
$-584
Cash flow
-10.5%
Cash-on-Cash Return
3.3%
Cap rate
0.8%
Rent to Value Ratio
Active
$325,000
4
bds
|
3
ba
|
1,987
sqft
|
built
2020
3514 Conquest Cir, Texas City, TX 77591
$-647
Cash flow
-10.4%
Cash-on-Cash Return
3.3%
Cap rate
0.7%
Rent to Value Ratio
Active
$465,000
4
bds
|
4
ba
|
3,216
sqft
|
built
2017
2817 Cumberland Dr, Texas City, TX 77568
$-1,223
Cash flow
-13.7%
Cash-on-Cash Return
2.5%
Cap rate
0.8%
Rent to Value Ratio
Active
$265,000
4
bds
|
2
ba
|
1,720
sqft
|
built
2018
2102 Del Mar Dr, Texas City, TX 77568
$-360
Cash flow
-7.1%
Cash-on-Cash Return
4.0%
Cap rate
0.9%
Rent to Value Ratio
Active
$399,000
3
bds
|
2
ba
|
1,320
sqft
|
built
2021
4421 Ranger Dr, Port Bolivar, TX 77650
$-872
Cash flow
-11.4%
Cash-on-Cash Return
3.1%
Cap rate
0.6%
Rent to Value Ratio

Active
$246,500
3
bds
|
2
ba
|
1,443
sqft
|
built
1988
3122 Edgewood Dr, Dickinson, TX 77539
$-243
Cash flow
-5.1%
Cash-on-Cash Return
4.5%
Cap rate
0.8%
Rent to Value Ratio
Active
$275,000
3
bds
|
2
ba
|
1,043
sqft
|
built
1960
12 Highland Dr, Hitchcock, TX 77563
$-215
Cash flow
-4.1%
Cash-on-Cash Return
4.7%
Cap rate
0.8%
Rent to Value Ratio

Active
$392,000
3
bds
|
3
ba
|
1,818
sqft
|
built
1977
901 Briarmeadow Ave, Friendswood, TX 77546
$-713
Cash flow
-9.5%
Cash-on-Cash Return
3.5%
Cap rate
0.6%
Rent to Value Ratio
Active
$225,000
4
bds
|
2
ba
|
1,845
sqft
|
built
1964
5047 Winding Way, Dickinson, TX 77539
$-141
Cash flow
-3.3%
Cash-on-Cash Return
4.9%
Cap rate
0.8%
Rent to Value Ratio
Active
$365,000
4
bds
|
3
ba
|
2,390
sqft
|
built
2014
216 Morgan Isle Ln, Dickinson, TX 77539
$-661
Cash flow
-9.4%
Cash-on-Cash Return
3.5%
Cap rate
0.7%
Rent to Value Ratio
Active
$385,000
4
bds
|
3
ba
|
2,157
sqft
|
built
1980
100 Saint Andrews Dr, Friendswood, TX 77546
$-419
Cash flow
-5.7%
Cash-on-Cash Return
4.4%
Cap rate
0.7%
Rent to Value Ratio
Active
$314,500
2
bds
|
3
ba
|
1,725
sqft
|
built
1985
1140 Marina Bay Dr, Kemah, TX 77565
$-1,009
Cash flow
-16.7%
Cash-on-Cash Return
1.8%
Cap rate
0.6%
Rent to Value Ratio

Active
$699,900
6
bds
|
8
ba
|
3,189
sqft
|
built
2013
2564 E Bayshore Dr, San Leon, TX 77539
$-1,161
Cash flow
-8.7%
Cash-on-Cash Return
3.7%
Cap rate
0.7%
Rent to Value Ratio
Active
$359,000
3
bds
|
2
ba
|
1,624
sqft
|
built
1981
12210 3rd St, Santa Fe, TX 77510
$-181
Cash flow
-2.6%
Cash-on-Cash Return
5.1%
Cap rate
0.6%
Rent to Value Ratio
Active
$450,000
5
bds
|
3
ba
|
2,715
sqft
|
built
2005
880 Shoal Pointe Ln, League City, TX 77573
$-922
Cash flow
-10.7%
Cash-on-Cash Return
3.2%
Cap rate
0.6%
Rent to Value Ratio

Active
$365,000
3
bds
|
2
ba
|
2,468
sqft
|
built
2007
1012 Hyland Ln, League City, TX 77573
$-510
Cash flow
-7.3%
Cash-on-Cash Return
4.0%
Cap rate
0.7%
Rent to Value Ratio
Active
$485,000
2
bds
|
3
ba
|
1,189
sqft
|
built
1984
3580 Mackerel Way, Crystal Beach, TX 77650
$-1,369
Cash flow
-14.7%
Cash-on-Cash Return
2.3%
Cap rate
0.5%
Rent to Value Ratio

Active
$419,900
3
bds
|
2
ba
|
1,525
sqft
|
built
2019
982 Driftwood Dr, Crystal Beach, TX 77650
$-567
Cash flow
-7.0%
Cash-on-Cash Return
4.1%
Cap rate
0.7%
Rent to Value Ratio

Active
$570,000
3
bds
|
2
ba
|
1,450
sqft
|
built
2013
2383 Sandpiper, Crystal Beach, TX 77650
$-1,312
Cash flow
-12.0%
Cash-on-Cash Return
2.9%
Cap rate
0.5%
Rent to Value Ratio
Active
$624,900
3
bds
|
4
ba
|
3,749
sqft
|
built
1997
331 Creekside Dr, League City, TX 77573
$-1,123
Cash flow
-9.4%
Cash-on-Cash Return
3.5%
Cap rate
0.6%
Rent to Value Ratio
Active
$359,900
3
bds
|
2
ba
|
1,895
sqft
|
built
2010
506 Redbridge Ln, League City, TX 77573
$-754
Cash flow
-10.9%
Cash-on-Cash Return
3.2%
Cap rate
0.6%
Rent to Value Ratio
Active
$450,000
4
bds
|
2
ba
|
2,456
sqft
|
built
1990
2658 Concord Dr, League City, TX 77573
$-831
Cash flow
-9.6%
Cash-on-Cash Return
3.5%
Cap rate
0.6%
Rent to Value Ratio