Algonquin, IL Investment Properties for Sale
Browse homes for sale and investment properties in Algonquin, IL. Refine your search by price, property type, or more.
Best cash flowing properties in Algonquin, IL
Active
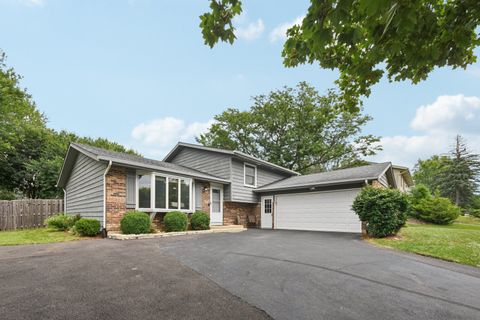
$399,900
3
bds
|
3
ba
|
2,452
sqft
|
built
1977
610 Chelsea Dr, Algonquin, IL 60102
$-220
Cash flow
-2.9%
Cash-on-Cash Return
5.0%
Cap rate
0.8%
Rent to Value Ratio

Active
$284,900
2
bds
|
2
ba
|
1,300
sqft
|
built
1988
2125 Teton Pkwy, Algonquin, IL 60102
$-281
Cash flow
-5.1%
Cash-on-Cash Return
4.5%
Cap rate
0.9%
Rent to Value Ratio
16 out of 18 properties for sale in Algonquin, IL
Limited Results Shown
Create a free account, or log in to reveal all property listings and enjoy the complete experience.

Active
$599,900
4
bds
|
4
ba
|
4,806
sqft
|
built
2000
1521 Boulder Bluff Ln, Algonquin, IL 60102
$-1,206
Cash flow
-10.5%
Cash-on-Cash Return
3.3%
Cap rate
0.6%
Rent to Value Ratio

Active
$489,900
4
bds
|
4
ba
|
3,383
sqft
|
built
1999
8 Hithergreen Ct, Algonquin, IL 60102
$-1,233
Cash flow
-13.1%
Cash-on-Cash Return
2.7%
Cap rate
0.6%
Rent to Value Ratio

Active
$425,000
3
bds
|
3
ba
|
1,736
sqft
|
built
1976
1025 Harper Dr, Algonquin, IL 60102
$-632
Cash flow
-7.8%
Cash-on-Cash Return
3.9%
Cap rate
0.7%
Rent to Value Ratio

Active
$569,900
4
bds
|
5
ba
|
3,386
sqft
|
built
2001
2305 Tracy Ln, Algonquin, IL 60102
$-920
Cash flow
-8.4%
Cash-on-Cash Return
3.7%
Cap rate
0.7%
Rent to Value Ratio

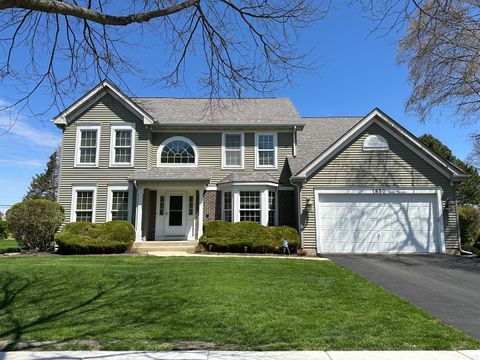
Active
$434,000
4
bds
|
3
ba
|
2,600
sqft
|
built
1990
761 Mayfair Ln, Algonquin, IL 60102
$-1,147
Cash flow
-13.8%
Cash-on-Cash Return
2.5%
Cap rate
0.6%
Rent to Value Ratio

Active
$355,000
4
bds
|
3
ba
|
2,239
sqft
|
built
1990
643 Kingsbury Ct, Algonquin, IL 60102
$-710
Cash flow
-10.4%
Cash-on-Cash Return
3.3%
Cap rate
0.7%
Rent to Value Ratio

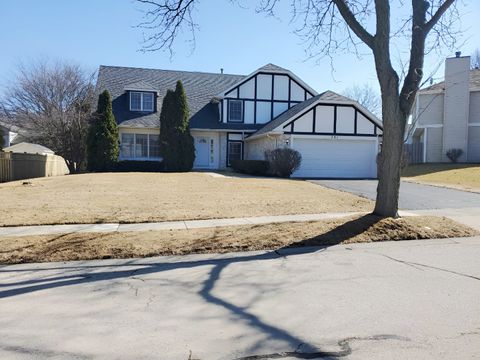
Active
$429,900
4
bds
|
3
ba
|
1,872
sqft
|
built
1975
11712 Westend Dr, Algonquin, IL 60102
$-605
Cash flow
-7.3%
Cash-on-Cash Return
4.0%
Cap rate
0.7%
Rent to Value Ratio

Active
$675,000
5
bds
|
6
ba
|
3,857
sqft
|
built
2001
1321 Ivy Ln, Algonquin, IL 60102
$-1,712
Cash flow
-13.2%
Cash-on-Cash Return
2.6%
Cap rate
0.5%
Rent to Value Ratio

Active
$289,900
2
bds
|
3
ba
|
1,398
sqft
|
built
1994
210 Grandview Ct, Algonquin, IL 60102
$-517
Cash flow
-9.3%
Cash-on-Cash Return
3.5%
Cap rate
0.8%
Rent to Value Ratio

Active
$609,900
5
bds
|
3
ba
|
3,200
sqft
|
built
1997
2219 Barrett Dr, Algonquin, IL 60102
$-1,139
Cash flow
-9.7%
Cash-on-Cash Return
3.4%
Cap rate
0.6%
Rent to Value Ratio

Active
$625,000
5
bds
|
4
ba
|
3,557
sqft
|
built
2015
3756 Innesbrook Ct, Algonquin, IL 60102
$-1,265
Cash flow
-10.6%
Cash-on-Cash Return
3.3%
Cap rate
0.6%
Rent to Value Ratio
Active
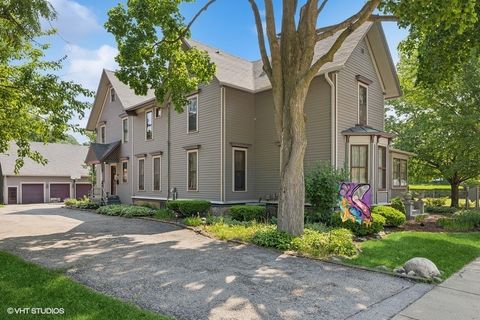
$550,000
6
bds
|
5
ba
|
3,437
sqft
|
built
1886
314 Washington St, Algonquin, IL 60102
$-887
Cash flow
-8.4%
Cash-on-Cash Return
3.7%
Cap rate
0.7%
Rent to Value Ratio
Active
$374,900
5
bds
|
3
ba
|
2,772
sqft
|
built
1992
731 Roaring Brook Ln, Algonquin, IL 60102
$-413
Cash flow
-5.7%
Cash-on-Cash Return
4.4%
Cap rate
0.9%
Rent to Value Ratio
Active
$485,000
4
bds
|
3
ba
|
2,672
sqft
|
built
1994
1850 White Oak Dr, Algonquin, IL 60102
$-604
Cash flow
-6.5%
Cash-on-Cash Return
4.2%
Cap rate
0.7%
Rent to Value Ratio