Cicero, IL Investment Properties for Sale
Browse homes for sale and investment properties in Cicero, IL. Refine your search by price, property type, or more.
Best cash flowing properties in Cicero, IL
Active
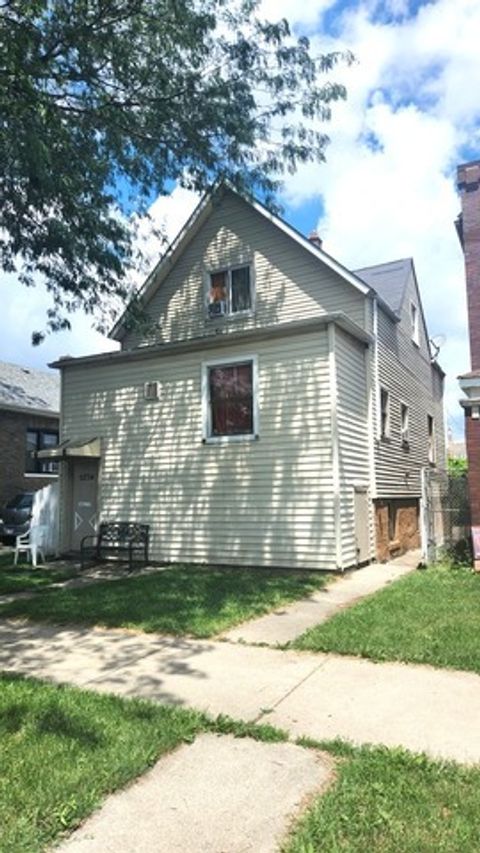
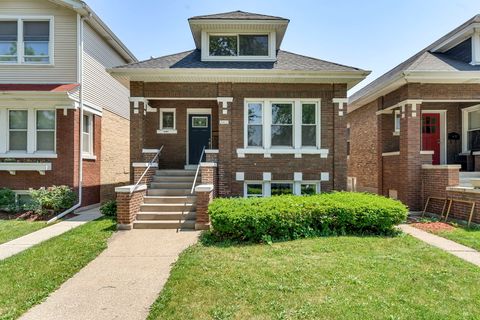
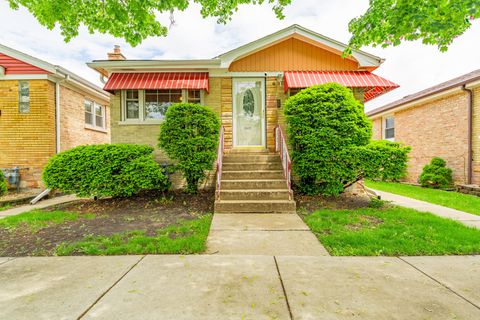
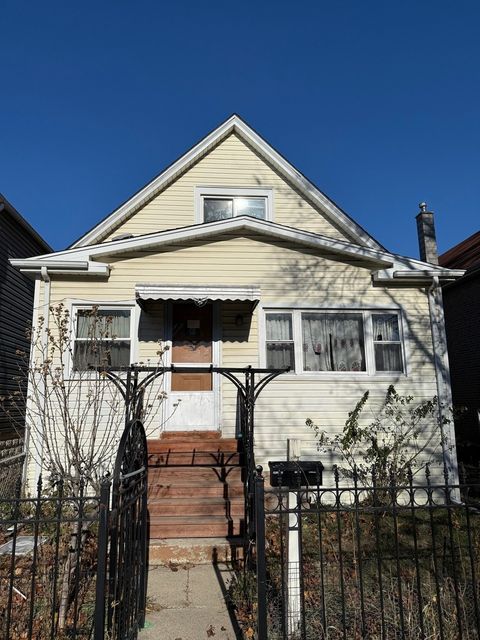
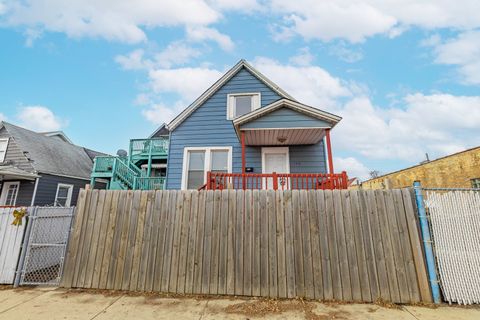
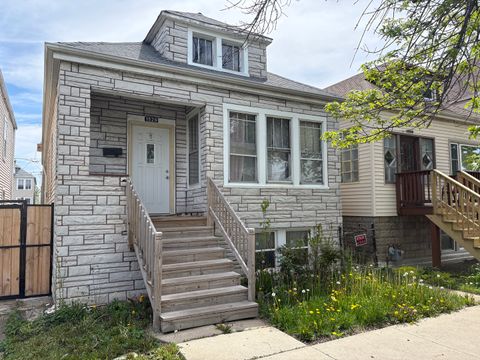
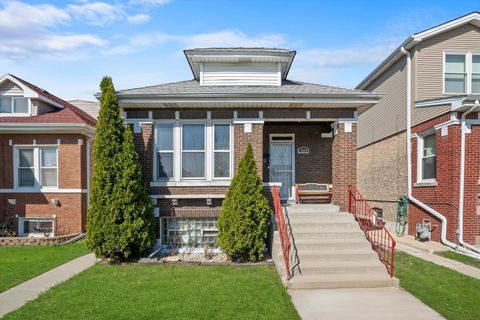
$220,000
3
bds
|
2
ba
|
0
sqft
|
built
1911
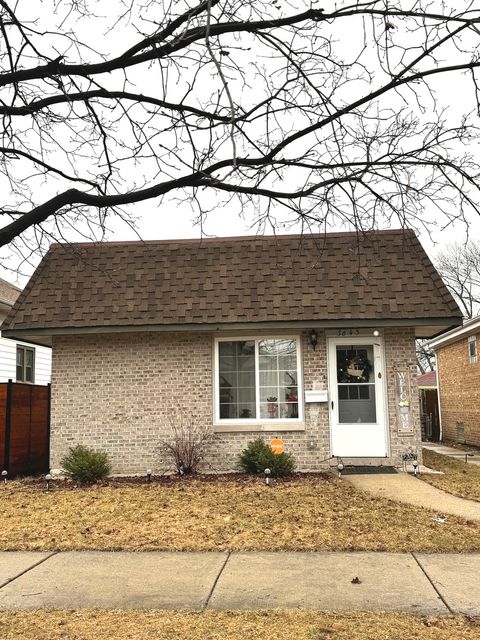
5234 W 25th Pl, Cicero, IL 60804
$477
Cash flow
11.3%
Cash-on-Cash Return
8.3%
Cap rate
1.0%
Rent to Value Ratio
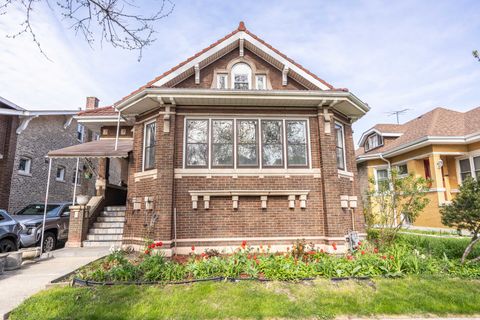
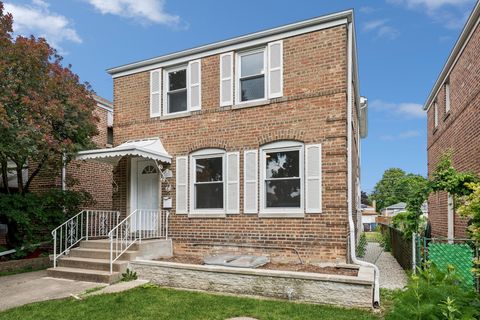
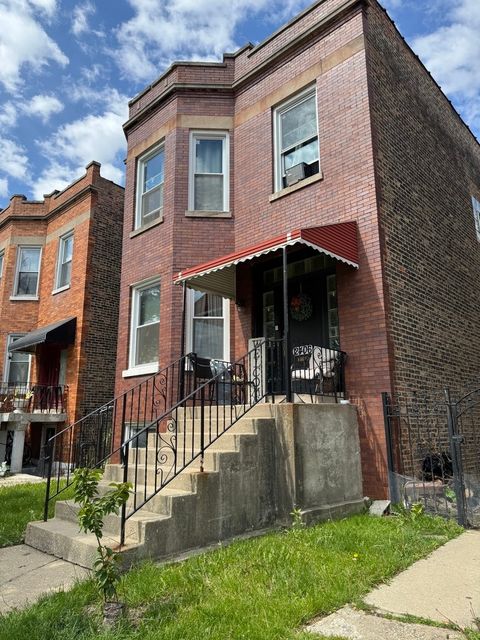
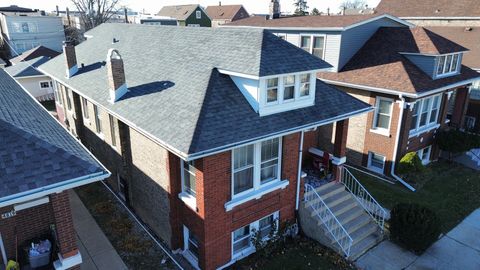
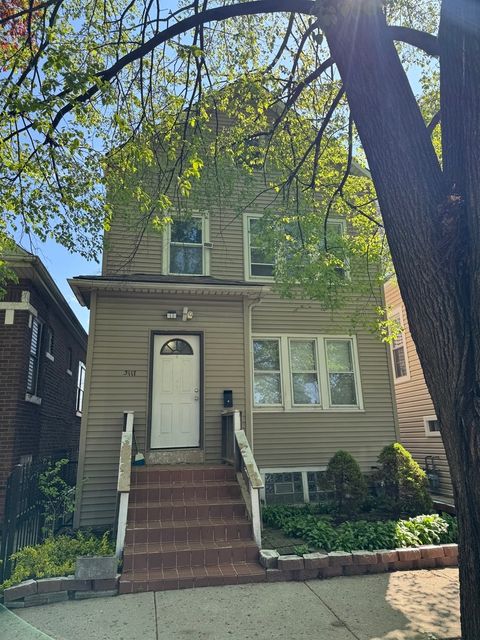
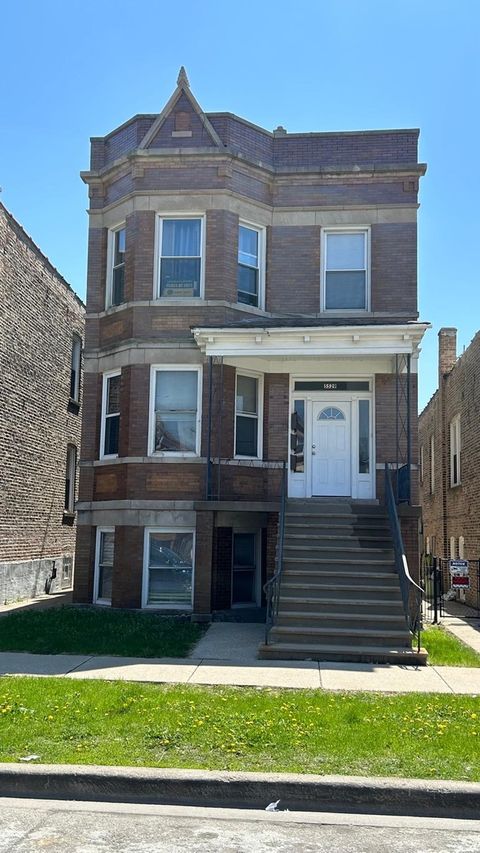
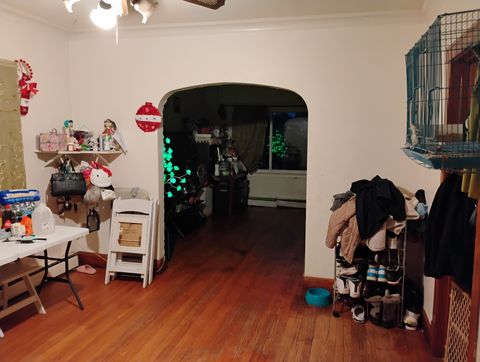
Active
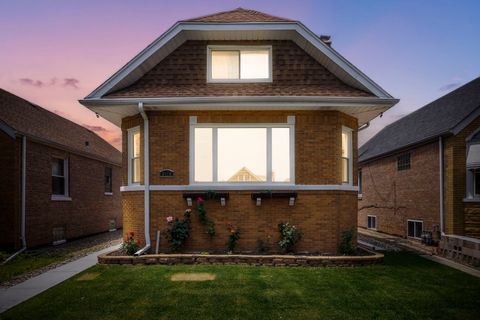
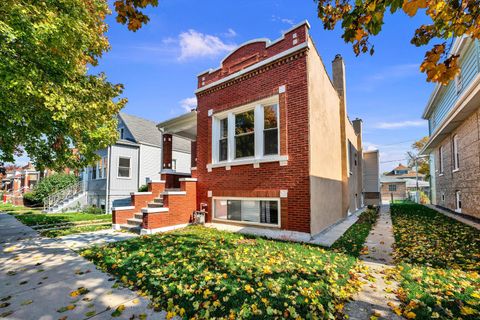
$420,000
5
bds
|
3
ba
|
2,700
sqft
|
built
1922
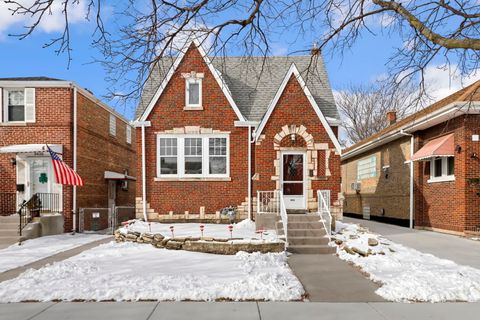
1638 S Austin Blvd, Cicero, IL 60804
$318
Cash flow
4.0%
Cash-on-Cash Return
6.6%
Cap rate
0.8%
Rent to Value Ratio
42 out of 47 properties for sale in Cicero, IL
Limited Results Shown
Create a free account, or log in to reveal all property listings and enjoy the complete experience.
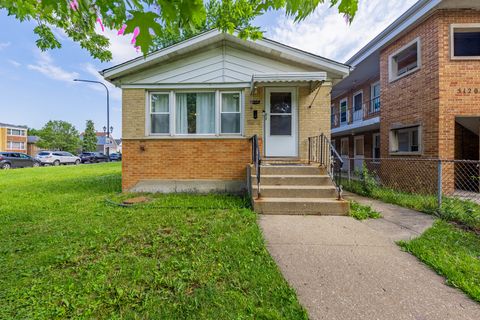
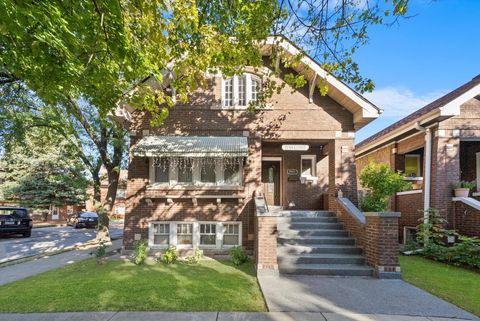
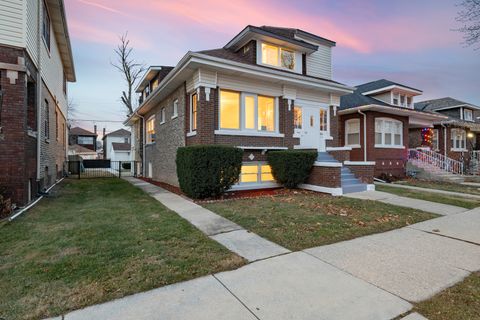
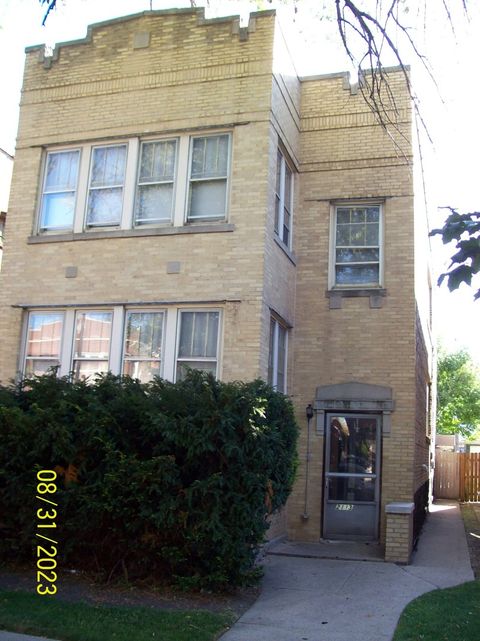
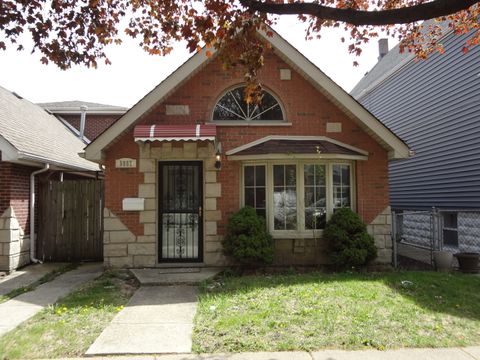
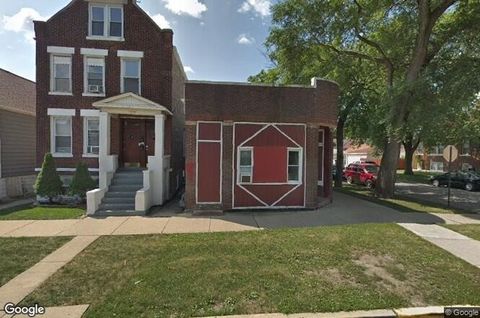
Active
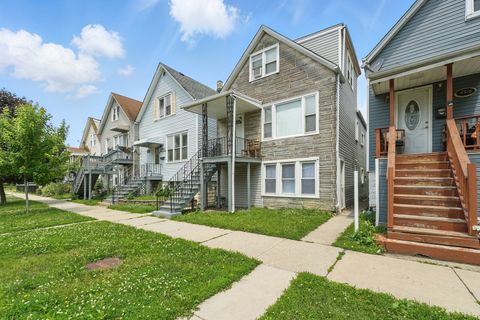
$274,900
3
bds
|
1
ba
|
0
sqft
|
built
1962
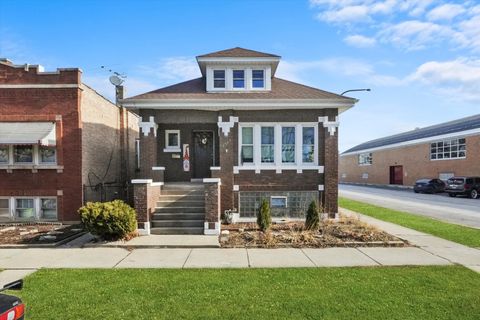
5124 W 32nd Pl, Cicero, IL 60804
$-294
Cash flow
-5.6%
Cash-on-Cash Return
4.4%
Cap rate
0.8%
Rent to Value Ratio
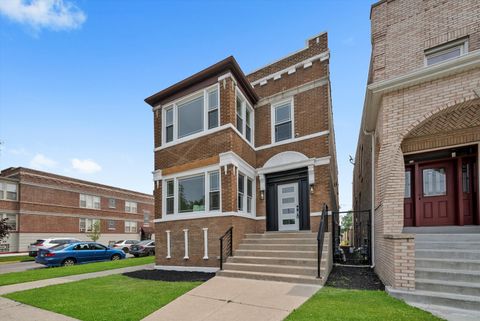
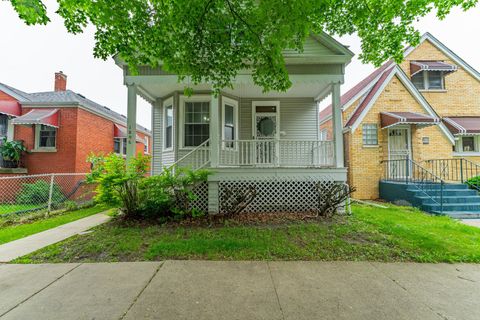
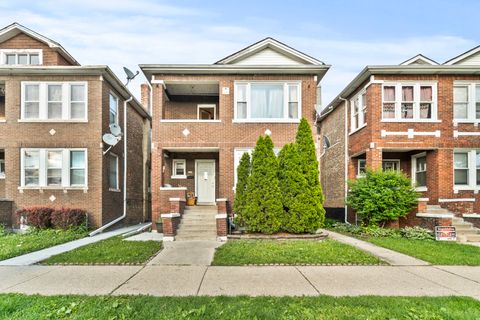
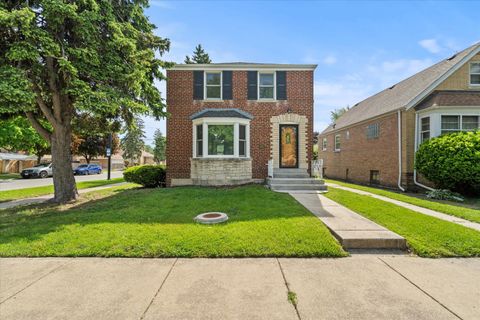
Active
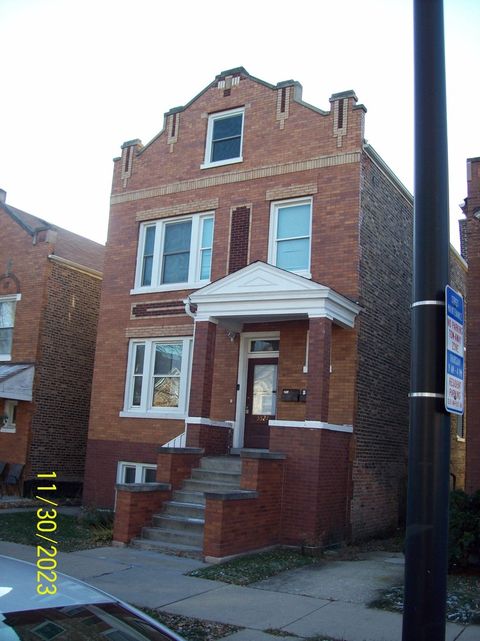
$614,900
6
bds
|
4
ba
|
0
sqft
|
built
1916
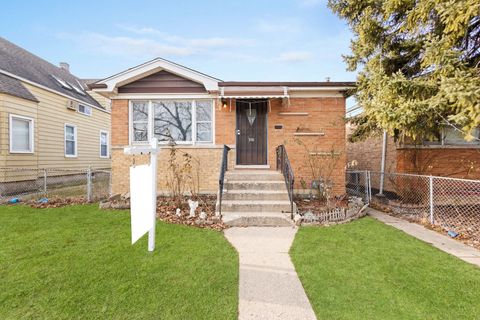
2101 S 48th Ct, Cicero, IL 60804
$-2,514
Cash flow
-21.3%
Cash-on-Cash Return
0.8%
Cap rate
0.3%
Rent to Value Ratio
Active
$489,000
3
bds
|
2
ba
|
3,600
sqft
|
built
1918
2407 S 60th Ct, Cicero, IL 60804
$-792
Cash flow
-8.5%
Cash-on-Cash Return
3.7%
Cap rate
0.5%
Rent to Value Ratio
Active
$449,500
4
bds
|
3
ba
|
2,075
sqft
|
built
1949
3529 S 54th Ave, Cicero, IL 60804
$-552
Cash flow
-6.4%
Cash-on-Cash Return
4.2%
Cap rate
0.7%
Rent to Value Ratio
Active
$335,000
3
bds
|
2
ba
|
1,470
sqft
|
built
1924
1901 S 61st Ct, Cicero, IL 60804
$-167
Cash flow
-2.6%
Cash-on-Cash Return
5.1%
Cap rate
0.9%
Rent to Value Ratio
Active
$269,998
3
bds
|
1
ba
|
1,275
sqft
|
built
1898
1806 S 57th Ct, Cicero, IL 60804
$-175
Cash flow
-3.4%
Cash-on-Cash Return
5.5%
Cap rate
0.9%
Rent to Value Ratio
Active
$350,000
6
bds
|
2
ba
|
0
sqft
|
built
1912
2406 S 50th Ave, Cicero, IL 60804
$-831
Cash flow
-12.4%
Cash-on-Cash Return
2.8%
Cap rate
0.6%
Rent to Value Ratio

Active
$538,999
6
bds
|
4
ba
|
0
sqft
|
built
1912
5228 W 23rd St, Cicero, IL 60804
$-2,428
Cash flow
-23.5%
Cash-on-Cash Return
0.3%
Cap rate
0.3%
Rent to Value Ratio
Active
$301,000
3
bds
|
1
ba
|
1,150
sqft
|
built
1922
1932 S 59th Ave, Cicero, IL 60804
$-554
Cash flow
-9.6%
Cash-on-Cash Return
4.0%
Cap rate
0.7%
Rent to Value Ratio
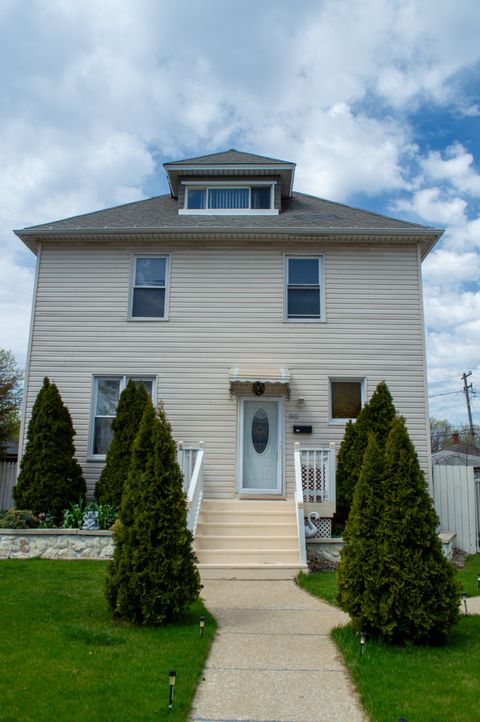
Active
$320,000
5
bds
|
2
ba
|
2,550
sqft
|
built
1898
2632 S Austin Blvd, Cicero, IL 60804
$-278
Cash flow
-4.5%
Cash-on-Cash Return
4.6%
Cap rate
0.9%
Rent to Value Ratio
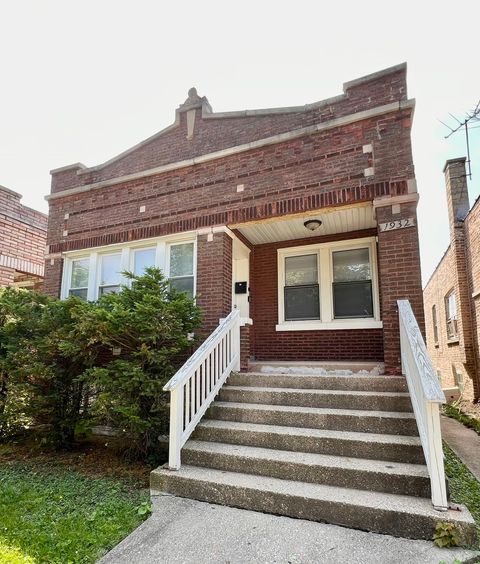
Active
$230,000
3
bds
|
2
ba
|
1,005
sqft
|
built
1916
5720 W 23rd St, Cicero, IL 60804
$-178
Cash flow
-4.0%
Cash-on-Cash Return
4.7%
Cap rate
0.9%
Rent to Value Ratio
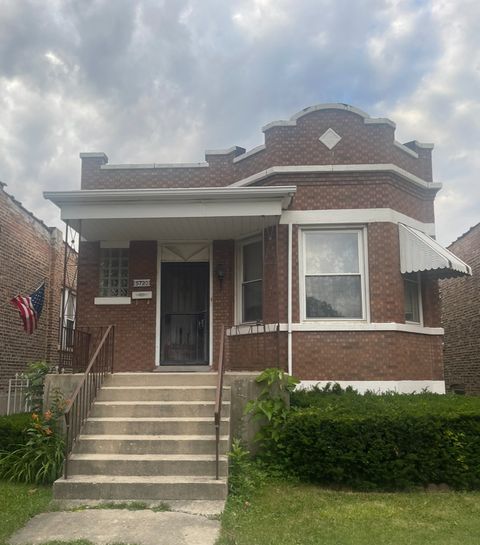
Active
$339,900
3
bds
|
2
ba
|
1,956
sqft
|
built
1958
3631 S 54th Ave, Cicero, IL 60804
$-407
Cash flow
-6.2%
Cash-on-Cash Return
4.2%
Cap rate
0.8%
Rent to Value Ratio
Active
$369,000
3
bds
|
2
ba
|
1,850
sqft
|
built
1929
3408 S 58th Ave, Cicero, IL 60804
$-604
Cash flow
-8.5%
Cash-on-Cash Return
3.7%
Cap rate
0.7%
Rent to Value Ratio
Active
$389,000
6
bds
|
2
ba
|
0
sqft
|
built
1908
4918 W 28th Pl, Cicero, IL 60804
$-1,357
Cash flow
-18.2%
Cash-on-Cash Return
1.5%
Cap rate
0.4%
Rent to Value Ratio
Active
$364,900
2
bds
|
2
ba
|
0
sqft
|
built
1913
5527 W 24th Pl, Cicero, IL 60804
$-1,550
Cash flow
-22.2%
Cash-on-Cash Return
0.6%
Cap rate
0.4%
Rent to Value Ratio
Active
$280,000
5
bds
|
3
ba
|
1,738
sqft
|
built
1908
5322 W 23rd St, Cicero, IL 60804
$-362
Cash flow
-6.7%
Cash-on-Cash Return
4.1%
Cap rate
0.8%
Rent to Value Ratio
Active
$275,000
3
bds
|
2
ba
|
1,667
sqft
|
built
1919
4821 W 24th St, Cicero, IL 60804
$-310
Cash flow
-5.9%
Cash-on-Cash Return
4.3%
Cap rate
0.8%
Rent to Value Ratio
Active
$399,900
5
bds
|
3
ba
|
0
sqft
|
built
1924
1634 S 58th Ct, Cicero, IL 60804
$-870
Cash flow
-11.4%
Cash-on-Cash Return
3.1%
Cap rate
0.6%
Rent to Value Ratio
Active
$350,000
5
bds
|
3
ba
|
0
sqft
|
built
1924
1639 S 58th Ct, Cicero, IL 60804
$-834
Cash flow
-12.4%
Cash-on-Cash Return
2.8%
Cap rate
0.6%
Rent to Value Ratio

Active
$525,000
7
bds
|
3
ba
|
0
sqft
|
built
1914
1918 S 57th Ave, Cicero, IL 60804
$-2,072
Cash flow
-20.6%
Cash-on-Cash Return
0.9%
Cap rate
0.3%
Rent to Value Ratio
Active
$234,900
4
bds
|
1
ba
|
1,323
sqft
|
built
1910
1418 S Cicero Ave, Cicero, IL 60804
$52
Cash flow
1.2%
Cash-on-Cash Return
5.9%
Cap rate
1.0%
Rent to Value Ratio
Active
$419,999
3
bds
|
2
ba
|
1,900
sqft
|
built
1920
2517 S 59th Ct, Cicero, IL 60804
$-249
Cash flow
-3.1%
Cash-on-Cash Return
5.0%
Cap rate
0.7%
Rent to Value Ratio
Active
$369,900
4
bds
|
2
ba
|
0
sqft
|
built
1924
2113 S 51st Ave, Cicero, IL 60804
$-1,326
Cash flow
-18.7%
Cash-on-Cash Return
1.4%
Cap rate
0.5%
Rent to Value Ratio
Active
$339,900
3
bds
|
2
ba
|
1,165
sqft
|
built
1945
3601 S 57th Ct, Cicero, IL 60804
$-458
Cash flow
-7.0%
Cash-on-Cash Return
4.1%
Cap rate
0.6%
Rent to Value Ratio
Active
$199,900
6
bds
|
3
ba
|
0
sqft
|
built
1923
1529 S 50th Ct, Cicero, IL 60804
$-872
Cash flow
-22.8%
Cash-on-Cash Return
0.4%
Cap rate
0.9%
Rent to Value Ratio
Active
$210,000
2
bds
|
2
ba
|
2,016
sqft
|
built
1918
2439 S 57th Ave, Cicero, IL 60804
$312
Cash flow
7.8%
Cash-on-Cash Return
7.5%
Cap rate
1.0%
Rent to Value Ratio
Active
$319,000
4
bds
|
2
ba
|
0
sqft
|
built
1913
3117 S 53rd Ave, Cicero, IL 60804
$-1,192
Cash flow
-19.5%
Cash-on-Cash Return
1.8%
Cap rate
0.4%
Rent to Value Ratio
Active
$379,900
3
bds
|
3
ba
|
1,653
sqft
|
built
2007
5057 W 32nd Pl, Cicero, IL 60804
$-672
Cash flow
-9.2%
Cash-on-Cash Return
3.6%
Cap rate
0.7%
Rent to Value Ratio
Active
$290,000
4
bds
|
2
ba
|
1,182
sqft
|
built
1922
1314 S 59th Ct, Cicero, IL 60804
$-312
Cash flow
-5.6%
Cash-on-Cash Return
4.4%
Cap rate
0.8%
Rent to Value Ratio
Active
$464,900
8
bds
|
3
ba
|
0
sqft
|
built
1910
5529 W 22nd Pl, Cicero, IL 60804
$-1,381
Cash flow
-15.5%
Cash-on-Cash Return
2.1%
Cap rate
0.4%
Rent to Value Ratio

Active
$370,000
5
bds
|
3
ba
|
0
sqft
|
built
1928
1622 S 48th Ct, Cicero, IL 60804
$-1,020
Cash flow
-14.4%
Cash-on-Cash Return
2.4%
Cap rate
0.5%
Rent to Value Ratio
Active
$259,000
4
bds
|
2
ba
|
1,381
sqft
|
built
1925
3115 S 53rd Ct, Cicero, IL 60804
$-235
Cash flow
-4.7%
Cash-on-Cash Return
4.6%
Cap rate
0.8%
Rent to Value Ratio
Active
$379,900
6
bds
|
3
ba
|
0
sqft
|
built
1927
5241 W 30th St, Cicero, IL 60804
$-1,430
Cash flow
-19.6%
Cash-on-Cash Return
1.2%
Cap rate
0.5%
Rent to Value Ratio
Active
$259,999
3
bds
|
1
ba
|
756
sqft
|
built
1919
3645 S 53rd Ave, Cicero, IL 60804
$-261
Cash flow
-5.2%
Cash-on-Cash Return
4.5%
Cap rate
0.8%
Rent to Value Ratio
Active
$335,000
3
bds
|
1
ba
|
1,234
sqft
|
built
1940
3418 S 59th Ave, Cicero, IL 60804
$-603
Cash flow
-9.4%
Cash-on-Cash Return
3.5%
Cap rate
0.7%
Rent to Value Ratio
Active
$325,000
3
bds
|
2
ba
|
1,456
sqft
|
built
1923
2345 S 59th Ct, Cicero, IL 60804
$-198
Cash flow
-3.2%
Cash-on-Cash Return
4.9%
Cap rate
0.9%
Rent to Value Ratio
Active
$300,000
3
bds
|
1
ba
|
1,008
sqft
|
built
1960
3606 S 53rd Ct, Cicero, IL 60804
$-309
Cash flow
-5.4%
Cash-on-Cash Return
4.4%
Cap rate
0.8%
Rent to Value Ratio
Active
$274,000
3
bds
|
3
ba
|
1,680
sqft
|
built
1955
3235 S 50th Ct, Cicero, IL 60804
$-358
Cash flow
-6.8%
Cash-on-Cash Return
4.1%
Cap rate
0.8%
Rent to Value Ratio