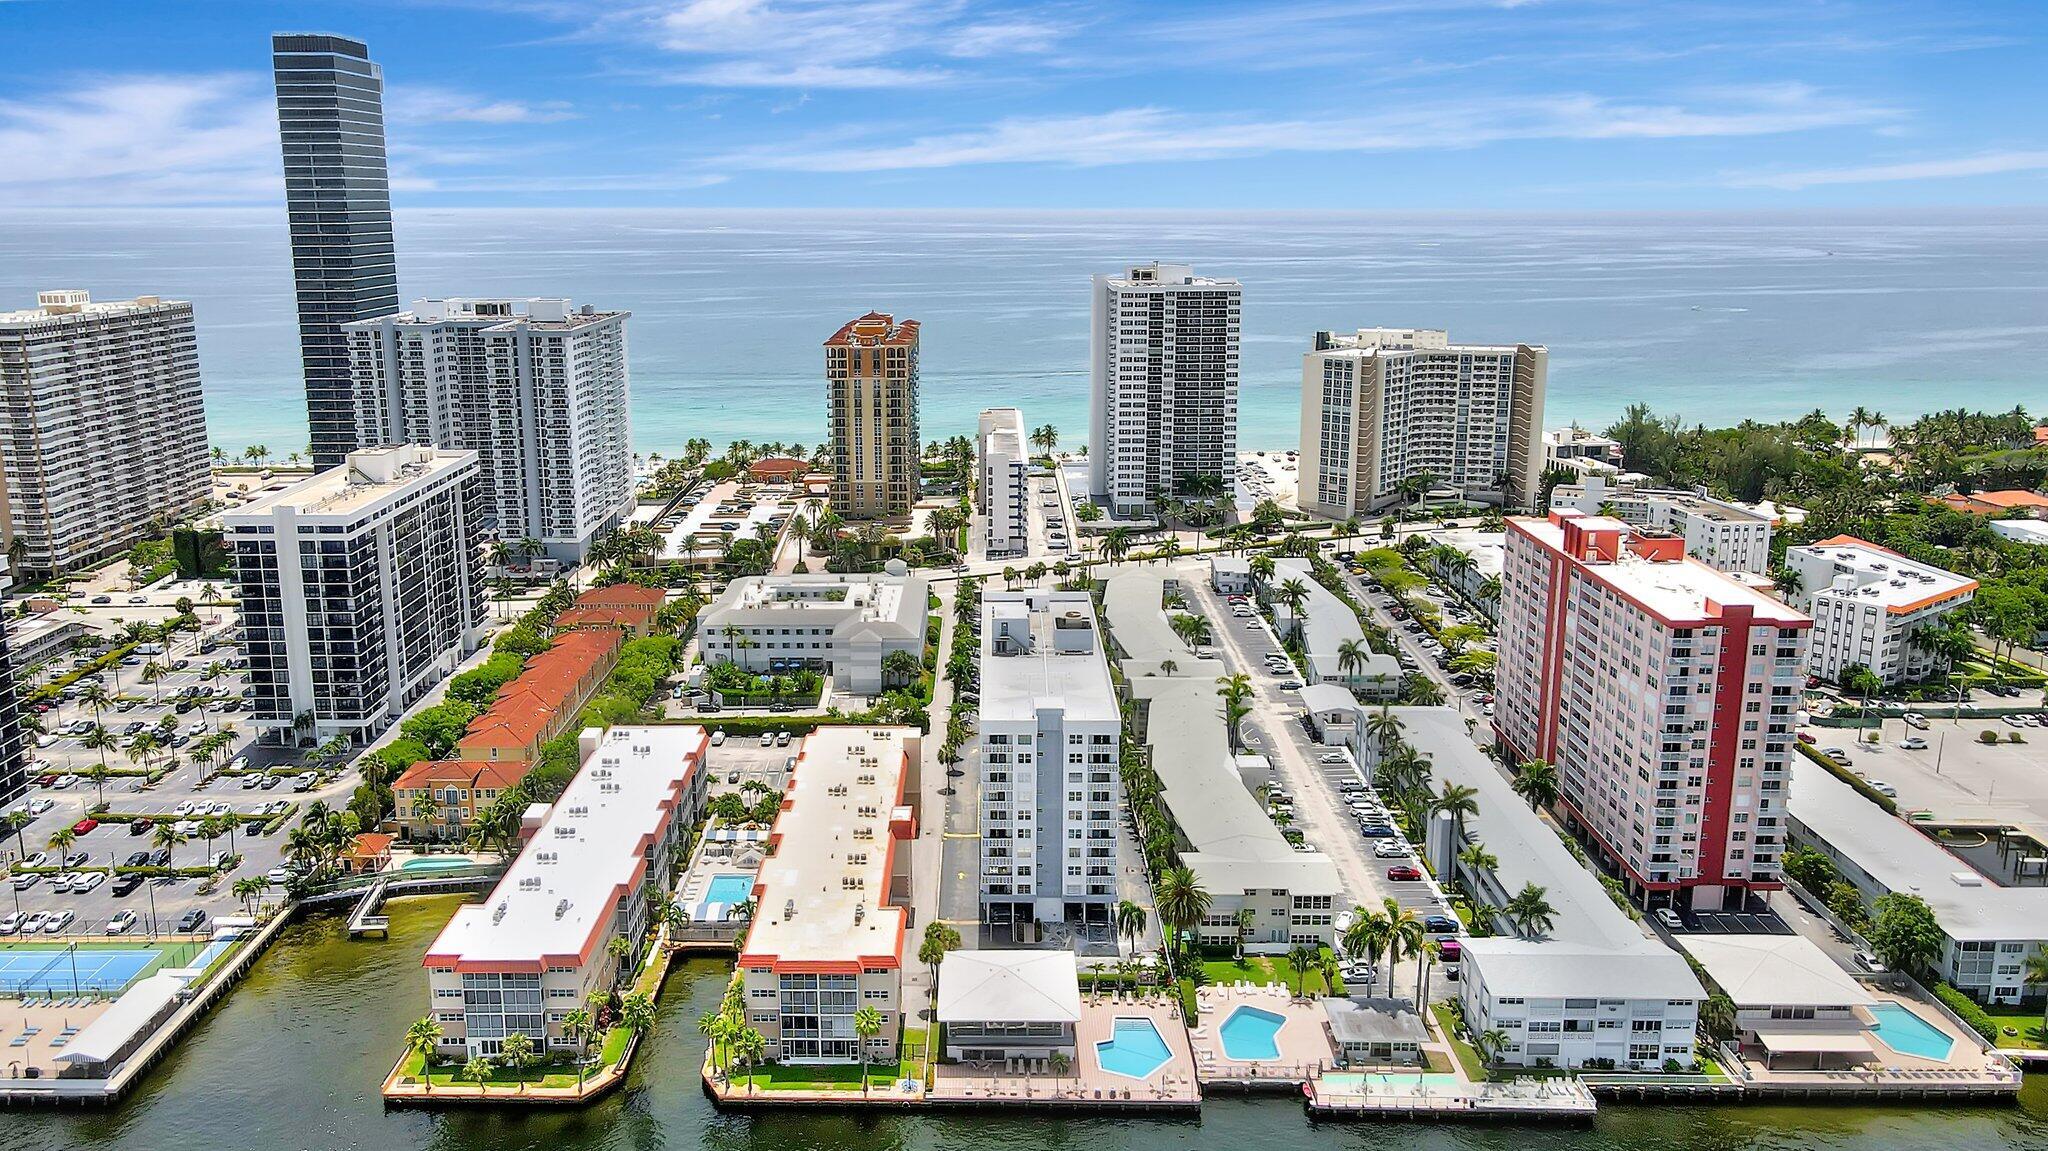
Hallandale Beach, FL Investment Properties for Sale
Browse homes for sale and investment properties in Hallandale Beach, FL. Refine your search by price, property type, or more.
Best cash flowing properties in Hallandale Beach, FL
Active
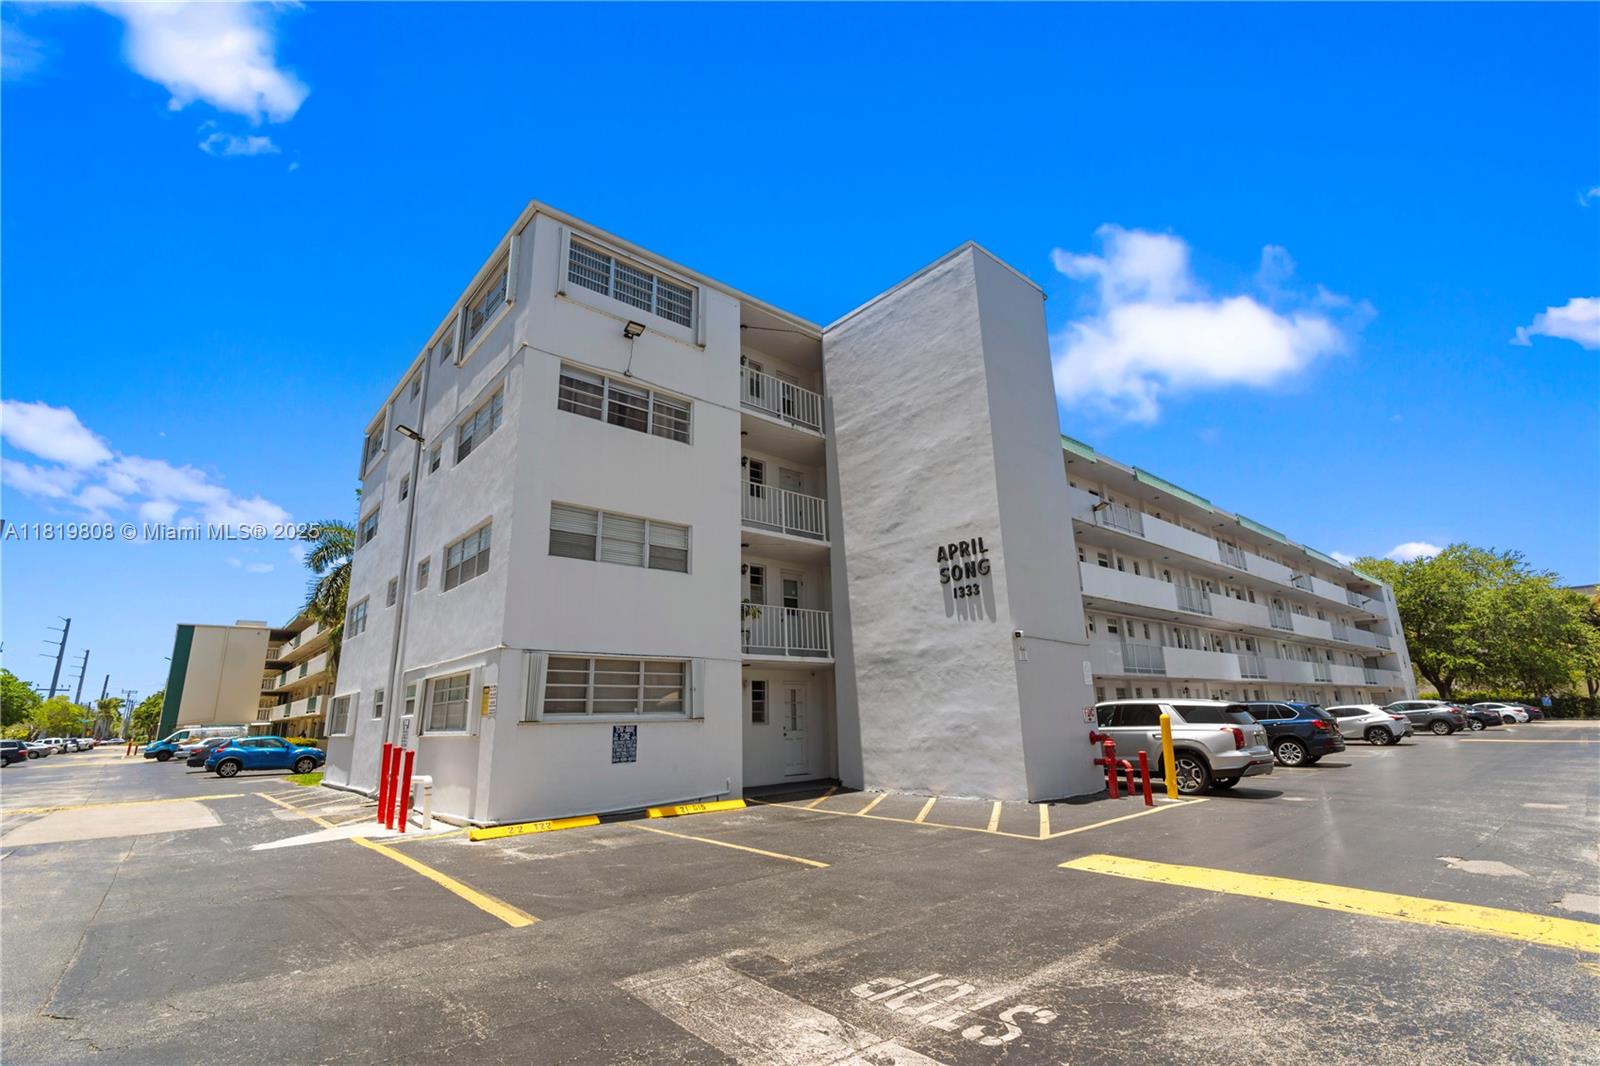
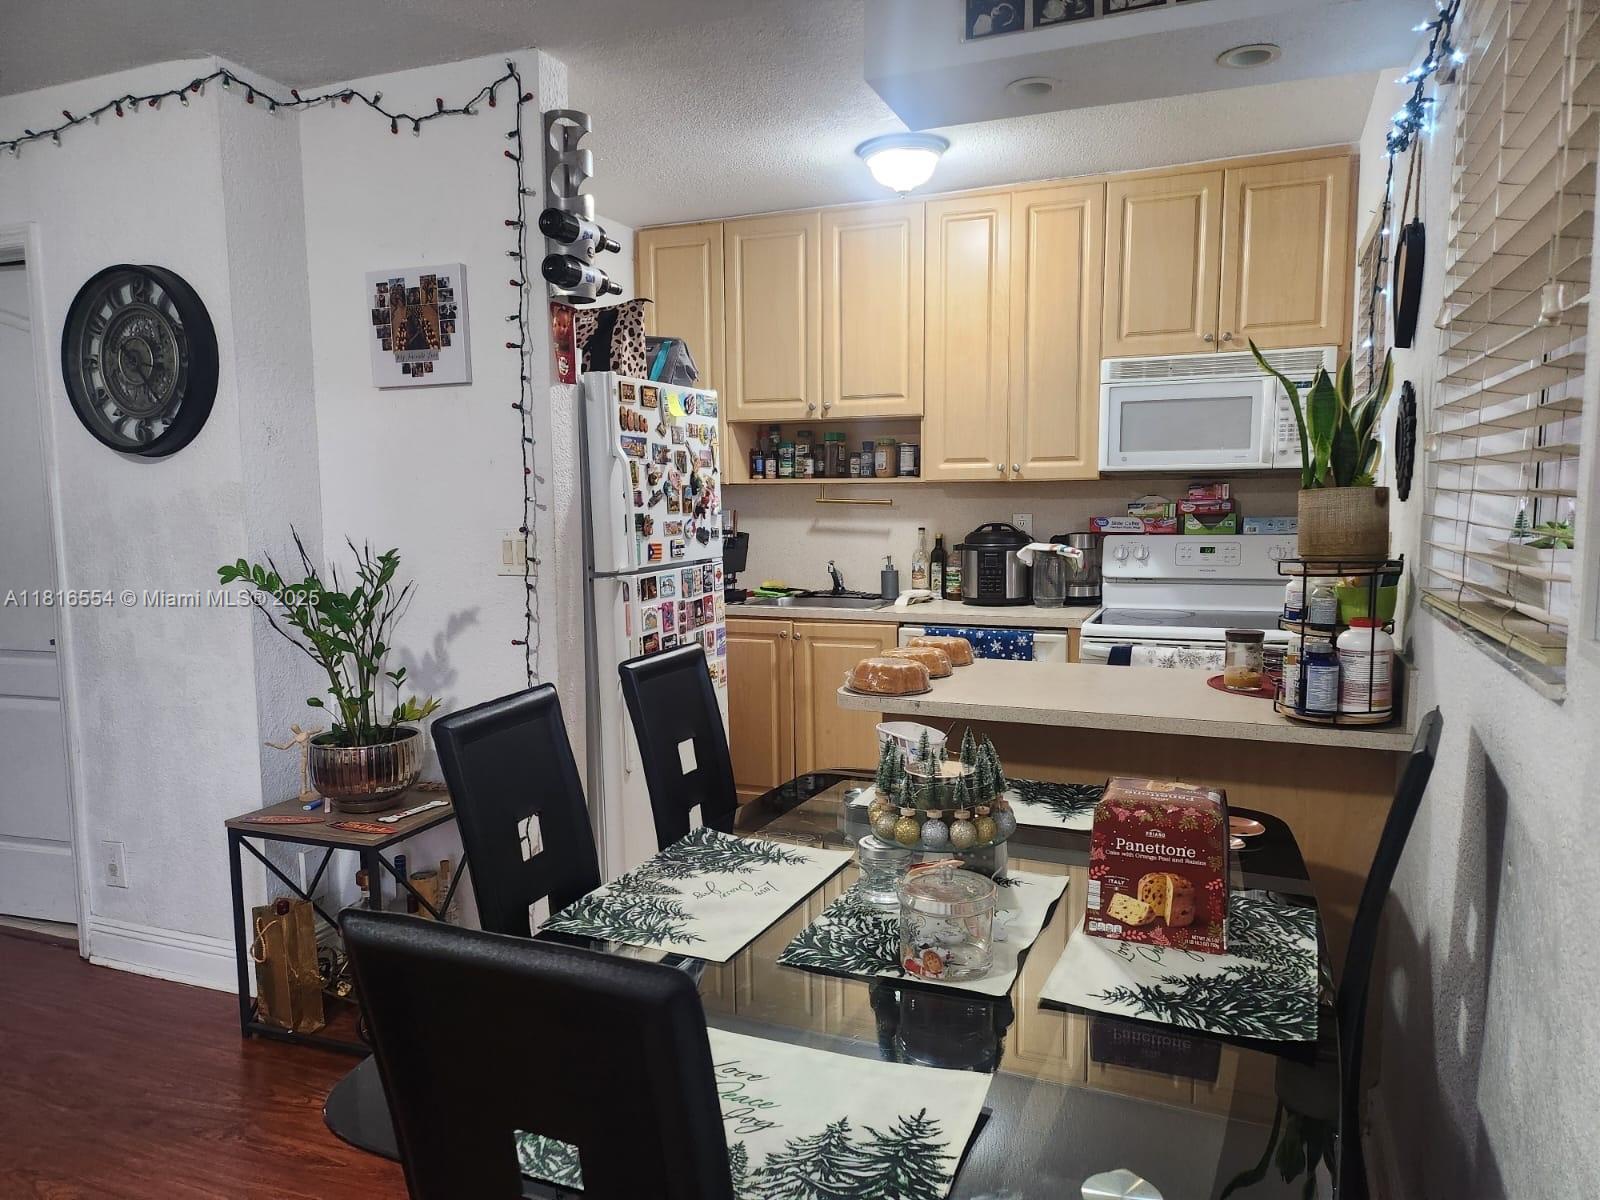
$177,777
1
bds
|
1
ba
|
648
sqft
|
built
1966
1333 E Hallandale Beach Blvd, Hallandale Beach, FL 33009
$-152
Cash flow
-4.5%
Cash-on-Cash Return
5.3%
Cap rate
1.1%
Rent to Value Ratio
Active
$199,950
2
bds
|
1
ba
|
686
sqft
|
built
1970
110 SE 2nd St, Hallandale Beach, FL 33009
$-216
Cash flow
-5.6%
Cash-on-Cash Return
5.0%
Cap rate
0.9%
Rent to Value Ratio
832 out of 930 properties for sale in Hallandale Beach, FL
Limited Results Shown
Create a free account, or log in to reveal all property listings and enjoy the complete experience.
Active
$335,000
2
bds
|
2
ba
|
1,450
sqft
|
built
1974
2101 Atlantic Shores Blvd, Hallandale Beach, FL 33009
$-692
Cash flow
-10.8%
Cash-on-Cash Return
3.8%
Cap rate
0.8%
Rent to Value Ratio
Active
$339,000
2
bds
|
2
ba
|
1,060
sqft
|
built
1972
1833 S Ocean Dr, Hallandale Beach, FL 33009
$-1,488
Cash flow
-22.9%
Cash-on-Cash Return
1.0%
Cap rate
0.6%
Rent to Value Ratio

Active
$358,990
2
bds
|
2
ba
|
1,500
sqft
|
built
1970
401 Golden Isles Dr, Hallandale Beach, FL 33009
$-1,563
Cash flow
-22.7%
Cash-on-Cash Return
1.1%
Cap rate
0.8%
Rent to Value Ratio
Active
$319,000
1
bds
|
2
ba
|
1,300
sqft
|
built
1974
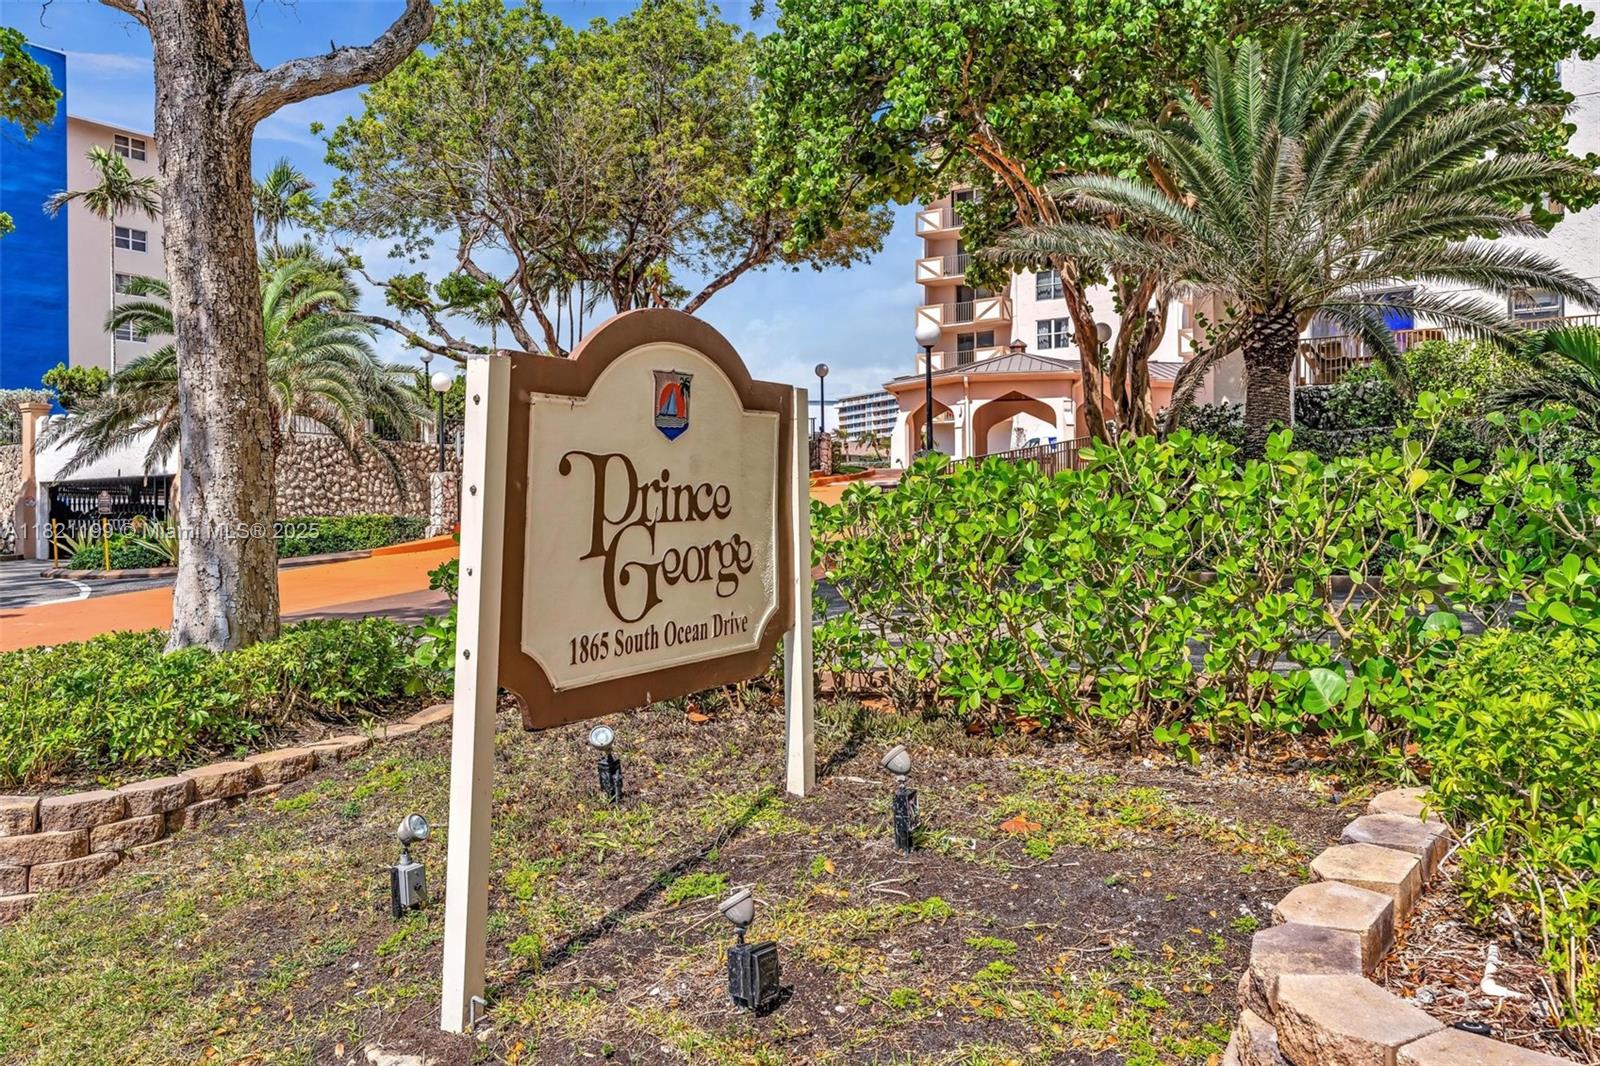
1865 S Ocean Dr, Hallandale Beach, FL 33009
$-989
Cash flow
-16.2%
Cash-on-Cash Return
2.6%
Cap rate
0.9%
Rent to Value Ratio
Active
$1,450,000
3
bds
|
3
ba
|
1,841
sqft
|
built
2006
1800 S Ocean Dr, Hallandale Beach, FL 33009
$-6,463
Cash flow
-23.3%
Cash-on-Cash Return
0.9%
Cap rate
0.5%
Rent to Value Ratio
Active
$269,000
2
bds
|
2
ba
|
1,280
sqft
|
built
1981
2500 Parkview Dr, Hallandale Beach, FL 33009
$-805
Cash flow
-15.6%
Cash-on-Cash Return
2.7%
Cap rate
1.0%
Rent to Value Ratio
Active
$1,470,000
3
bds
|
3
ba
|
1,675
sqft
|
built
2006
1830 S Ocean Dr, Hallandale Beach, FL 33009
$-6,480
Cash flow
-23.0%
Cash-on-Cash Return
1.0%
Cap rate
0.4%
Rent to Value Ratio
Active
$899,888
bds
|
0
ba
|
2,287
sqft
|
built
1970
220 SW 8th Ave, Hallandale Beach, FL 33009
$-3,753
Cash flow
-21.8%
Cash-on-Cash Return
1.3%
Cap rate
0.3%
Rent to Value Ratio
Active
$375,000
2
bds
|
2
ba
|
1,270
sqft
|
built
2007
1755 E Hallandale Beach Blvd, Hallandale Beach, FL 33009
$-239
Cash flow
-3.3%
Cash-on-Cash Return
5.5%
Cap rate
0.8%
Rent to Value Ratio
Active
$190,000
1
bds
|
2
ba
|
719
sqft
|
built
1970
1801 S Ocean Dr, Hallandale Beach, FL 33009
$-751
Cash flow
-20.6%
Cash-on-Cash Return
1.5%
Cap rate
1.1%
Rent to Value Ratio
Active
$959,000
3
bds
|
3
ba
|
1,571
sqft
|
built
2006
1800 S Ocean Dr, Hallandale Beach, FL 33009
$-4,737
Cash flow
-25.8%
Cash-on-Cash Return
0.4%
Cap rate
0.5%
Rent to Value Ratio
Active
$299,000
2
bds
|
3
ba
|
1,280
sqft
|
built
1980
2500 Parkview Dr, Hallandale Beach, FL 33009
$-1,250
Cash flow
-21.8%
Cash-on-Cash Return
1.3%
Cap rate
1.0%
Rent to Value Ratio
Active
$625,000
3
bds
|
2
ba
|
1,449
sqft
|
built
1961
728 SW 4th St, Hallandale Beach, FL 33009
$-1,105
Cash flow
-9.2%
Cash-on-Cash Return
4.2%
Cap rate
0.6%
Rent to Value Ratio
Active
$305,000
2
bds
|
2
ba
|
1,400
sqft
|
built
1975
600 Three Islands Blvd, Hallandale Beach, FL 33009
$-1,399
Cash flow
-23.9%
Cash-on-Cash Return
0.8%
Cap rate
0.9%
Rent to Value Ratio
Active
$299,000
2
bds
|
2
ba
|
1,500
sqft
|
built
1970
401 Golden Isles Dr, Hallandale Beach, FL 33009
$-1,415
Cash flow
-24.7%
Cash-on-Cash Return
0.6%
Cap rate
0.9%
Rent to Value Ratio
Active
$177,777
1
bds
|
1
ba
|
648
sqft
|
built
1966
1333 E Hallandale Beach Blvd, Hallandale Beach, FL 33009
$-152
Cash flow
-4.5%
Cash-on-Cash Return
5.3%
Cap rate
1.1%
Rent to Value Ratio
Active
$259,900
1
bds
|
2
ba
|
870
sqft
|
built
1970
1849 S Ocean Dr, Hallandale Beach, FL 33009
$-1,076
Cash flow
-21.6%
Cash-on-Cash Return
1.3%
Cap rate
0.8%
Rent to Value Ratio
Active
$799,000
2
bds
|
3
ba
|
1,306
sqft
|
built
2007
1945 S Ocean Dr, Hallandale Beach, FL 33009
$-3,494
Cash flow
-22.8%
Cash-on-Cash Return
1.0%
Cap rate
0.5%
Rent to Value Ratio
Active
$170,000
1
bds
|
2
ba
|
868
sqft
|
built
1972
427 Golden Isles Dr, Hallandale Beach, FL 33009
$-485
Cash flow
-14.9%
Cash-on-Cash Return
2.9%
Cap rate
1.3%
Rent to Value Ratio
Active
$365,000
2
bds
|
2
ba
|
1,130
sqft
|
built
1979
600 Parkview Dr, Hallandale Beach, FL 33009
$-1,348
Cash flow
-19.3%
Cash-on-Cash Return
1.9%
Cap rate
0.8%
Rent to Value Ratio
Active
$218,000
1
bds
|
2
ba
|
850
sqft
|
built
1976
3113 S Ocean Dr, Hallandale Beach, FL 33009
$-234
Cash flow
-5.6%
Cash-on-Cash Return
5.0%
Cap rate
1.1%
Rent to Value Ratio
Active
$499,900
2
bds
|
2
ba
|
1,430
sqft
|
built
1976
800 Parkview Dr, Hallandale Beach, FL 33009
$-2,072
Cash flow
-21.6%
Cash-on-Cash Return
1.3%
Cap rate
0.7%
Rent to Value Ratio
Active
$299,000
2
bds
|
2
ba
|
1,180
sqft
|
built
1970
1801 S Ocean Dr, Hallandale Beach, FL 33009
$-1,292
Cash flow
-22.5%
Cash-on-Cash Return
1.1%
Cap rate
0.8%
Rent to Value Ratio
Active
$210,000
1
bds
|
2
ba
|
1,000
sqft
|
built
1975
600 Three Islands Blvd, Hallandale Beach, FL 33009
$-949
Cash flow
-23.6%
Cash-on-Cash Return
0.9%
Cap rate
1.0%
Rent to Value Ratio
Active
$250,000
2
bds
|
2
ba
|
1,100
sqft
|
built
1967
180 NE 12th Ave, Hallandale Beach, FL 33009
$-756
Cash flow
-15.8%
Cash-on-Cash Return
2.7%
Cap rate
0.9%
Rent to Value Ratio
Active
$175,000
1
bds
|
2
ba
|
850
sqft
|
built
1970
200 Diplomat Pkwy, Hallandale Beach, FL 33009
$-362
Cash flow
-10.8%
Cash-on-Cash Return
3.8%
Cap rate
1.3%
Rent to Value Ratio

Active
$695,000
1
bds
|
1
ba
|
811
sqft
|
built
2006
1830 S Ocean Dr, Hallandale Beach, FL 33009
$-2,801
Cash flow
-21.0%
Cash-on-Cash Return
1.4%
Cap rate
0.6%
Rent to Value Ratio
Active
$320,000
2
bds
|
2
ba
|
1,176
sqft
|
built
1969
1825 S Ocean Dr, Hallandale Beach, FL 33009
$-1,388
Cash flow
-22.6%
Cash-on-Cash Return
1.1%
Cap rate
0.8%
Rent to Value Ratio
Active
$730,000
1
bds
|
1
ba
|
844
sqft
|
built
2006
1830 S Ocean Dr, Hallandale Beach, FL 33009
$-2,025
Cash flow
-14.5%
Cash-on-Cash Return
3.0%
Cap rate
0.7%
Rent to Value Ratio
Active
$220,000
2
bds
|
2
ba
|
1,092
sqft
|
built
1968
219 NE 14th Ave, Hallandale Beach, FL 33009
$-423
Cash flow
-10.0%
Cash-on-Cash Return
4.0%
Cap rate
1.0%
Rent to Value Ratio
Active
$139,000
1
bds
|
1
ba
|
660
sqft
|
built
1967
180 NE 12th Ave, Hallandale Beach, FL 33009
$-559
Cash flow
-21.0%
Cash-on-Cash Return
1.5%
Cap rate
1.2%
Rent to Value Ratio
Active
$375,000
1
bds
|
2
ba
|
920
sqft
|
built
2007
1755 E Hallandale Beach Blvd, Hallandale Beach, FL 33009
$-1,594
Cash flow
-22.2%
Cash-on-Cash Return
1.2%
Cap rate
0.7%
Rent to Value Ratio
Active
$1,050,000
3
bds
|
3
ba
|
1,571
sqft
|
built
2006
1800 S Ocean Dr, Hallandale Beach, FL 33009
$-4,575
Cash flow
-22.7%
Cash-on-Cash Return
1.1%
Cap rate
0.6%
Rent to Value Ratio
Active
$199,950
2
bds
|
1
ba
|
686
sqft
|
built
1970
110 SE 2nd St, Hallandale Beach, FL 33009
$-216
Cash flow
-5.6%
Cash-on-Cash Return
5.0%
Cap rate
0.9%
Rent to Value Ratio
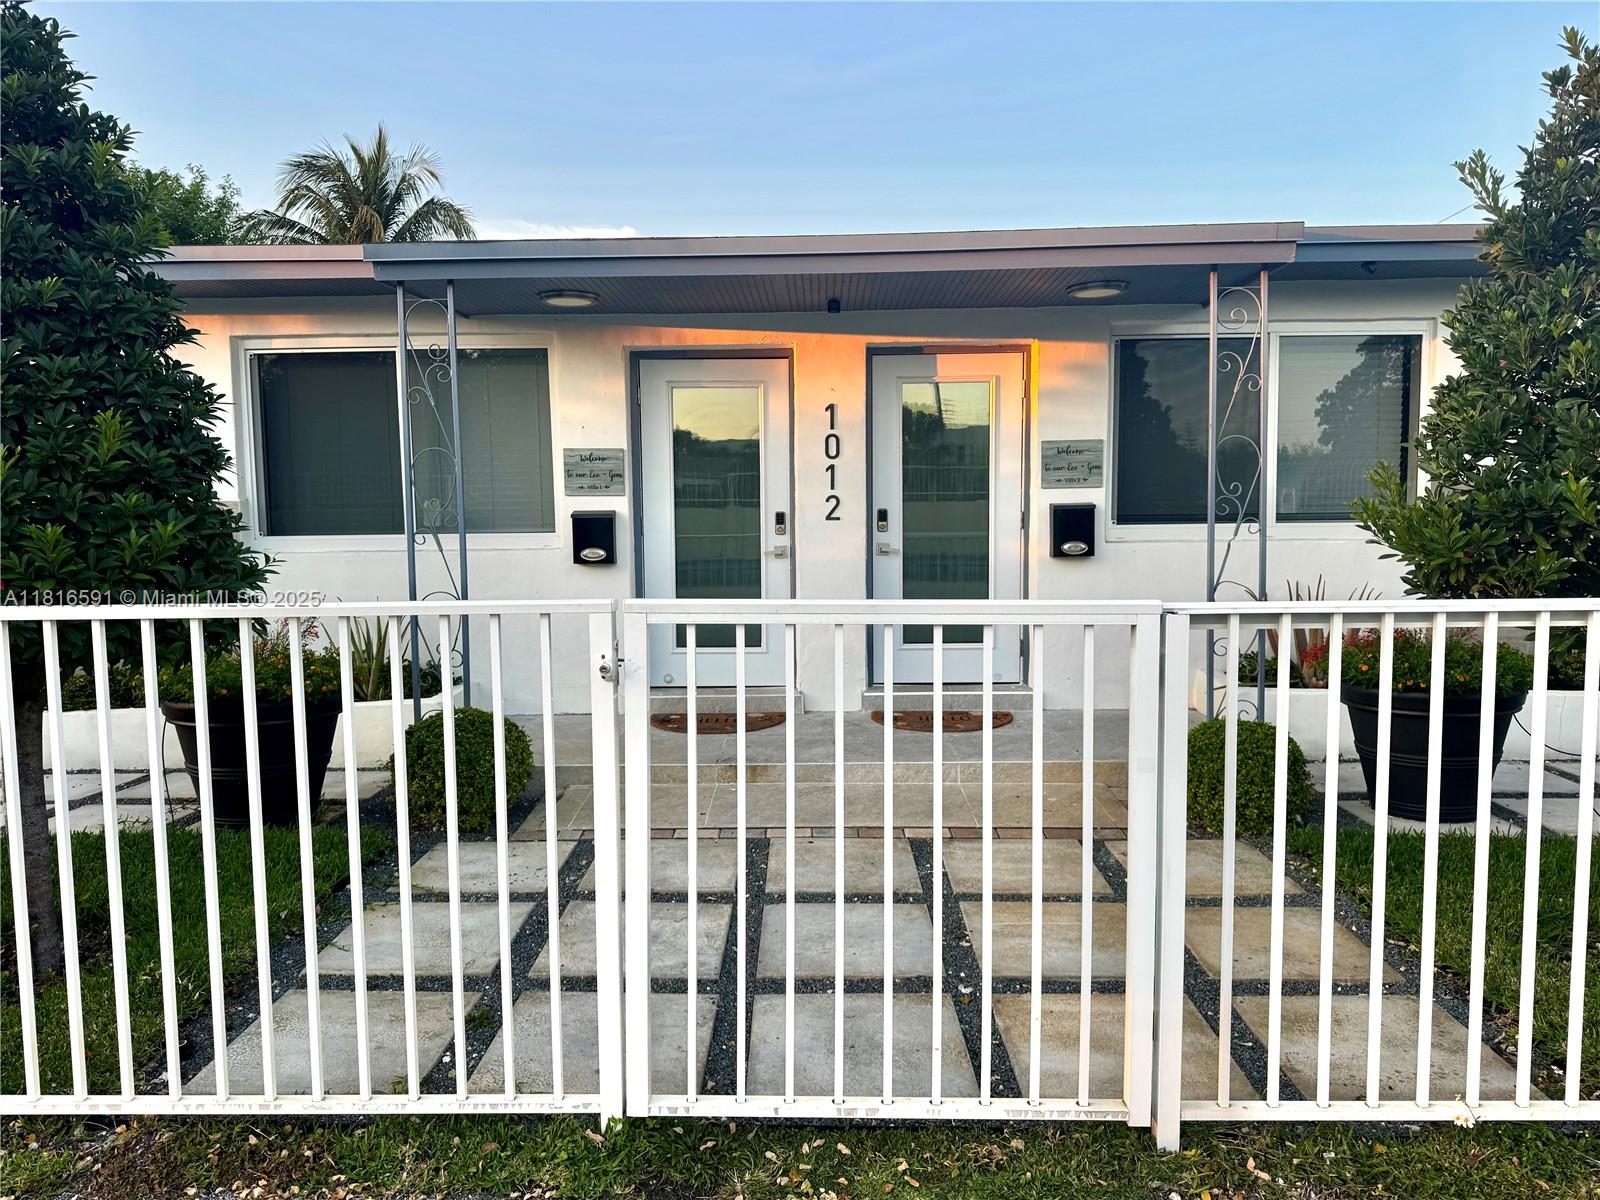
Active
$780,000
bds
|
0
ba
|
1,624
sqft
|
built
1960
1012 SW 11th St, Hallandale Beach, FL 33009
$-3,795
Cash flow
-25.4%
Cash-on-Cash Return
0.4%
Cap rate
0.2%
Rent to Value Ratio
Active
$349,000
2
bds
|
2
ba
|
1,130
sqft
|
built
1976
1000 Parkview Dr, Hallandale Beach, FL 33009
$-1,351
Cash flow
-20.2%
Cash-on-Cash Return
1.6%
Cap rate
0.8%
Rent to Value Ratio

Active
$485,000
2
bds
|
2
ba
|
1,080
sqft
|
built
1967
120 Golden Isles Dr, Hallandale Beach, FL 33009
$-2,104
Cash flow
-22.6%
Cash-on-Cash Return
1.1%
Cap rate
0.5%
Rent to Value Ratio
Active
$240,000
1
bds
|
2
ba
|
1,217
sqft
|
built
1974
1865 S Ocean Dr, Hallandale Beach, FL 33009
$-1,487
Cash flow
-32.3%
Cash-on-Cash Return
-1.2%
Cap rate
0.8%
Rent to Value Ratio
Active
$650,000
3
bds
|
2
ba
|
1,304
sqft
|
built
1955
918 NE 6th St, Hallandale Beach, FL 33009
$-1,241
Cash flow
-10.0%
Cash-on-Cash Return
4.0%
Cap rate
0.6%
Rent to Value Ratio
Active
$375,000
2
bds
|
2
ba
|
1,030
sqft
|
built
1963
400 Golden Isles Dr, Hallandale Beach, FL 33009
$-1,412
Cash flow
-19.6%
Cash-on-Cash Return
1.8%
Cap rate
0.7%
Rent to Value Ratio