Holladay, UT Investment Properties for Sale
Browse homes for sale and investment properties in Holladay, UT. Refine your search by price, property type, or more.
Best cash flowing properties in Holladay, UT
Active
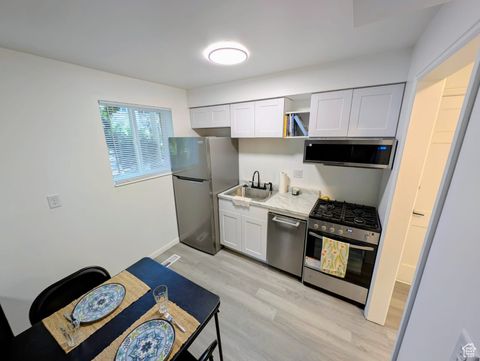
$195,900
1
bds
|
1
ba
|
436
sqft
|
built
1964
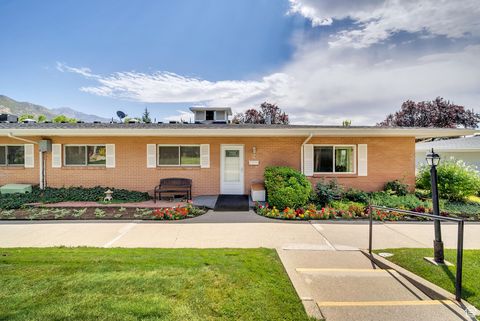
2220 E Murray Holladay Rd, Holladay, UT 84117
$-371
Cash flow
-9.9%
Cash-on-Cash Return
3.4%
Cap rate
0.6%
Rent to Value Ratio
Active
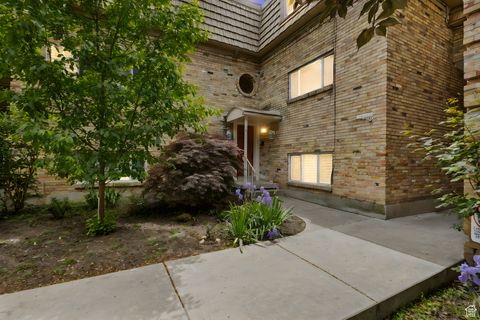
$269,000
1
bds
|
1
ba
|
682
sqft
|
built
1964
2220 E Murray Holladay Rd, Holladay, UT 84117
$-495
Cash flow
-9.6%
Cash-on-Cash Return
3.5%
Cap rate
0.6%
Rent to Value Ratio
47 out of 58 properties for sale in Holladay, UT
Limited Results Shown
Create a free account, or log in to reveal all property listings and enjoy the complete experience.
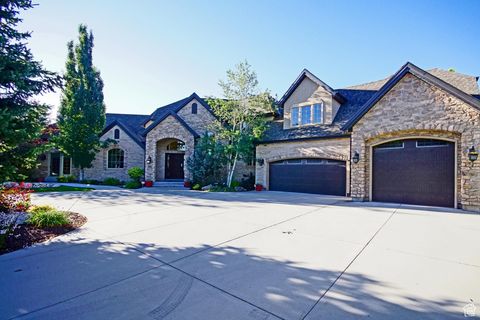
Active
$849,000
3
bds
|
3
ba
|
2,236
sqft
|
built
1964
4856 S Colony Dr, Holladay, UT 84117
$-2,328
Cash flow
-14.3%
Cash-on-Cash Return
2.4%
Cap rate
0.3%
Rent to Value Ratio
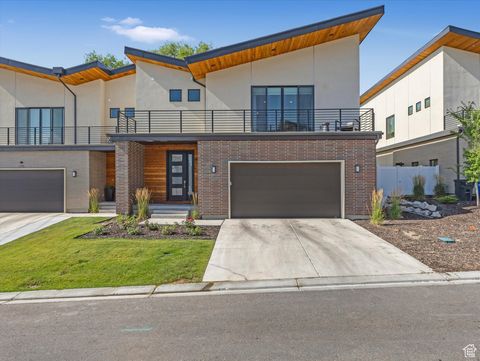
Active
$1,300,000
5
bds
|
4
ba
|
4,362
sqft
|
built
1981
4972 S Boabab Cir, Holladay, UT 84117
$-2,285
Cash flow
-9.2%
Cash-on-Cash Return
3.6%
Cap rate
0.5%
Rent to Value Ratio
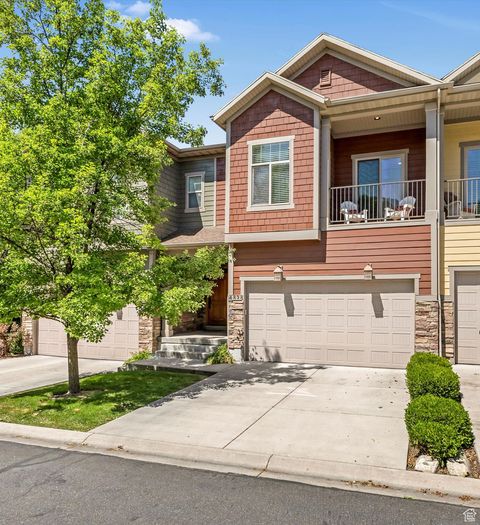
Active
$850,000
4
bds
|
2
ba
|
2,320
sqft
|
built
1959
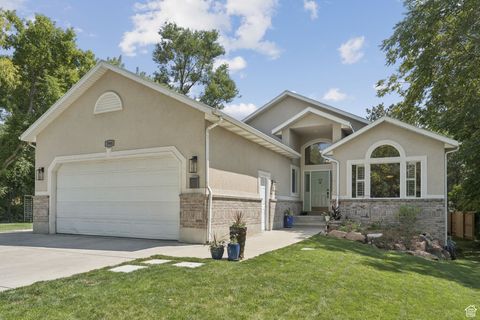
4275 S Monarch Way, Holladay, UT 84124
$-2,762
Cash flow
-17.0%
Cash-on-Cash Return
1.8%
Cap rate
0.3%
Rent to Value Ratio
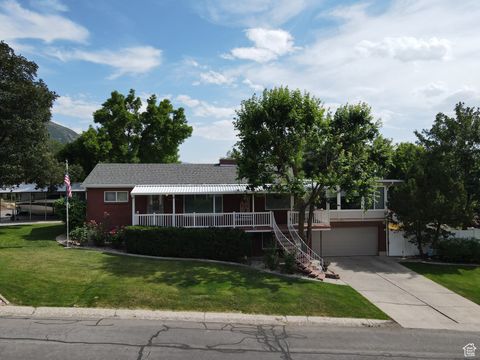
Active
$4,695,000
6
bds
|
6
ba
|
8,218
sqft
|
built
2023
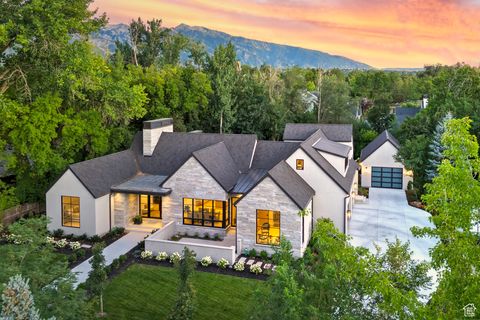
2138 E Pheasant Ln, Holladay, UT 84121
$-20,913
Cash flow
-23.2%
Cash-on-Cash Return
0.3%
Cap rate
0.1%
Rent to Value Ratio
Active
$2,100,000
6
bds
|
4
ba
|
5,562
sqft
|
built
1987
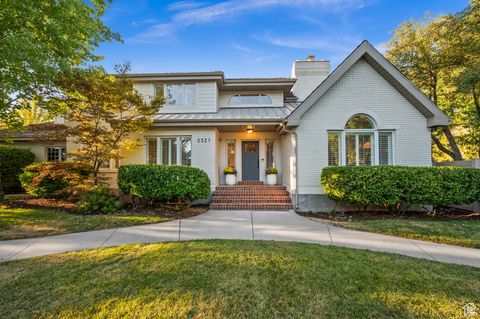
2321 E Wrenhaven Ln, Holladay, UT 84121
$-6,167
Cash flow
-15.3%
Cash-on-Cash Return
2.2%
Cap rate
0.3%
Rent to Value Ratio
Active
$389,900
3
bds
|
2
ba
|
1,347
sqft
|
built
1964
2203 E Carriage Ln, Holladay, UT 84117
$-997
Cash flow
-13.3%
Cash-on-Cash Return
2.6%
Cap rate
0.5%
Rent to Value Ratio
Active
$1,100,000
5
bds
|
4
ba
|
3,406
sqft
|
built
2011
1958 E Cecelia Cir, Holladay, UT 84121
$-3,503
Cash flow
-16.6%
Cash-on-Cash Return
1.9%
Cap rate
0.3%
Rent to Value Ratio
Active
$7,495,000
8
bds
|
10
ba
|
9,275
sqft
|
built
2023
2222 E Walker Ln, Holladay, UT 84117
$-32,871
Cash flow
-22.9%
Cash-on-Cash Return
0.4%
Cap rate
0.1%
Rent to Value Ratio
Active
$719,000
4
bds
|
3
ba
|
2,078
sqft
|
built
1996
5037 S Cotton Tree Ln, Holladay, UT 84117
$-2,027
Cash flow
-14.7%
Cash-on-Cash Return
2.3%
Cap rate
0.4%
Rent to Value Ratio
Active
$2,195,000
6
bds
|
4
ba
|
4,545
sqft
|
built
1952
1958 E Longview Dr, Holladay, UT 84124
$-8,206
Cash flow
-19.5%
Cash-on-Cash Return
1.2%
Cap rate
0.2%
Rent to Value Ratio
Active
$714,900
3
bds
|
3
ba
|
2,728
sqft
|
built
2006
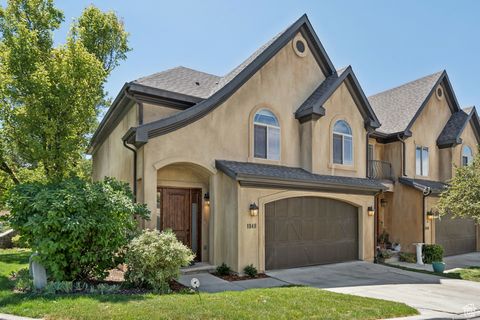
1848 E Rouen Cir, Holladay, UT 84117
$-2,317
Cash flow
-16.9%
Cash-on-Cash Return
1.8%
Cap rate
0.3%
Rent to Value Ratio
Active
$1,299,000
5
bds
|
4
ba
|
4,791
sqft
|
built
1999
1968 E Sycamore Ln, Holladay, UT 84117
$-3,026
Cash flow
-12.2%
Cash-on-Cash Return
2.9%
Cap rate
0.4%
Rent to Value Ratio
Active
$849,900
2
bds
|
2
ba
|
1,474
sqft
|
built
2020
2240 E Laney Ave, Holladay, UT 84117
$-2,267
Cash flow
-13.9%
Cash-on-Cash Return
2.5%
Cap rate
0.4%
Rent to Value Ratio
Active
$850,000
4
bds
|
3
ba
|
2,659
sqft
|
built
2012
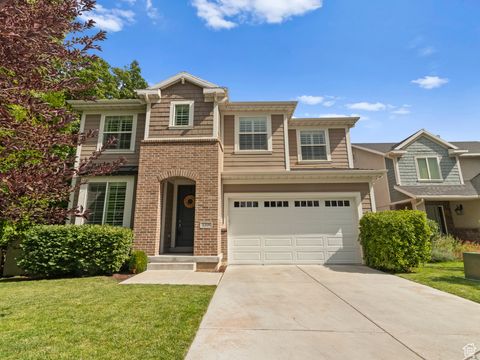
1319 E Foxmont Ln, Holladay, UT 84117
$-2,442
Cash flow
-15.0%
Cash-on-Cash Return
2.2%
Cap rate
0.3%
Rent to Value Ratio
Active
$980,000
5
bds
|
3
ba
|
2,430
sqft
|
built
1963
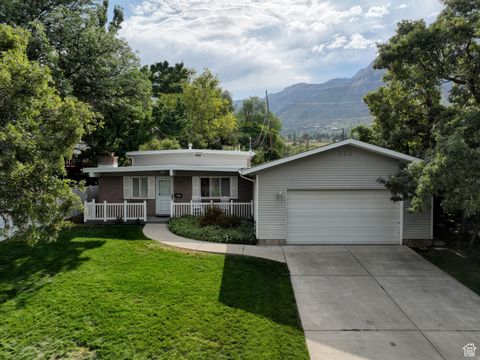
1578 E Delaware Ln, Holladay, UT 84117
$-3,596
Cash flow
-19.1%
Cash-on-Cash Return
1.3%
Cap rate
0.2%
Rent to Value Ratio
Active
$880,000
5
bds
|
3
ba
|
3,086
sqft
|
built
1962
3982 S Saturn Ave, Holladay, UT 84124
$-2,514
Cash flow
-14.9%
Cash-on-Cash Return
2.3%
Cap rate
0.3%
Rent to Value Ratio
Active
$1,099,000
4
bds
|
3
ba
|
3,480
sqft
|
built
1965
4855 S Bron Breck St, Holladay, UT 84117
$-1,629
Cash flow
-7.7%
Cash-on-Cash Return
3.9%
Cap rate
0.5%
Rent to Value Ratio
Active
$735,000
4
bds
|
3
ba
|
2,288
sqft
|
built
1959
4702 S 3075 E, Holladay, UT 84117
$-2,492
Cash flow
-17.7%
Cash-on-Cash Return
1.6%
Cap rate
0.2%
Rent to Value Ratio

Active
$725,000
5
bds
|
3
ba
|
2,430
sqft
|
built
1963
5726 S Highland Dr, Holladay, UT 84121
$-1,567
Cash flow
-11.3%
Cash-on-Cash Return
3.1%
Cap rate
0.4%
Rent to Value Ratio
Active
$1,850,000
5
bds
|
5
ba
|
7,904
sqft
|
built
2008
2054 E 6425 S, Holladay, UT 84121
$-6,927
Cash flow
-19.5%
Cash-on-Cash Return
1.2%
Cap rate
0.2%
Rent to Value Ratio
Active
$1,175,000
6
bds
|
4
ba
|
3,874
sqft
|
built
2024
1783 E Bermondsey Ct, Holladay, UT 84117
$-4,320
Cash flow
-19.2%
Cash-on-Cash Return
1.3%
Cap rate
0.2%
Rent to Value Ratio
Active
$759,000
3
bds
|
4
ba
|
2,969
sqft
|
built
2005
4828 S Brooks Way, Holladay, UT 84117
$-2,441
Cash flow
-16.8%
Cash-on-Cash Return
1.8%
Cap rate
0.3%
Rent to Value Ratio
Active
$835,000
4
bds
|
3
ba
|
3,104
sqft
|
built
1958
2936 E La Joya Dr, Holladay, UT 84124
$-2,141
Cash flow
-13.4%
Cash-on-Cash Return
2.6%
Cap rate
0.4%
Rent to Value Ratio
Active
$6,999,999
7
bds
|
10
ba
|
11,720
sqft
|
built
1989
6033 S 2300 E, Holladay, UT 84121
$-33,793
Cash flow
-25.2%
Cash-on-Cash Return
-0.1%
Cap rate
0.0%
Rent to Value Ratio
Active
$1,465,000
4
bds
|
4
ba
|
4,268
sqft
|
built
1960
2241 E Melodie Ann Way, Holladay, UT 84124
$-4,068
Cash flow
-14.5%
Cash-on-Cash Return
2.3%
Cap rate
0.3%
Rent to Value Ratio
Active
$499,900
4
bds
|
2
ba
|
1,527
sqft
|
built
1972
4797 S 2124 E, Holladay, UT 84117
$-1,812
Cash flow
-18.9%
Cash-on-Cash Return
1.3%
Cap rate
0.3%
Rent to Value Ratio
Active
$1,750,000
7
bds
|
6
ba
|
5,421
sqft
|
built
1979
5072 S Boabab Dr, Holladay, UT 84117
$-5,790
Cash flow
-17.3%
Cash-on-Cash Return
1.7%
Cap rate
0.3%
Rent to Value Ratio
Active
$3,150,000
5
bds
|
5
ba
|
5,639
sqft
|
built
1977
5757 S Holladay Blvd, Holladay, UT 84121
$-10,567
Cash flow
-17.5%
Cash-on-Cash Return
1.7%
Cap rate
0.2%
Rent to Value Ratio
Active
$799,900
4
bds
|
4
ba
|
3,243
sqft
|
built
2015
5608 S Dunetree Hill Ln, Holladay, UT 84121
$-2,553
Cash flow
-16.7%
Cash-on-Cash Return
1.8%
Cap rate
0.4%
Rent to Value Ratio
Active
$700,000
3
bds
|
2
ba
|
2,264
sqft
|
built
1942
4555 S Highland Dr, Holladay, UT 84117
$-2,370
Cash flow
-17.7%
Cash-on-Cash Return
1.6%
Cap rate
0.3%
Rent to Value Ratio
Active
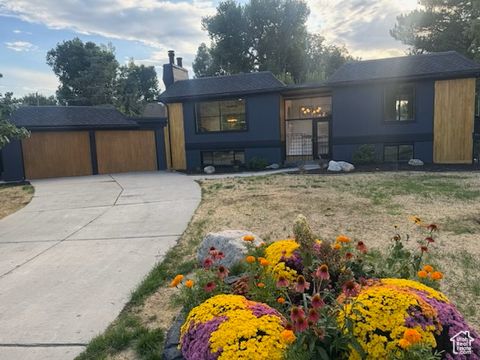
$289,000
2
bds
|
2
ba
|
1,136
sqft
|
built
1964
2220 E Murray Holladay Rd, Holladay, UT 84117
$-677
Cash flow
-12.2%
Cash-on-Cash Return
2.9%
Cap rate
0.6%
Rent to Value Ratio
Active
$7,495,000
6
bds
|
8
ba
|
11,051
sqft
|
built
2002
2062 E Walker Ln, Holladay, UT 84117
$-33,861
Cash flow
-23.6%
Cash-on-Cash Return
0.3%
Cap rate
0.1%
Rent to Value Ratio
Active
$4,495,000
5
bds
|
7
ba
|
10,400
sqft
|
built
2009
6176 S Verness Cv, Holladay, UT 84121
$-19,698
Cash flow
-22.9%
Cash-on-Cash Return
0.4%
Cap rate
0.1%
Rent to Value Ratio
Active
$1,450,000
5
bds
|
4
ba
|
3,344
sqft
|
built
1965
4579 S Wallace Ln, Holladay, UT 84117
$-5,268
Cash flow
-19.0%
Cash-on-Cash Return
1.3%
Cap rate
0.2%
Rent to Value Ratio

Active
$1,399,000
3
bds
|
4
ba
|
4,309
sqft
|
built
1955
3200 E 3900 S, Holladay, UT 84124
$-4,550
Cash flow
-17.0%
Cash-on-Cash Return
1.8%
Cap rate
0.3%
Rent to Value Ratio
Active
$725,000
3
bds
|
4
ba
|
2,728
sqft
|
built
2006
1842 E Rouen Cir, Holladay, UT 84117
$-2,162
Cash flow
-15.6%
Cash-on-Cash Return
2.1%
Cap rate
0.4%
Rent to Value Ratio
Active
$985,000
5
bds
|
5
ba
|
3,305
sqft
|
built
1957
4305 S Albright Dr, Holladay, UT 84124
$-2,296
Cash flow
-12.2%
Cash-on-Cash Return
2.9%
Cap rate
0.4%
Rent to Value Ratio
Active
$3,500,000
5
bds
|
5
ba
|
8,998
sqft
|
built
2004
2620 E Casto Ln, Holladay, UT 84117
$-13,575
Cash flow
-20.2%
Cash-on-Cash Return
1.0%
Cap rate
0.2%
Rent to Value Ratio