Nephi, UT Investment Properties for Sale
Browse homes for sale and investment properties in Nephi, UT. Refine your search by price, property type, or more.
Best cash flowing properties in Nephi, UT
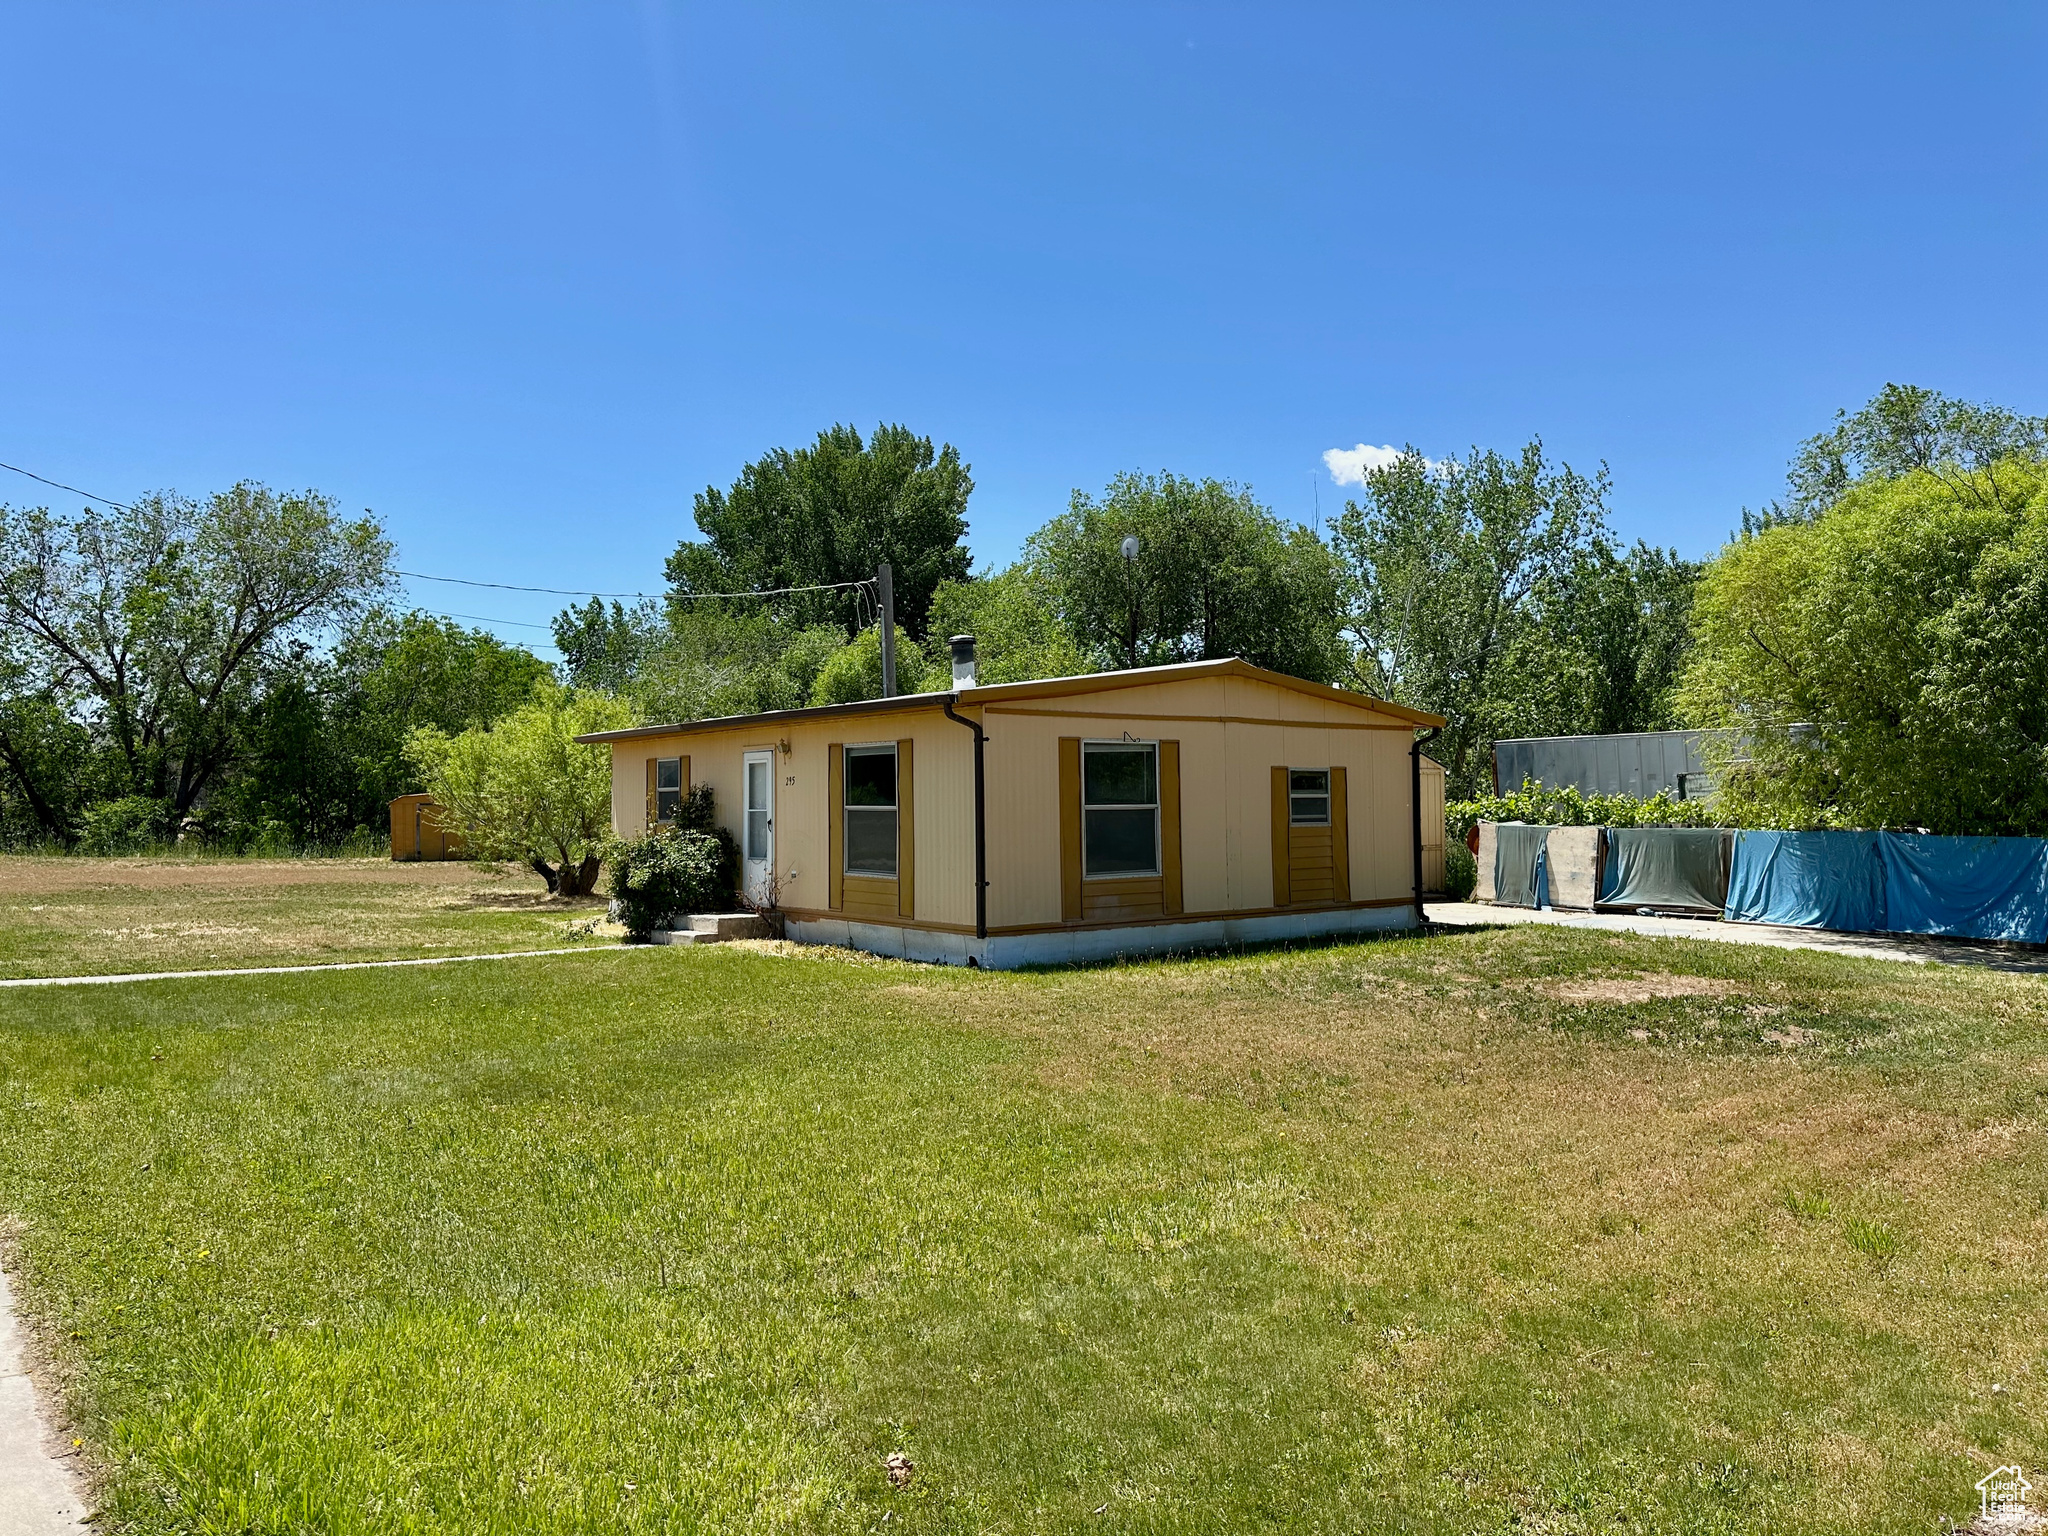
Active
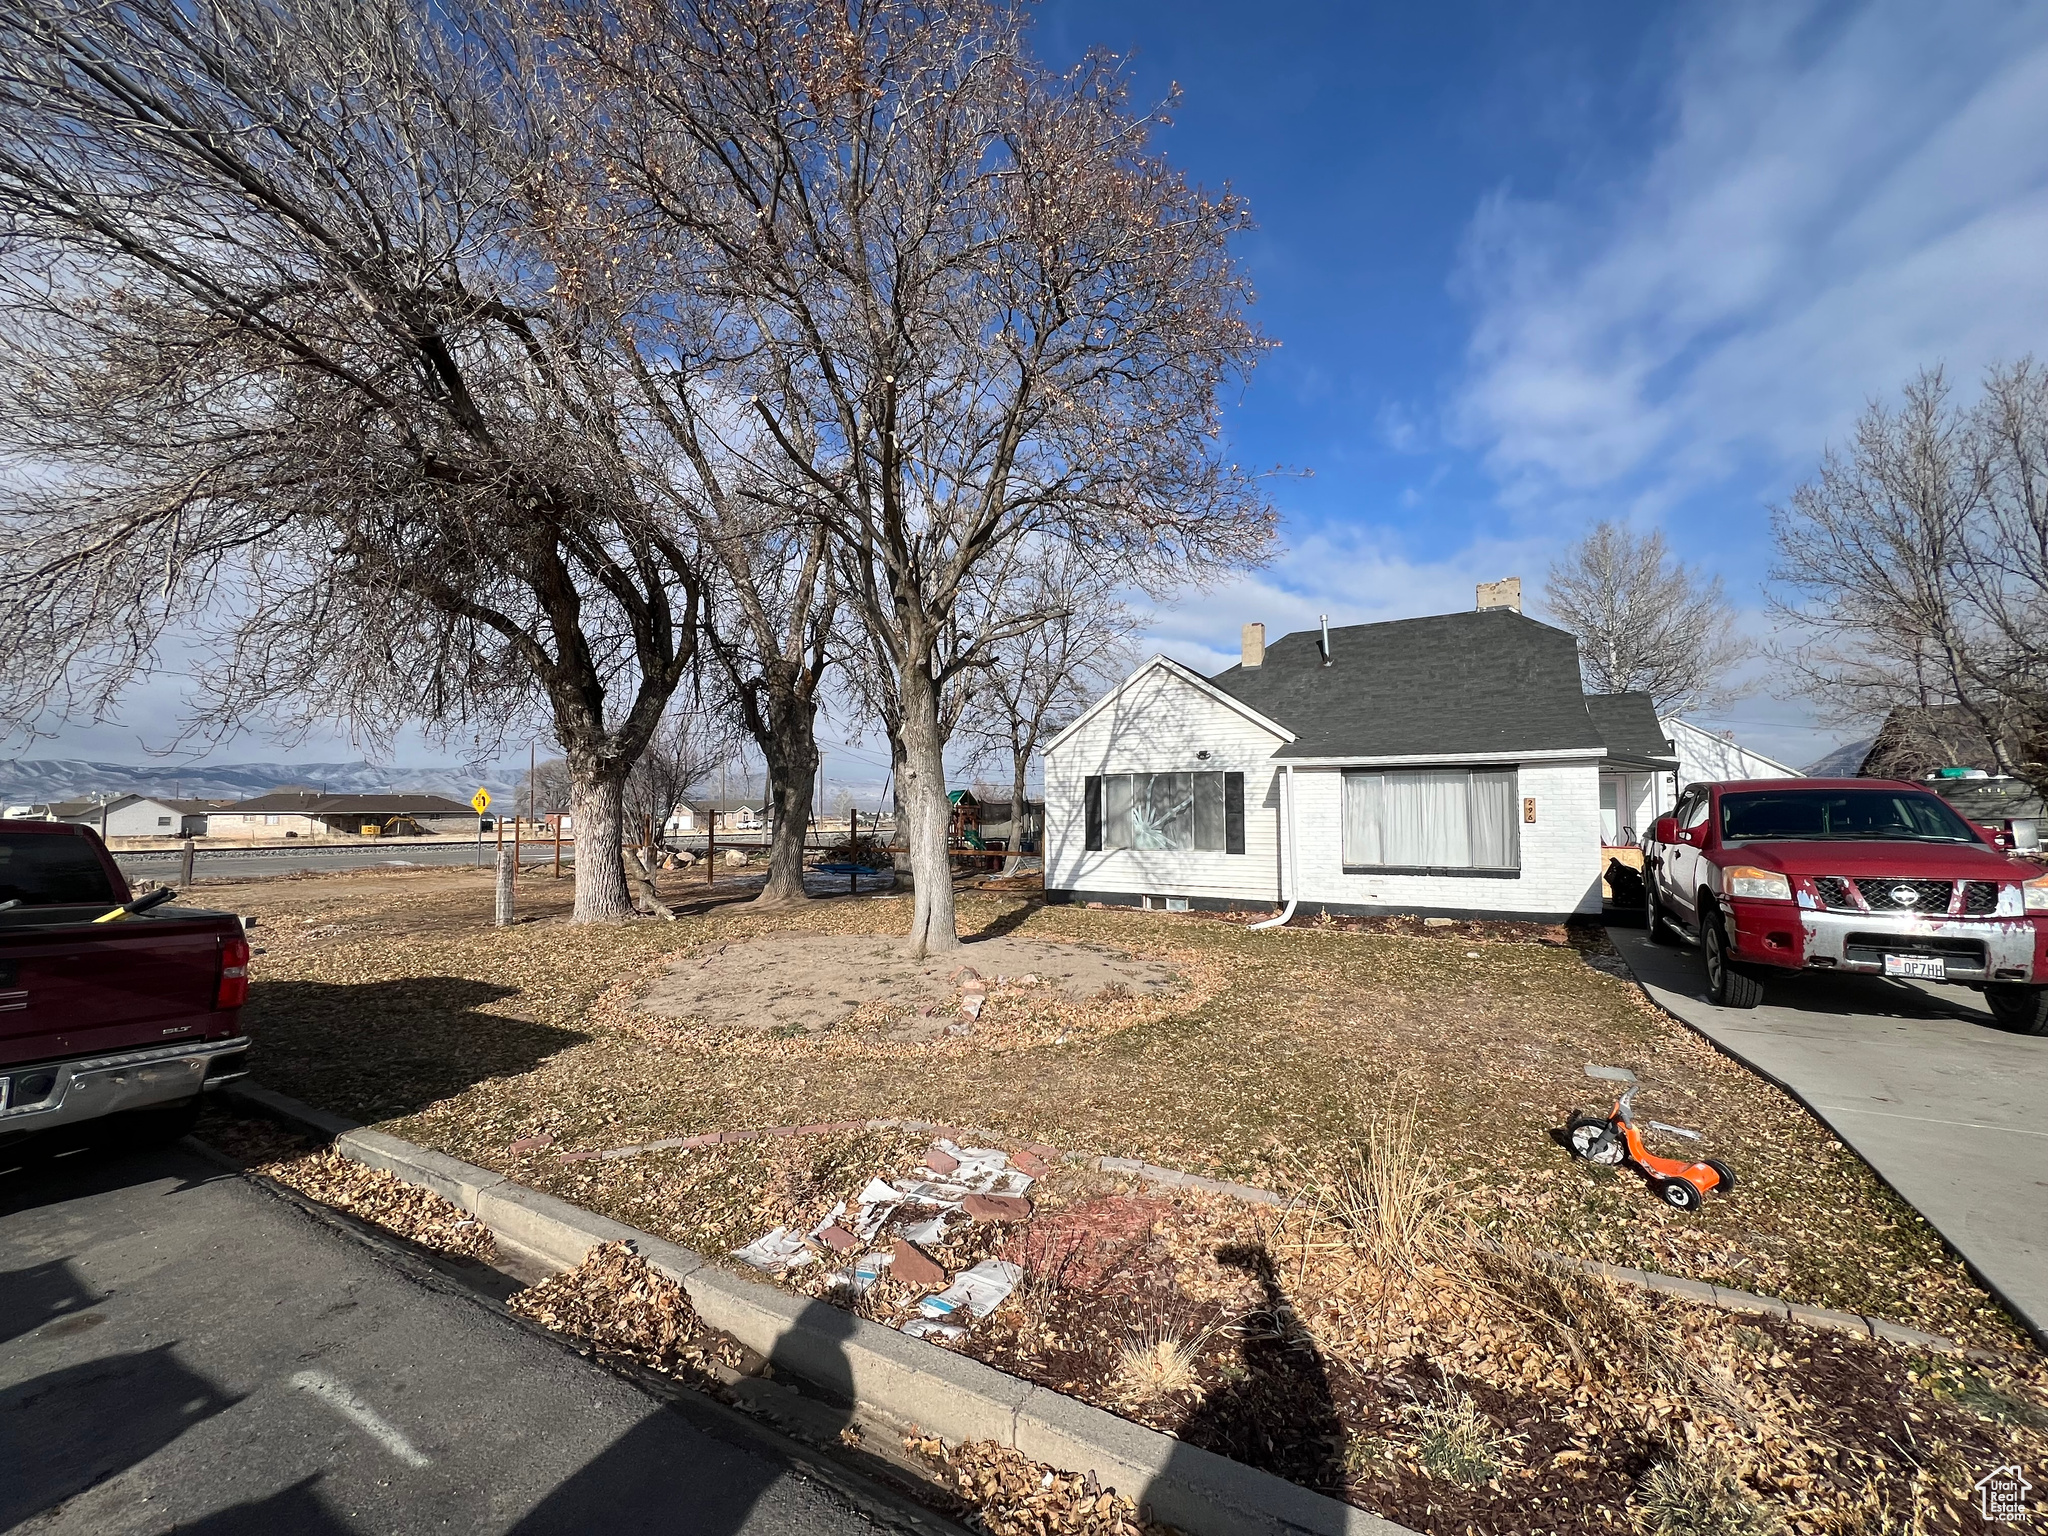
$184,900
2
bds
|
1
ba
|
768
sqft
|
built
1972
295 E 400 S, Nephi, UT 84648
$169
Cash flow
4.8%
Cash-on-Cash Return
7.4%
Cap rate
1.0%
Rent to Value Ratio
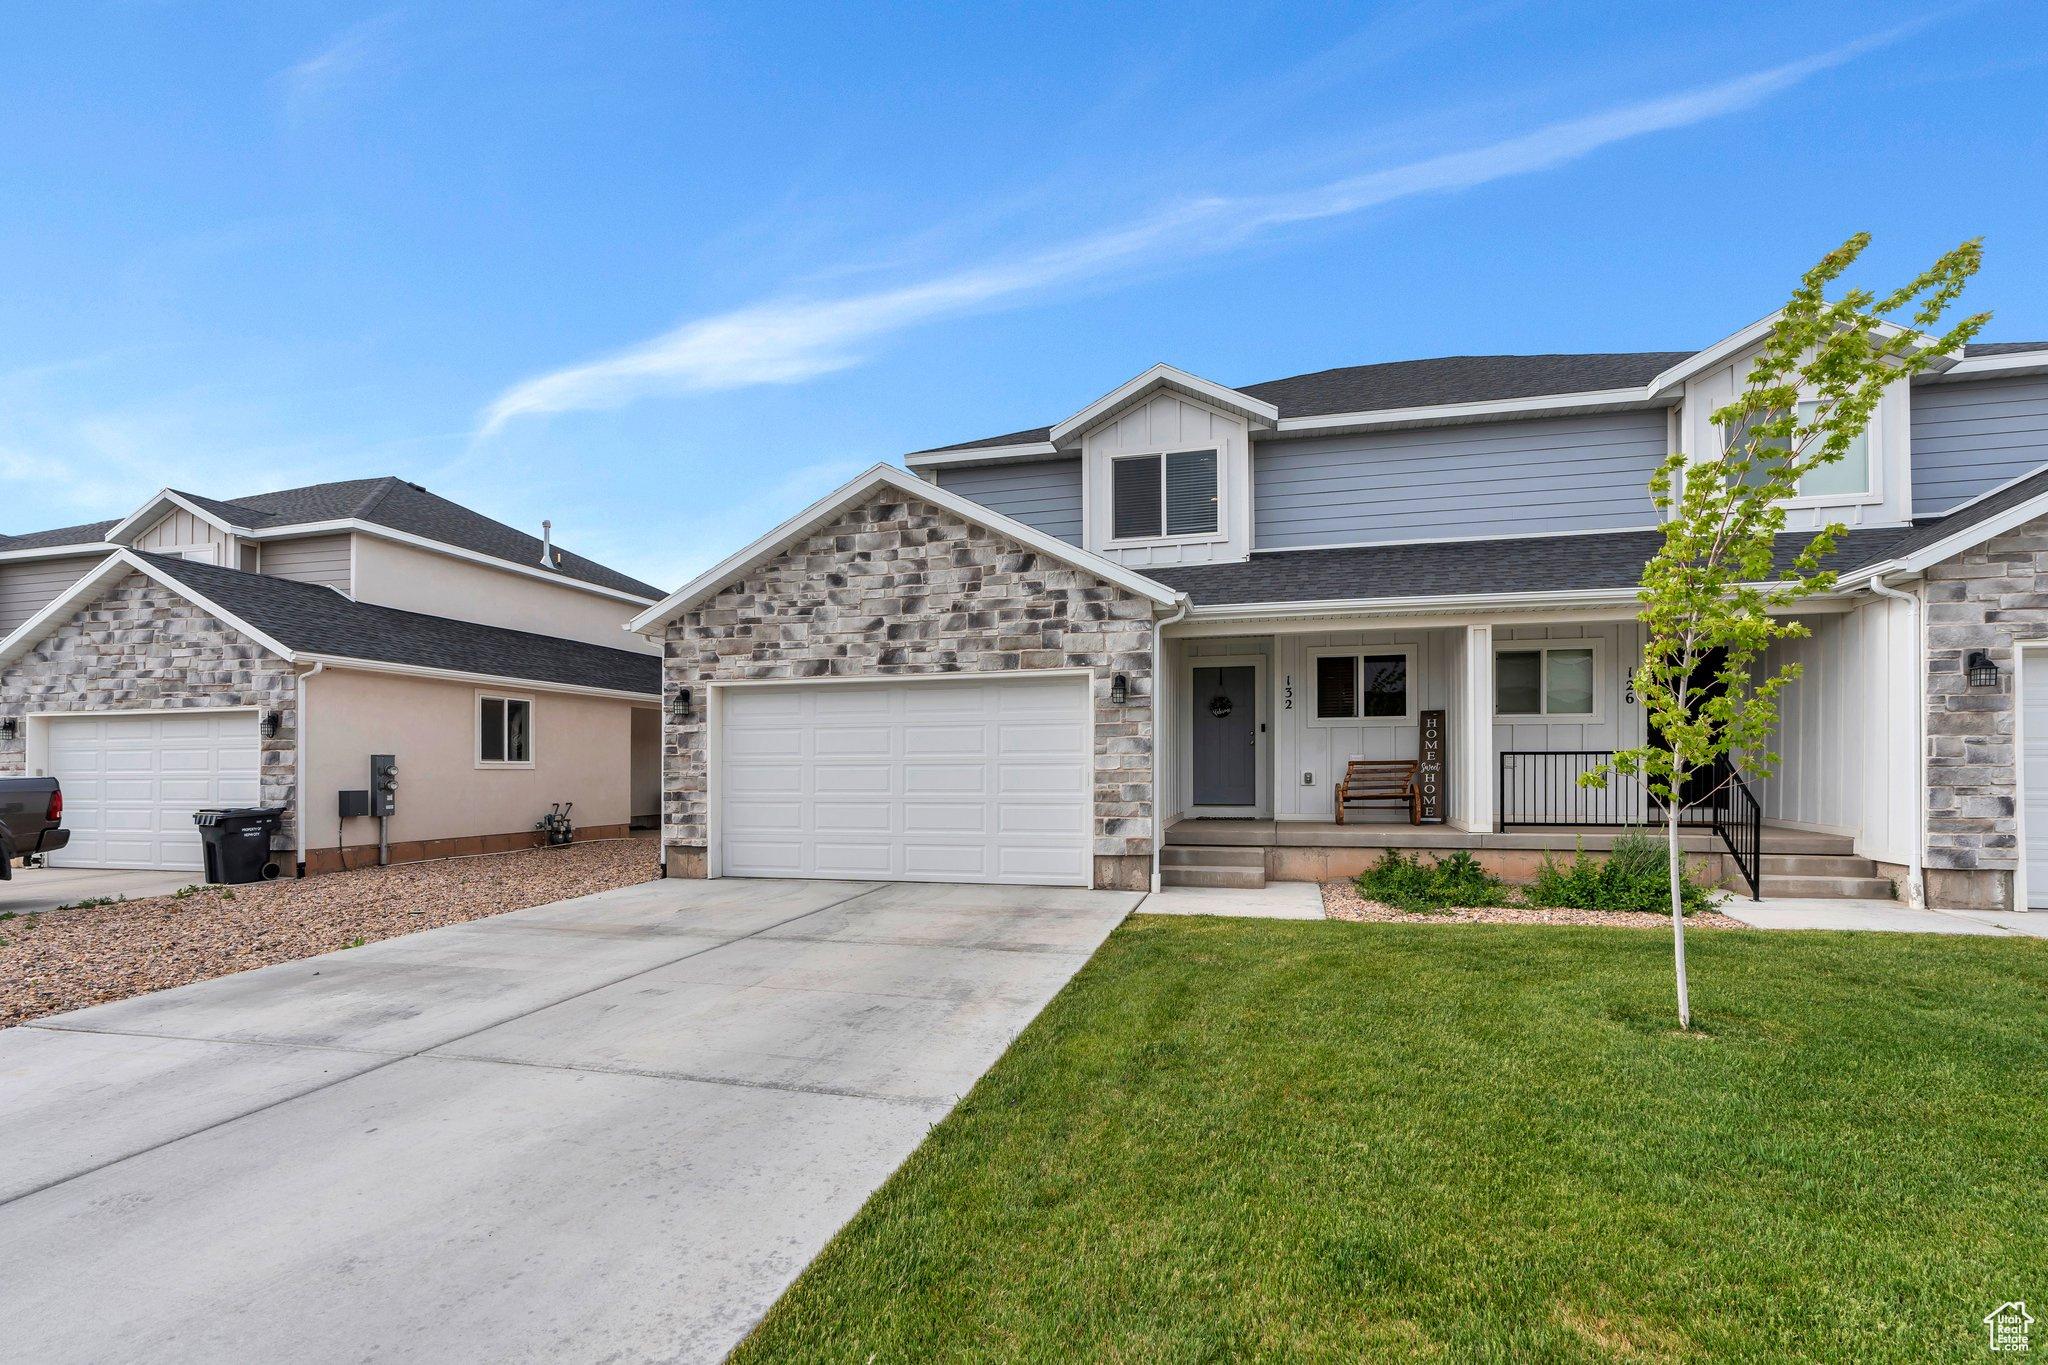
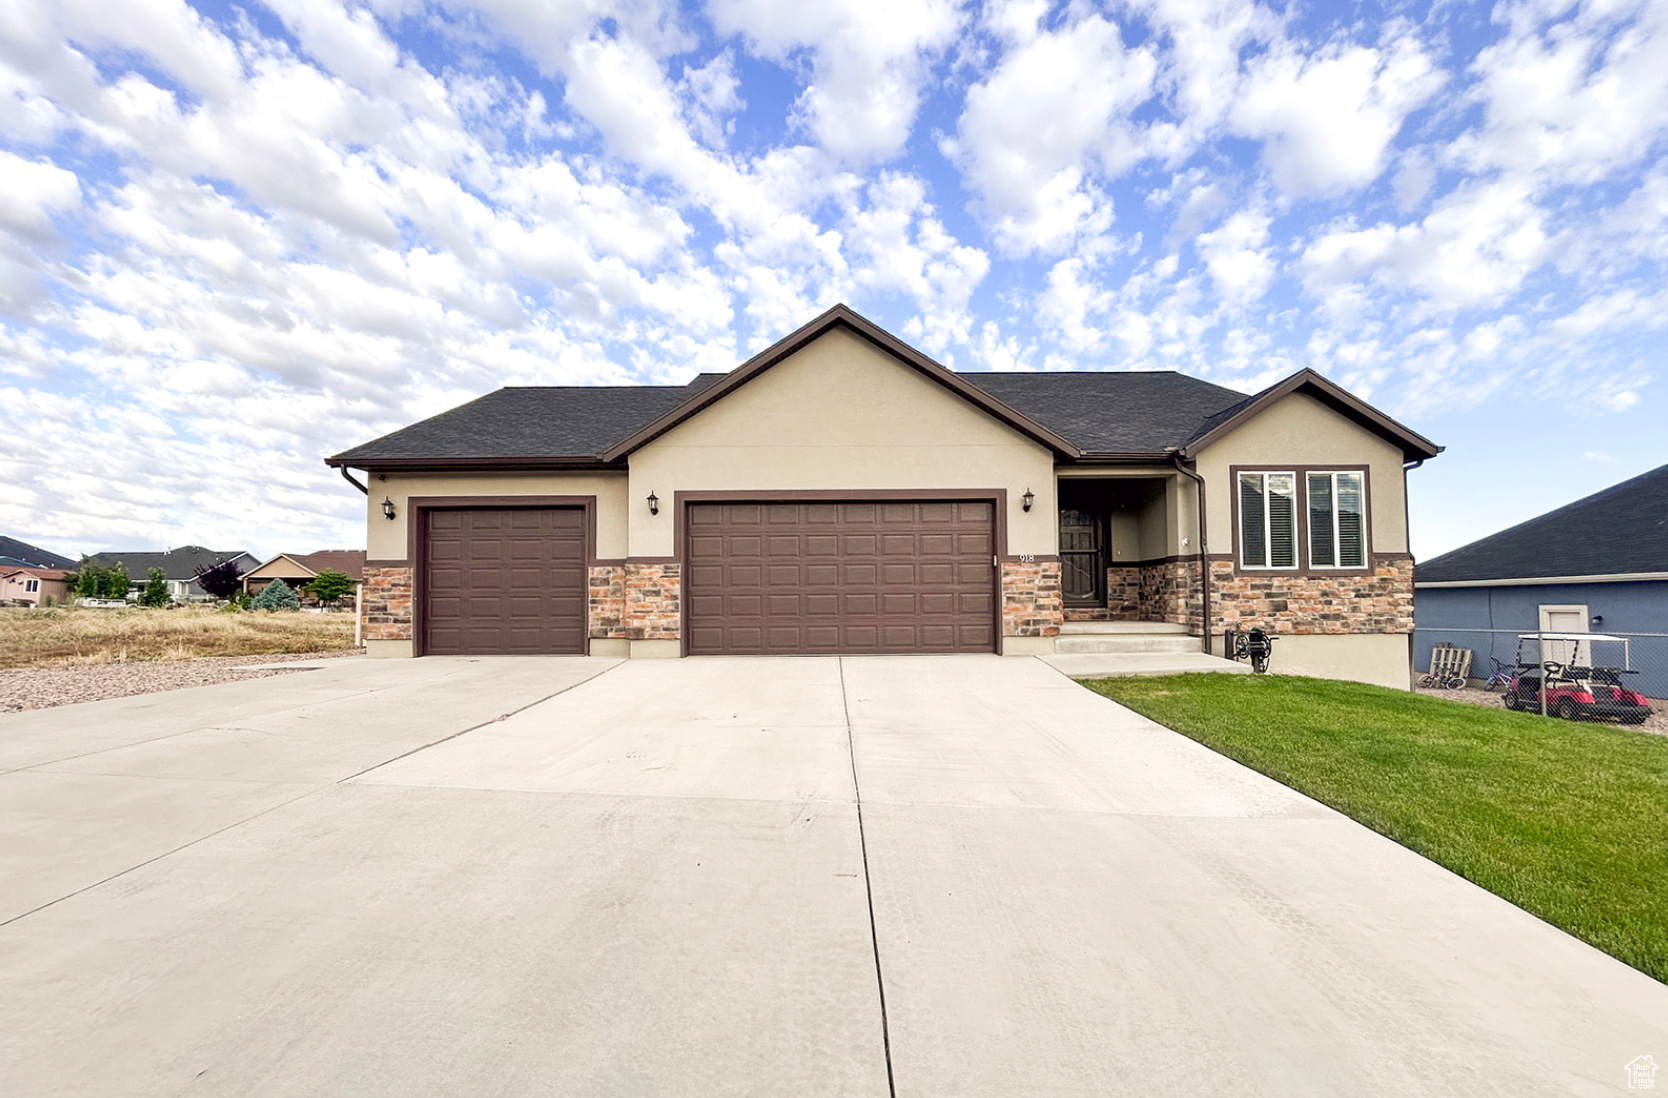
Active
$390,000
3
bds
|
3
ba
|
2,529
sqft
|
built
2022
132 W 900 N, Nephi, UT 84648
$-559
Cash flow
-7.5%
Cash-on-Cash Return
4.6%
Cap rate
0.6%
Rent to Value Ratio
32 out of 44 properties for sale in Nephi, UT
Limited Results Shown
Create a free account, or log in to reveal all property listings and enjoy the complete experience.
Active
$499,000
6
bds
|
4
ba
|
3,164
sqft
|
built
1884
213 E 500 N, Nephi, UT 84648
$-1,639
Cash flow
-17.1%
Cash-on-Cash Return
2.3%
Cap rate
0.3%
Rent to Value Ratio
Active
$349,000
2
bds
|
1
ba
|
980
sqft
|
built
1942
496 N 500 E, Nephi, UT 84648
$-1,174
Cash flow
-17.6%
Cash-on-Cash Return
2.2%
Cap rate
0.3%
Rent to Value Ratio
Pending
$545,000
5
bds
|
3
ba
|
2,677
sqft
|
built
2017
918 S 400 E, Nephi, UT 84648
$-1,517
Cash flow
-14.5%
Cash-on-Cash Return
2.9%
Cap rate
0.4%
Rent to Value Ratio
Pending
$399,999
4
bds
|
2
ba
|
1,544
sqft
|
built
1893
195 E 200 S, Nephi, UT 84648
$-1,119
Cash flow
-14.6%
Cash-on-Cash Return
2.9%
Cap rate
0.4%
Rent to Value Ratio
Pending
$325,000
2
bds
|
1
ba
|
1,480
sqft
|
built
1946
157 E 900 N, Nephi, UT 84648
$-993
Cash flow
-15.9%
Cash-on-Cash Return
2.6%
Cap rate
0.4%
Rent to Value Ratio
Active
$439,900
3
bds
|
2
ba
|
2,046
sqft
|
built
1966
485 N 300 E, Nephi, UT 84648
$-1,495
Cash flow
-17.7%
Cash-on-Cash Return
2.2%
Cap rate
0.3%
Rent to Value Ratio
Active
$325,000
2
bds
|
1
ba
|
971
sqft
|
built
1888
188 E 100 N, Nephi, UT 84648
$-926
Cash flow
-14.9%
Cash-on-Cash Return
2.9%
Cap rate
0.4%
Rent to Value Ratio
Active
$798,000
10
bds
|
4
ba
|
4,774
sqft
|
built
2022
971 N 100 W, Nephi, UT 84648
$-3,380
Cash flow
-22.1%
Cash-on-Cash Return
1.2%
Cap rate
0.2%
Rent to Value Ratio
Active
$898,000
2
bds
|
2
ba
|
2,400
sqft
|
built
2015
1079 S 400 E, Nephi, UT 84648
$-3,460
Cash flow
-20.1%
Cash-on-Cash Return
1.7%
Cap rate
0.2%
Rent to Value Ratio

Active
$545,000
6
bds
|
3
ba
|
3,306
sqft
|
built
2016
1303 N 150 E, Nephi, UT 84648
$-1,564
Cash flow
-15.0%
Cash-on-Cash Return
2.8%
Cap rate
0.4%
Rent to Value Ratio

Active
$399,000
5
bds
|
4
ba
|
2,387
sqft
|
built
2022
917 N 100 W, Nephi, UT 84648
$-961
Cash flow
-12.6%
Cash-on-Cash Return
3.4%
Cap rate
0.5%
Rent to Value Ratio
Active
$545,000
3
bds
|
2
ba
|
3,215
sqft
|
built
2022
1228 N 100 E, Nephi, UT 84648
$-1,191
Cash flow
-11.4%
Cash-on-Cash Return
3.7%
Cap rate
0.5%
Rent to Value Ratio
Active
$184,900
2
bds
|
1
ba
|
768
sqft
|
built
1972
295 E 400 S, Nephi, UT 84648
$169
Cash flow
4.8%
Cash-on-Cash Return
7.4%
Cap rate
1.0%
Rent to Value Ratio
Active
$390,000
3
bds
|
3
ba
|
2,529
sqft
|
built
2022
132 W 900 N, Nephi, UT 84648
$-559
Cash flow
-7.5%
Cash-on-Cash Return
4.6%
Cap rate
0.6%
Rent to Value Ratio
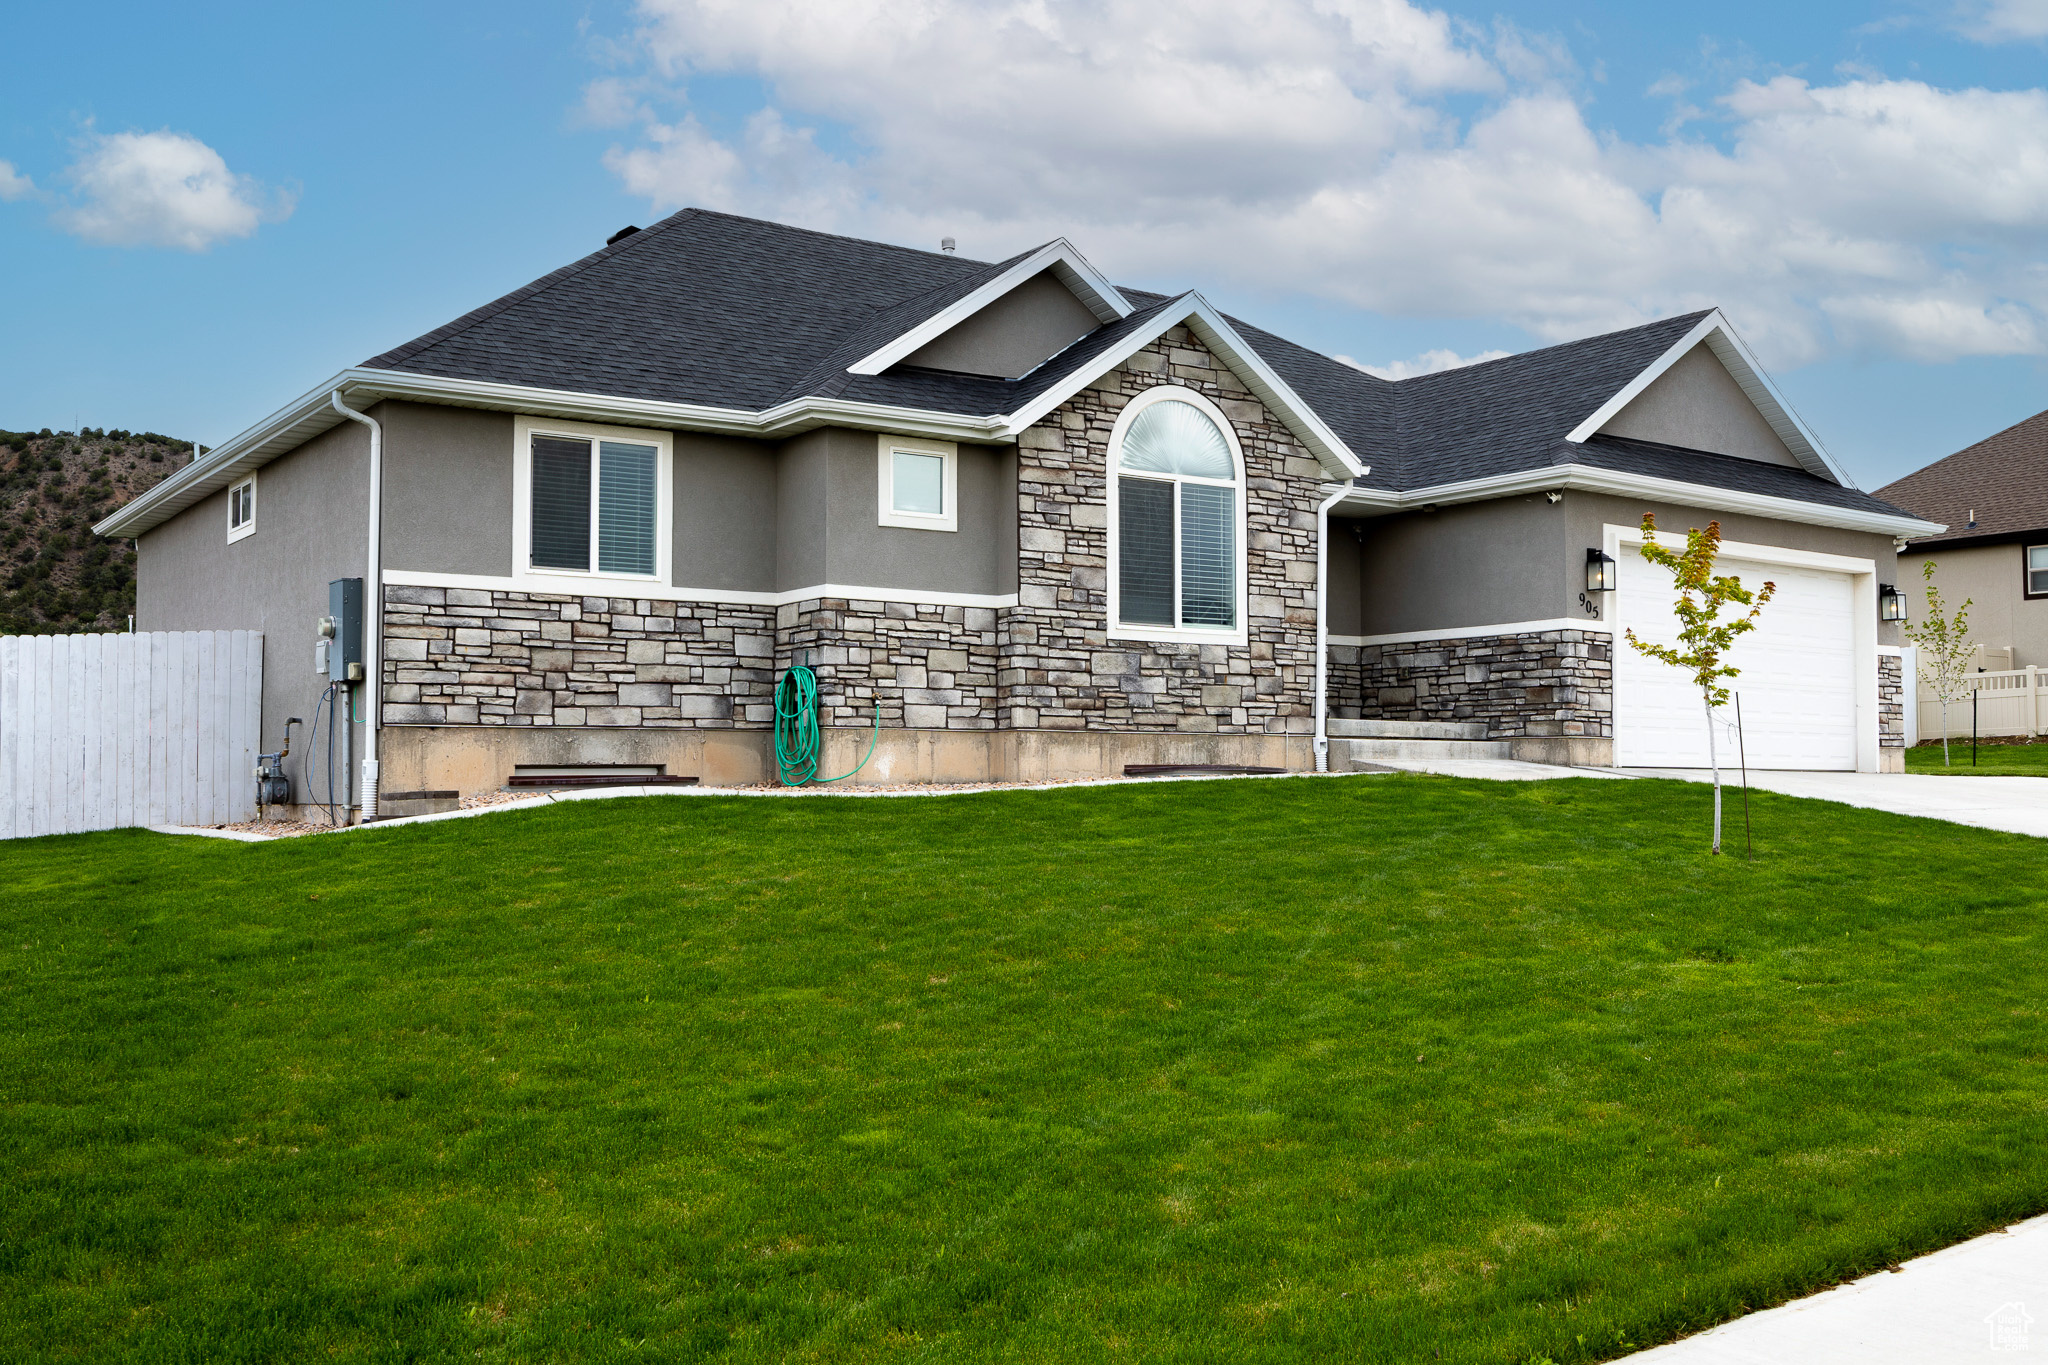
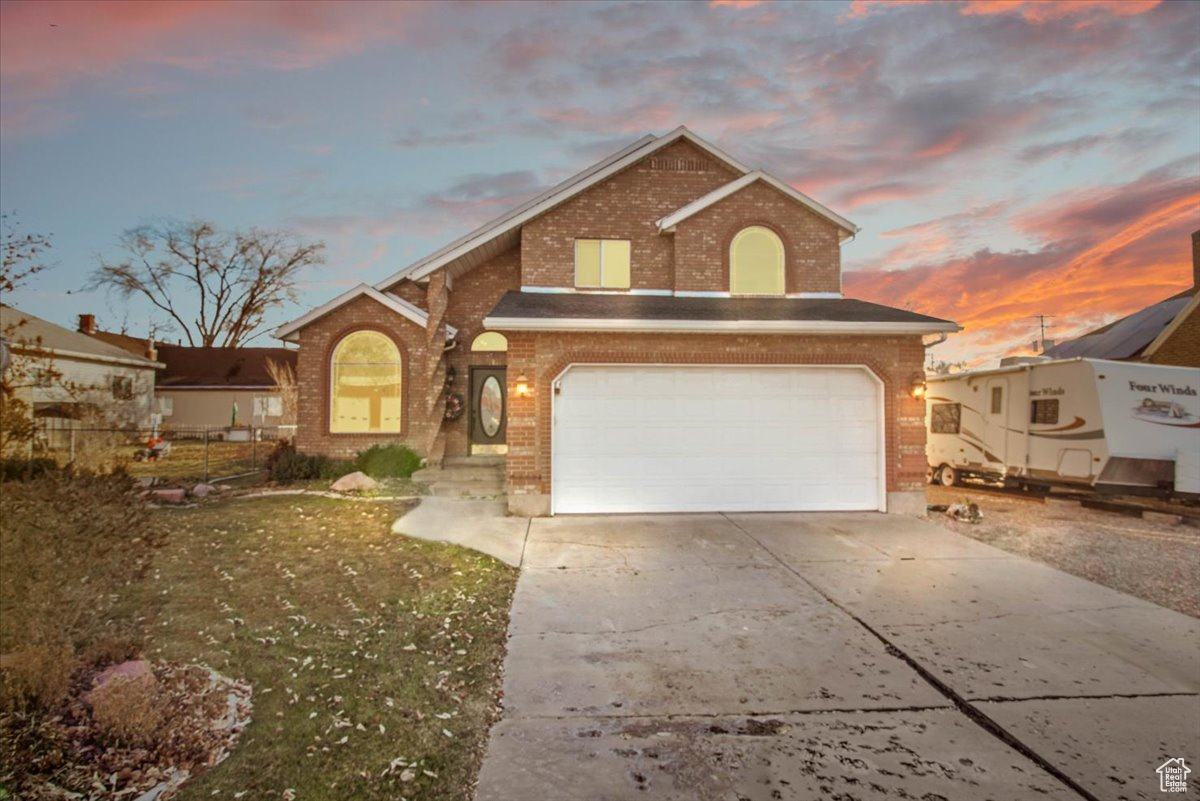
Active
$559,000
6
bds
|
3
ba
|
3,240
sqft
|
built
2019
905 S 270 E, Nephi, UT 84648
$-1,433
Cash flow
-13.4%
Cash-on-Cash Return
3.2%
Cap rate
0.4%
Rent to Value Ratio
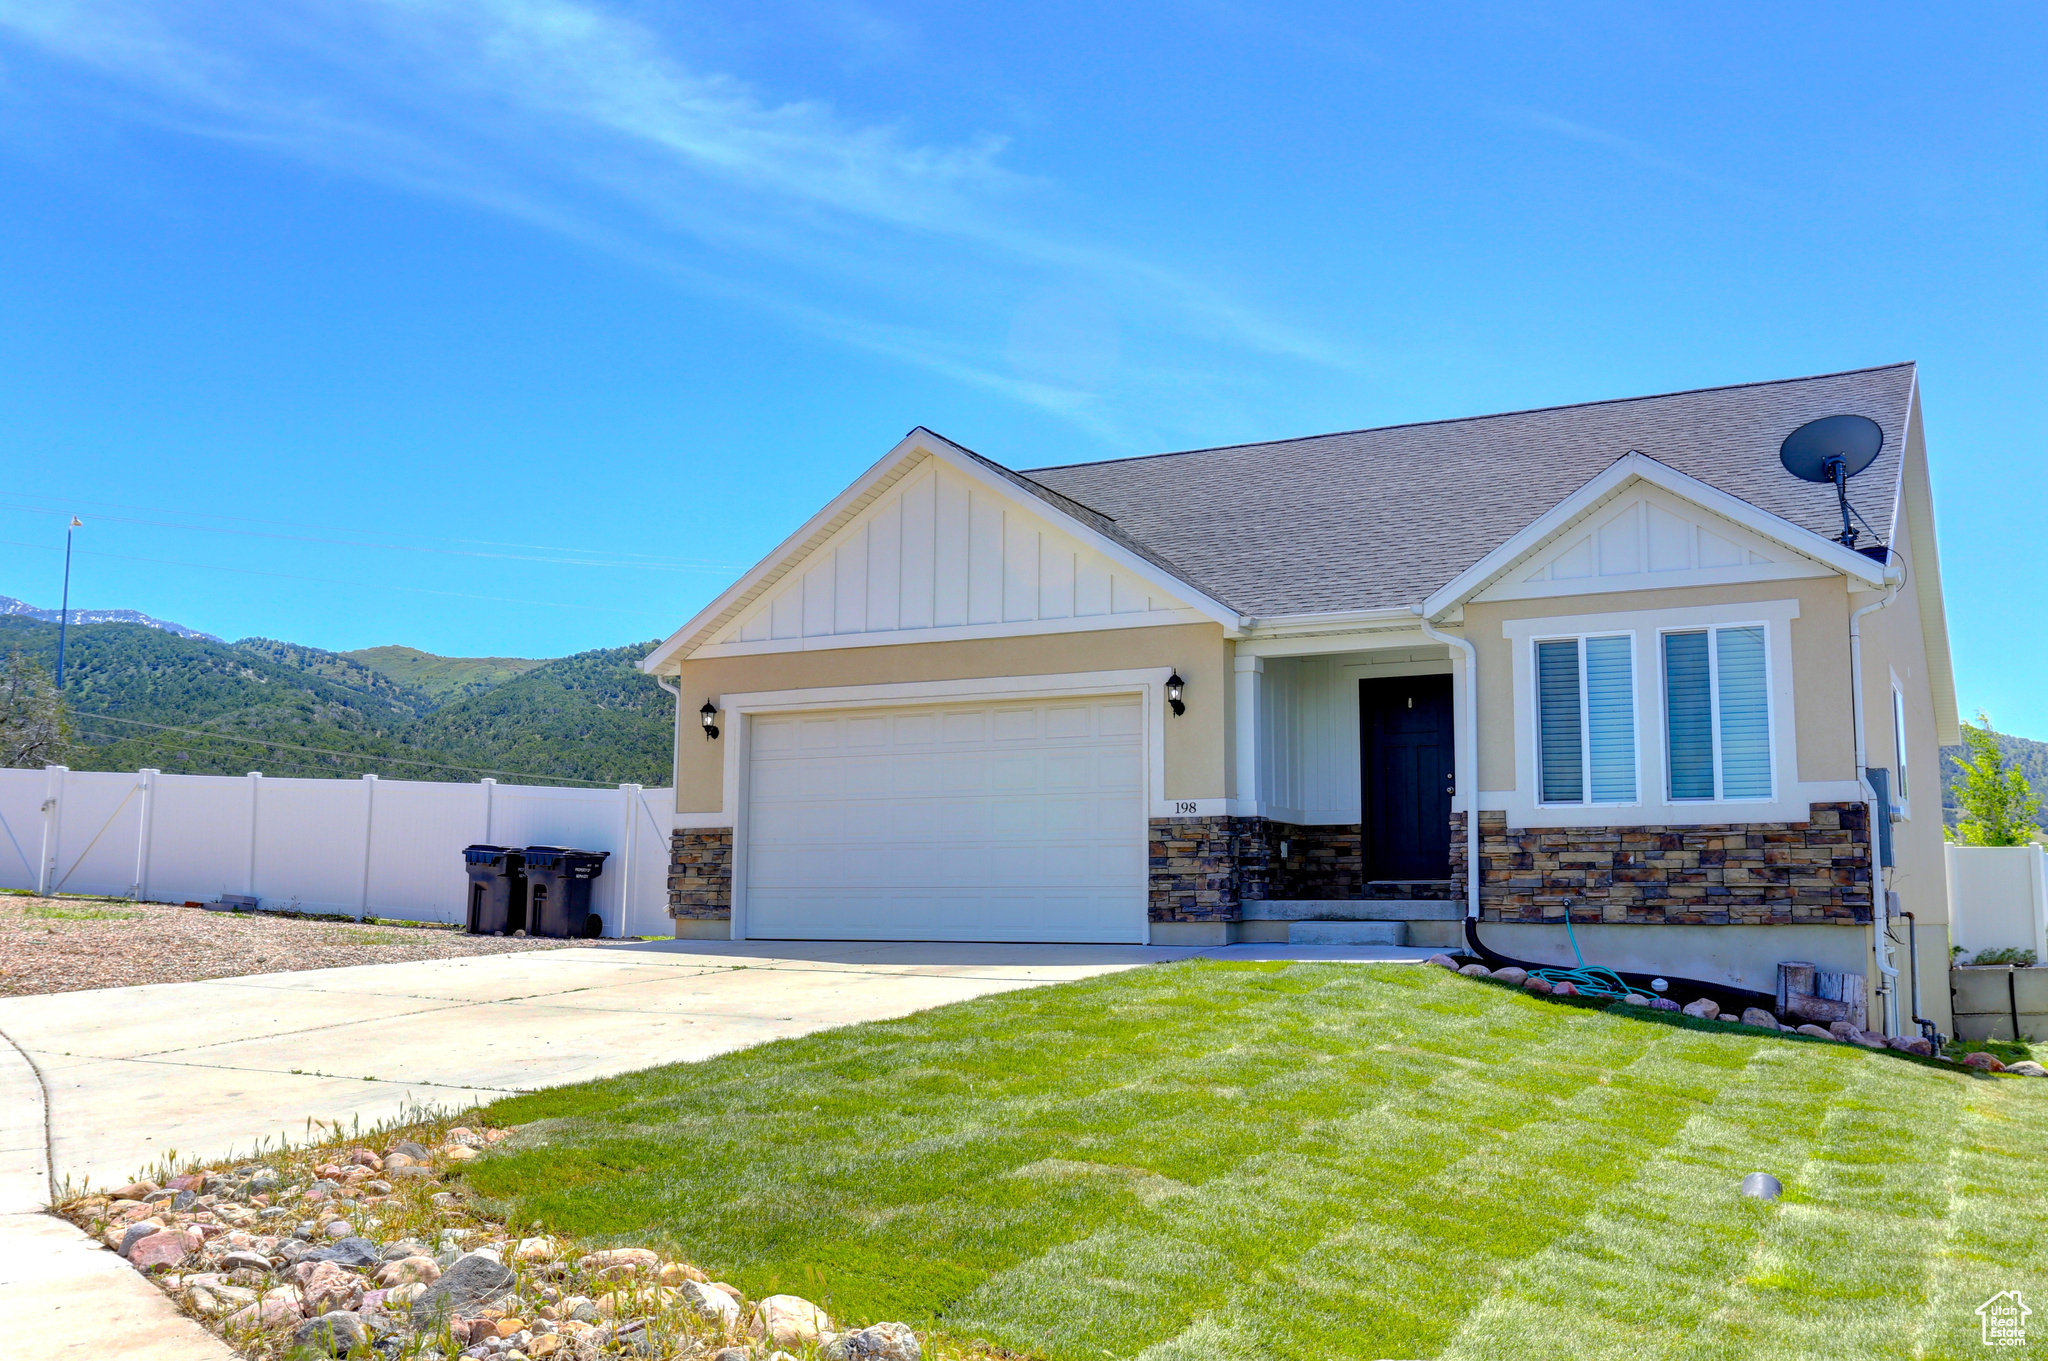
Active
$509,900
5
bds
|
3
ba
|
2,700
sqft
|
built
2017
198 E 1430 S, Nephi, UT 84648
$-1,169
Cash flow
-12.0%
Cash-on-Cash Return
3.5%
Cap rate
0.5%
Rent to Value Ratio
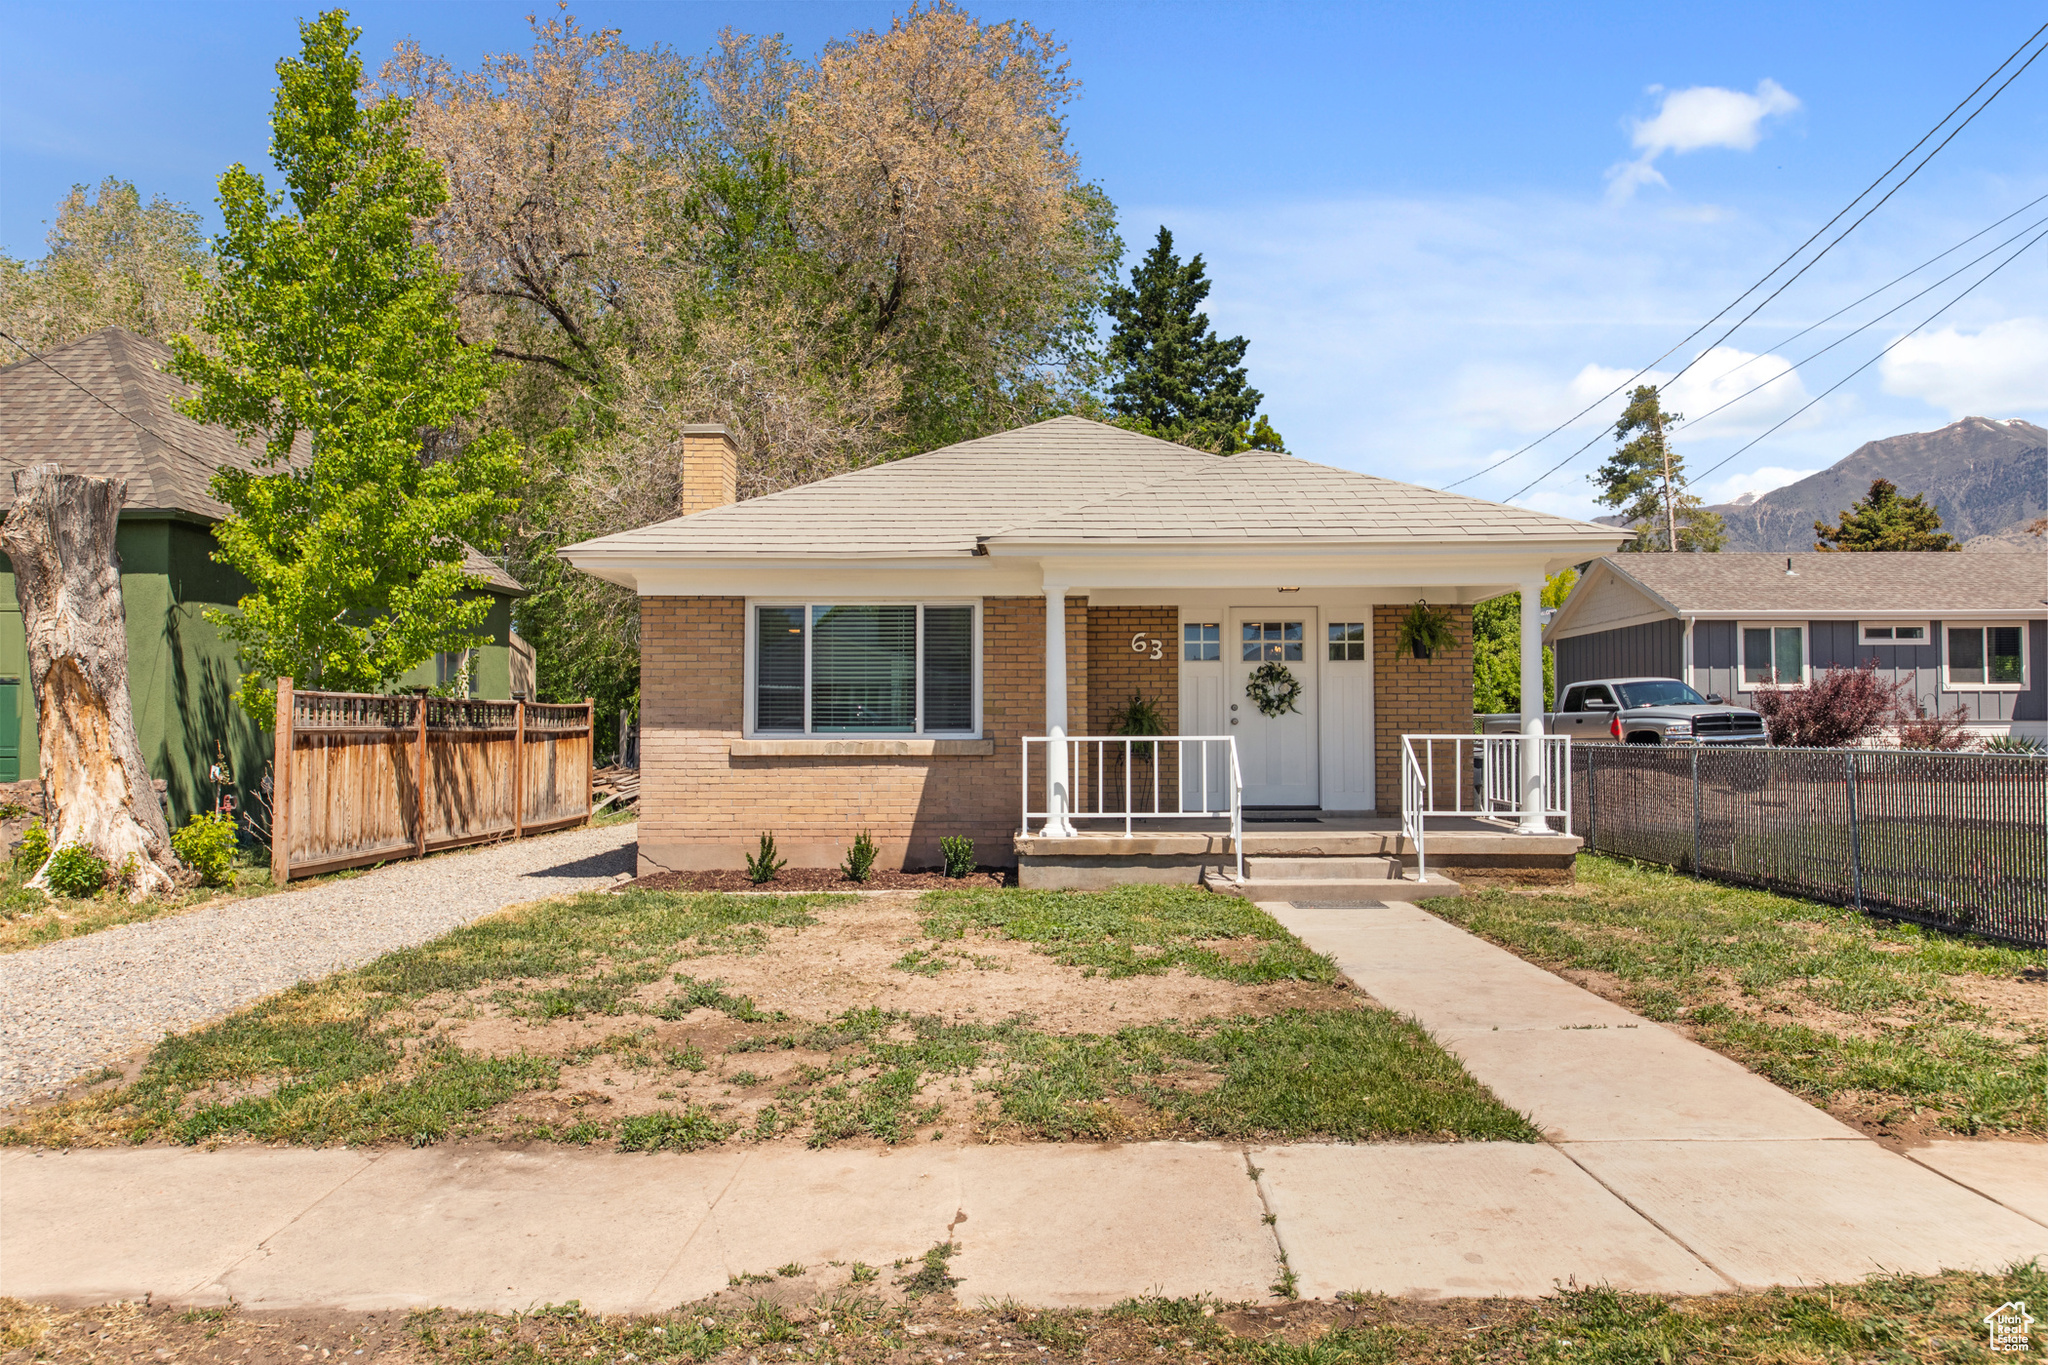
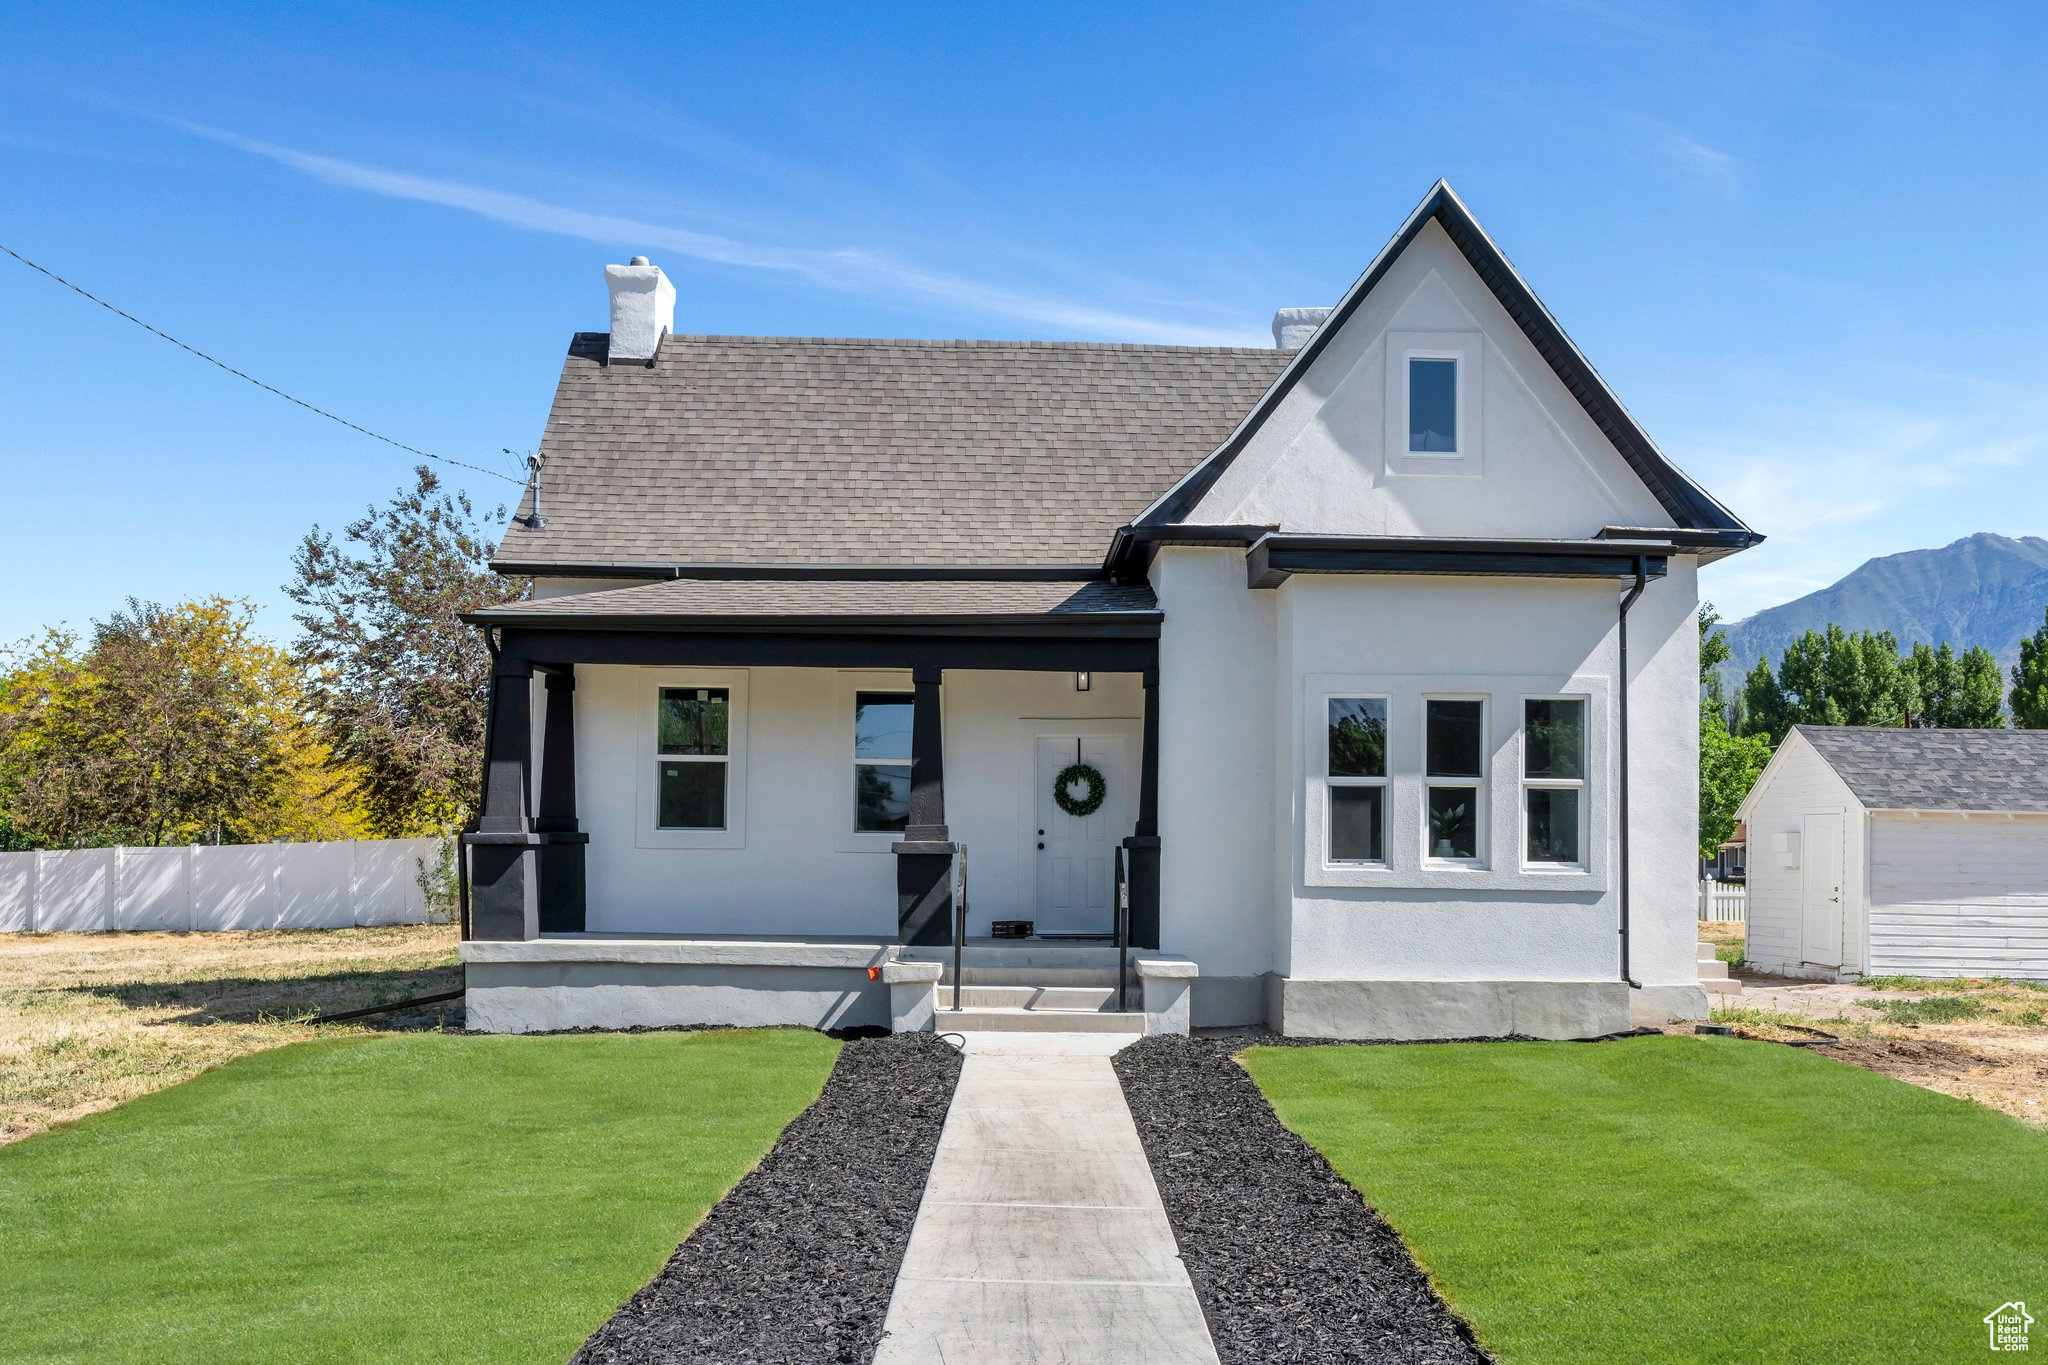
Active
$385,000
2
bds
|
2
ba
|
1,362
sqft
|
built
1928
63 E 100 S, Nephi, UT 84648
$-1,359
Cash flow
-18.4%
Cash-on-Cash Return
2.0%
Cap rate
0.3%
Rent to Value Ratio
Active
$425,000
3
bds
|
3
ba
|
2,298
sqft
|
built
1978
221 N 1800th W, Nephi, UT 84648
$-656
Cash flow
-8.1%
Cash-on-Cash Return
4.4%
Cap rate
0.6%
Rent to Value Ratio
Active
$400,000
3
bds
|
1
ba
|
1,443
sqft
|
built
1911
187 N 1800 W, Nephi, UT 84648
$-683
Cash flow
-8.9%
Cash-on-Cash Return
4.2%
Cap rate
0.6%
Rent to Value Ratio
Active
$499,900
6
bds
|
3
ba
|
3,338
sqft
|
built
2016
1335 N 150 E, Nephi, UT 84648
$-919
Cash flow
-9.6%
Cash-on-Cash Return
4.1%
Cap rate
0.6%
Rent to Value Ratio

Active
$440,000
5
bds
|
4
ba
|
2,663
sqft
|
built
2022
144 W 900 N, Nephi, UT 84648
$-1,197
Cash flow
-14.2%
Cash-on-Cash Return
3.0%
Cap rate
0.5%
Rent to Value Ratio
Active
$625,000
6
bds
|
3
ba
|
3,060
sqft
|
built
2022
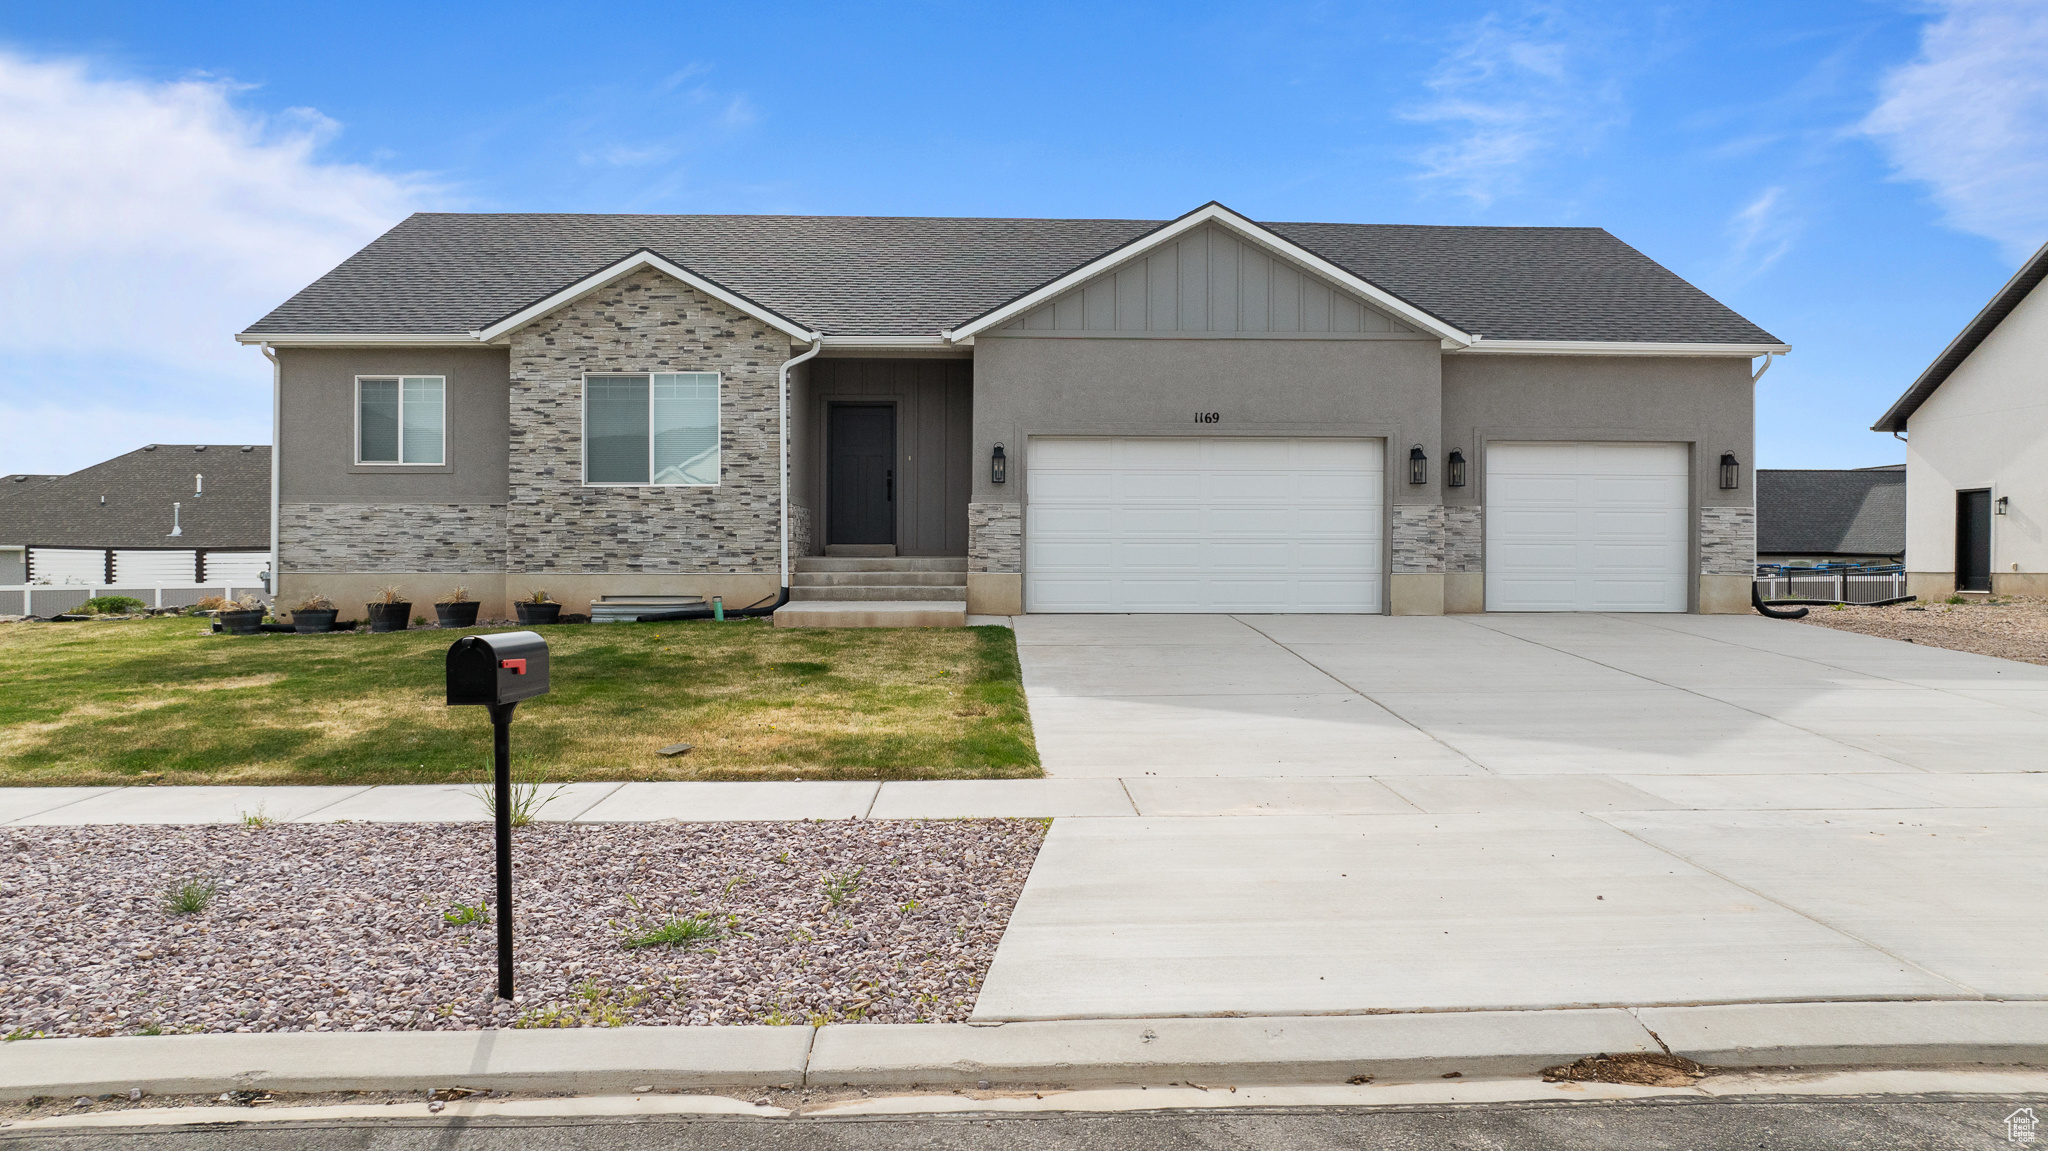
1169 N 200 E, Nephi, UT 84648
$-1,108
Cash flow
-9.2%
Cash-on-Cash Return
4.2%
Cap rate
0.6%
Rent to Value Ratio
Active
$500,000
6
bds
|
3
ba
|
3,018
sqft
|
built
1963
377 E 300 S, Nephi, UT 84648
$-1,709
Cash flow
-17.8%
Cash-on-Cash Return
2.2%
Cap rate
0.3%
Rent to Value Ratio

Pending
$439,999
4
bds
|
3
ba
|
2,060
sqft
|
built
1920
687 N 700 E, Nephi, UT 84648
$-1,246
Cash flow
-14.8%
Cash-on-Cash Return
2.9%
Cap rate
0.4%
Rent to Value Ratio
Active
$345,000
4
bds
|
1
ba
|
2,086
sqft
|
built
1922
296 W 700 N, Nephi, UT 84648
$-607
Cash flow
-9.2%
Cash-on-Cash Return
4.2%
Cap rate
0.5%
Rent to Value Ratio

Active
$345,000
2
bds
|
1
ba
|
962
sqft
|
built
1878
480 E 200 N, Nephi, UT 84648
$-978
Cash flow
-14.8%
Cash-on-Cash Return
2.9%
Cap rate
0.4%
Rent to Value Ratio

Active
$460,000
4
bds
|
2
ba
|
3,168
sqft
|
built
1914
396 N 100 E, Nephi, UT 84648
$-1,098
Cash flow
-12.5%
Cash-on-Cash Return
3.4%
Cap rate
0.5%
Rent to Value Ratio
Active
$599,999
4
bds
|
2
ba
|
2,900
sqft
|
built
1980
155 E 700 S, Nephi, UT 84648
$-2,138
Cash flow
-18.6%
Cash-on-Cash Return
2.0%
Cap rate
0.3%
Rent to Value Ratio
Active
$674,000
3
bds
|
3
ba
|
2,359
sqft
|
built
1998
145 N 400 W, Nephi, UT 84648
$-2,283
Cash flow
-17.7%
Cash-on-Cash Return
2.2%
Cap rate
0.3%
Rent to Value Ratio
Active
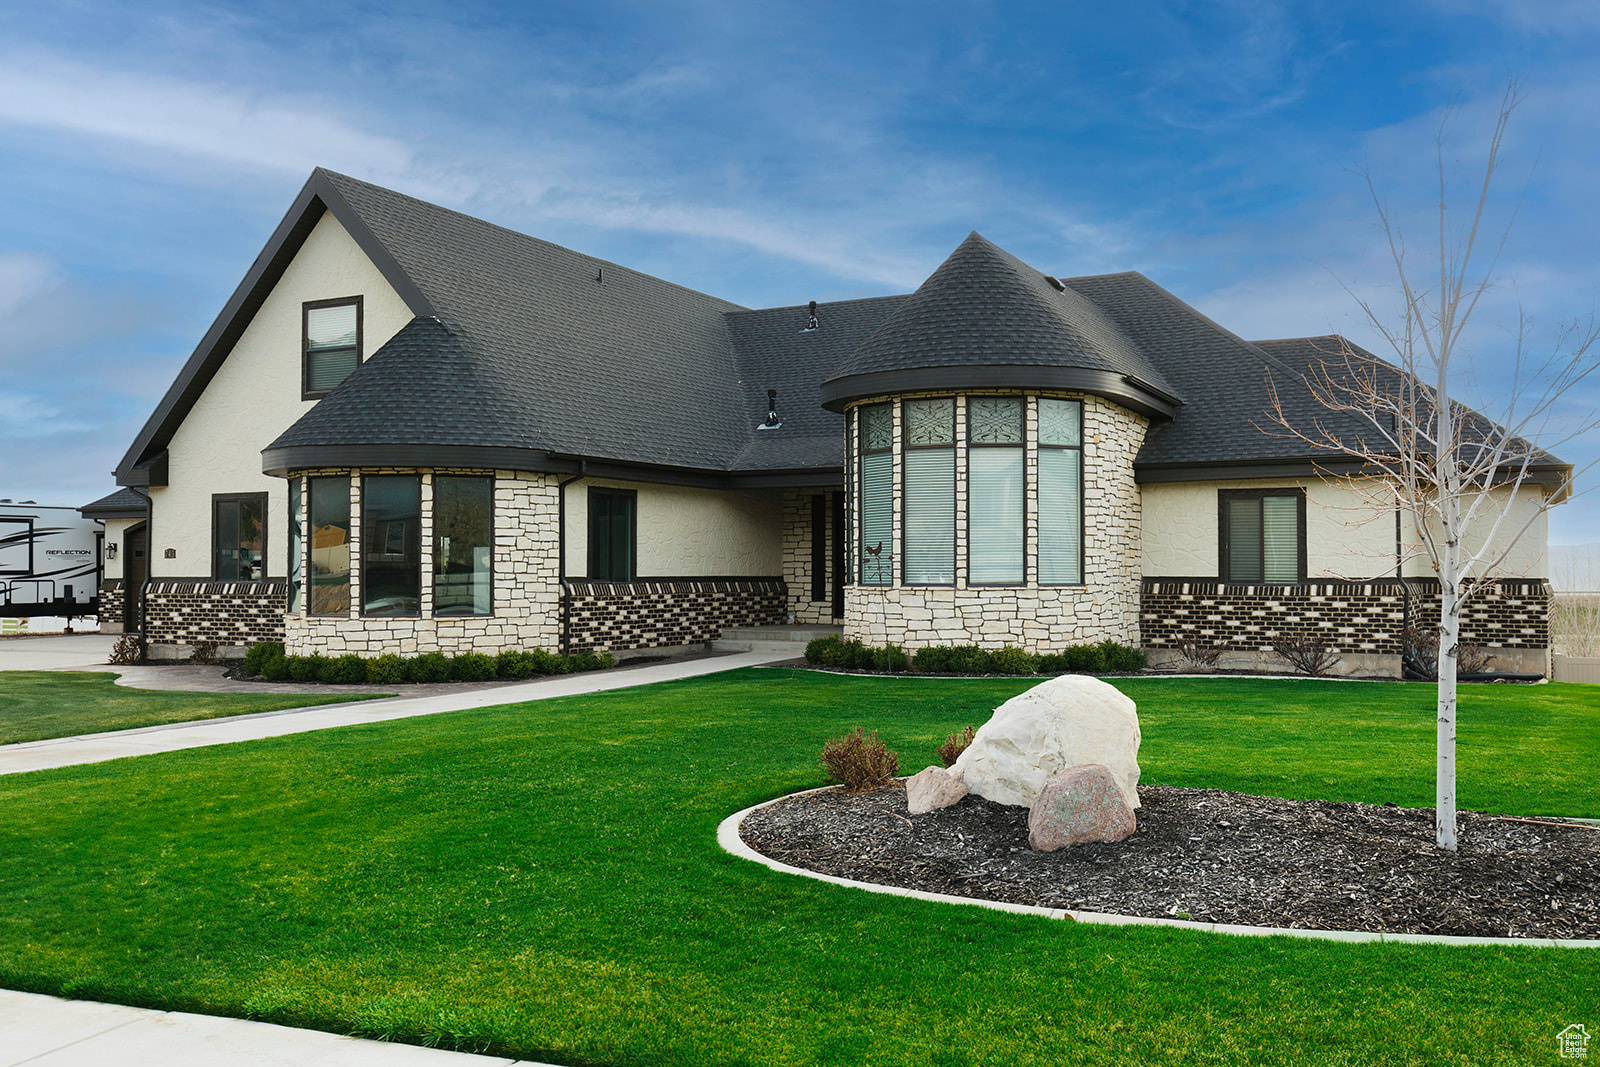
$1,394,000
4
bds
|
4
ba
|
4,457
sqft
|
built
2022
1296 W 800 S, Nephi, UT 84648
$-4,187
Cash flow
-15.7%
Cash-on-Cash Return
2.7%
Cap rate
0.4%
Rent to Value Ratio
Active
$1,275,000
8
bds
|
6
ba
|
6,489
sqft
|
built
2017
743 N 1100 E, Nephi, UT 84648
$-4,052
Cash flow
-16.6%
Cash-on-Cash Return
2.5%
Cap rate
0.4%
Rent to Value Ratio
Active
$499,000
4
bds
|
2
ba
|
2,442
sqft
|
built
1998
68 E 100 N, Nephi, UT 84648
$-1,303
Cash flow
-13.6%
Cash-on-Cash Return
3.2%
Cap rate
0.4%
Rent to Value Ratio