Oklahoma City, OK Investment Properties for Sale
Browse homes for sale and investment properties in Oklahoma City, OK. Refine your search by price, property type, or more.
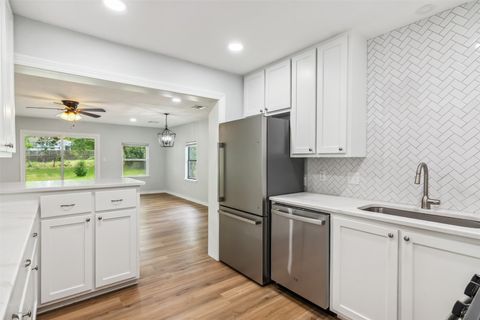
Best cash flowing properties in Oklahoma City, OK
Active
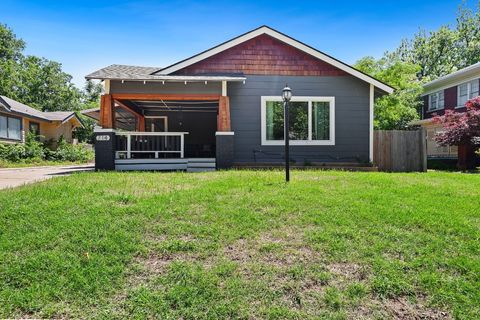
$100,000
2
bds
|
2
ba
|
0
sqft
|
built
1985
2720 SW 74th St, Oklahoma City, OK 73159
$578
Cash flow
30.2%
Cash-on-Cash Return
12.6%
Cap rate
1.6%
Rent to Value Ratio
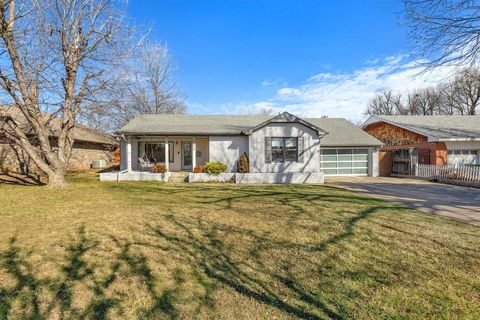
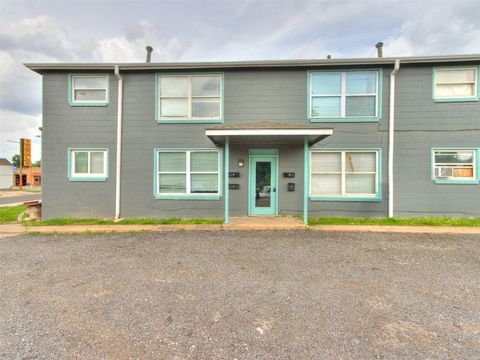
Active
$155,000
3
bds
|
2
ba
|
0
sqft
|
built
1960
601 SE 70th St, Oklahoma City, OK 73149
$309
Cash flow
10.4%
Cash-on-Cash Return
8.1%
Cap rate
1.0%
Rent to Value Ratio
1,176 out of 1,820 properties for sale in Oklahoma City, OK
Limited Results Shown
Create a free account, or log in to reveal all property listings and enjoy the complete experience.
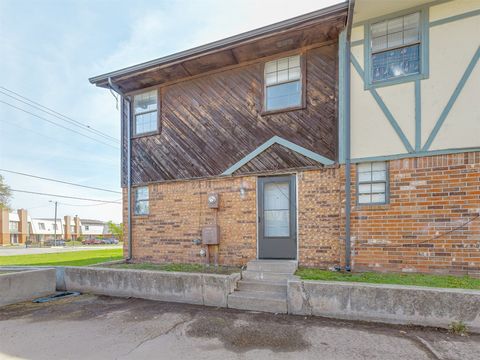
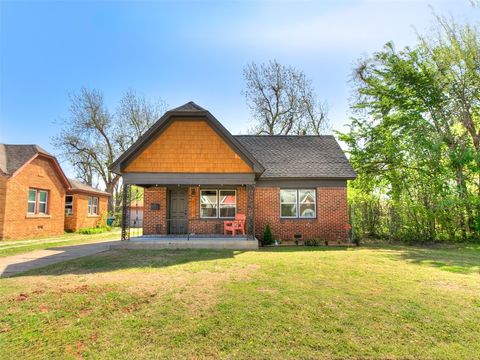
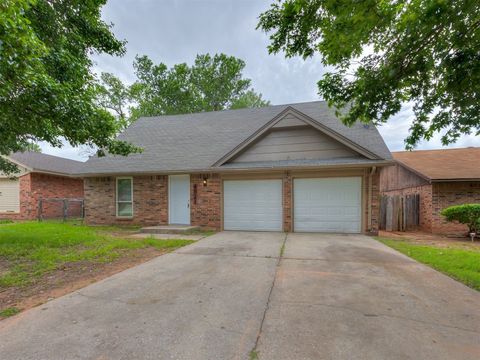
Active
$215,000
2
bds
|
1
ba
|
0
sqft
|
built
1922
833 NW 34th St, Oklahoma City, OK 73118
$-34
Cash flow
-0.8%
Cash-on-Cash Return
5.5%
Cap rate
0.8%
Rent to Value Ratio
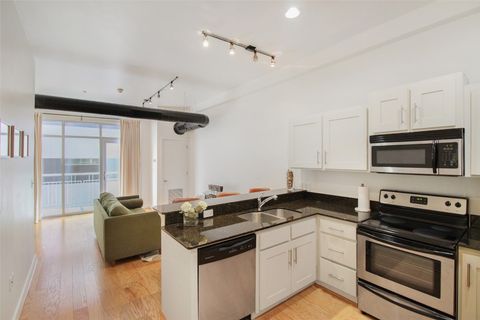
Active
$750,000
4
bds
|
4
ba
|
0
sqft
|
built
2012
14424 Caledonia Way, Oklahoma City, OK 73142
$-1,805
Cash flow
-12.6%
Cash-on-Cash Return
2.8%
Cap rate
0.5%
Rent to Value Ratio
Active
$175,000
2
bds
|
1
ba
|
0
sqft
|
built
1952
1436 NW 97th St, Oklahoma City, OK 73114
$-83
Cash flow
-2.5%
Cash-on-Cash Return
5.1%
Cap rate
0.7%
Rent to Value Ratio
Active
$215,000
2
bds
|
1
ba
|
0
sqft
|
built
1929
2329 NW 22nd St, Oklahoma City, OK 73107
$-217
Cash flow
-5.3%
Cash-on-Cash Return
4.5%
Cap rate
0.6%
Rent to Value Ratio
Active
$295,000
3
bds
|
3
ba
|
0
sqft
|
built
1966
6704 Tall Oaks Dr, Oklahoma City, OK 73127
$-168
Cash flow
-3.0%
Cash-on-Cash Return
5.0%
Cap rate
0.7%
Rent to Value Ratio
Active
$208,000
2
bds
|
2
ba
|
0
sqft
|
built
1962
4412 NW 57th St, Oklahoma City, OK 73112
$-89
Cash flow
-2.2%
Cash-on-Cash Return
5.2%
Cap rate
0.8%
Rent to Value Ratio
Active
$255,000
4
bds
|
3
ba
|
0
sqft
|
built
1975
2909 Wheeler Ct, Oklahoma City, OK 73127
$-312
Cash flow
-6.4%
Cash-on-Cash Return
4.2%
Cap rate
0.7%
Rent to Value Ratio
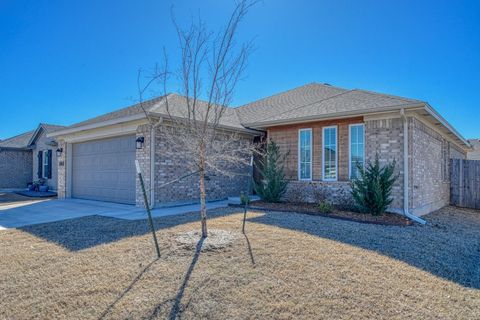
Active
$279,900
3
bds
|
2
ba
|
0
sqft
|
built
2022
1256 SW 159th Ter, Oklahoma City, OK 73170
$-429
Cash flow
-8.0%
Cash-on-Cash Return
3.8%
Cap rate
0.6%
Rent to Value Ratio
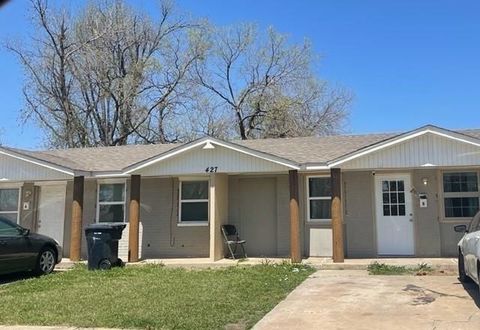
Active
$165,000
3
bds
|
3
ba
|
0
sqft
|
built
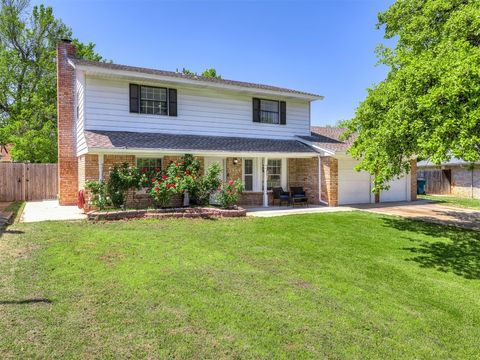
1983
427 SE 17th St, Oklahoma City, OK 73129
$-130
Cash flow
-4.1%
Cash-on-Cash Return
4.7%
Cap rate
0.7%
Rent to Value Ratio
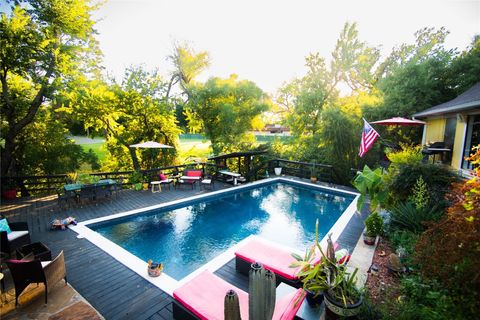
Active
$499,000
5
bds
|
4
ba
|
0
sqft
|
built
1973
11209 Blue Stem Dr, Oklahoma City, OK 73162
$-114
Cash flow
-1.2%
Cash-on-Cash Return
5.4%
Cap rate
0.8%
Rent to Value Ratio
Active
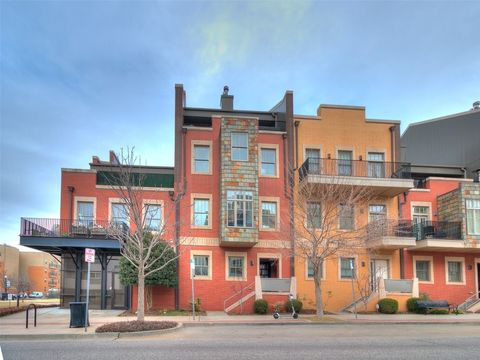
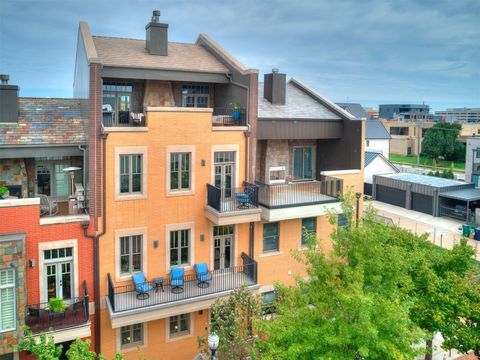
$1,200,000
3
bds
|
5
ba
|
0
sqft
|
built
2008
109 NE 3rd St, Oklahoma City, OK 73104
$-357
Cash flow
-1.6%
Cash-on-Cash Return
5.3%
Cap rate
0.8%
Rent to Value Ratio
Active
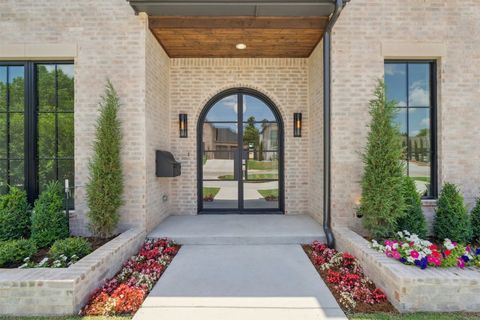
$1,875,000
4
bds
|
5
ba
|
0
sqft
|
built
2025
2716 W Country Club Dr, Oklahoma City, OK 73116
$-7,590
Cash flow
-21.1%
Cash-on-Cash Return
0.8%
Cap rate
0.1%
Rent to Value Ratio
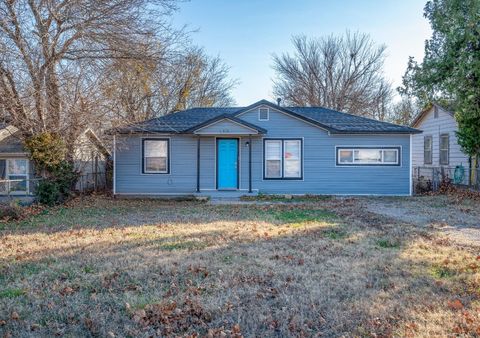
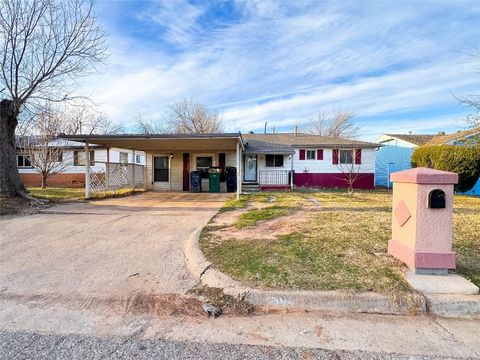
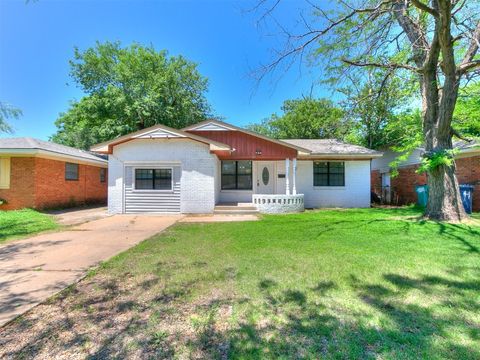
Active
$126,500
3
bds
|
1
ba
|
0
sqft
|
built
1952
4126 Jones Blvd, Oklahoma City, OK 73135
$97
Cash flow
4.0%
Cash-on-Cash Return
6.6%
Cap rate
0.9%
Rent to Value Ratio
Active
$155,000
3
bds
|
2
ba
|
0
sqft
|
built
1960
601 SE 70th St, Oklahoma City, OK 73149
$309
Cash flow
10.4%
Cash-on-Cash Return
8.1%
Cap rate
1.0%
Rent to Value Ratio
Active
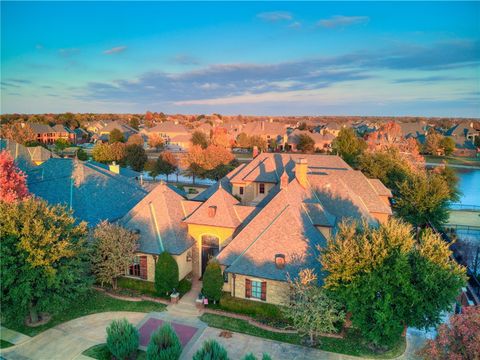
$2,395,000
4
bds
|
7
ba
|
0
sqft
|
built
2005
12912 Anduin Ave, Oklahoma City, OK 73170
$-9,006
Cash flow
-19.6%
Cash-on-Cash Return
1.2%
Cap rate
0.2%
Rent to Value Ratio
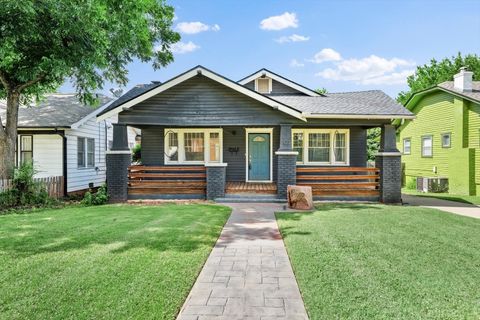
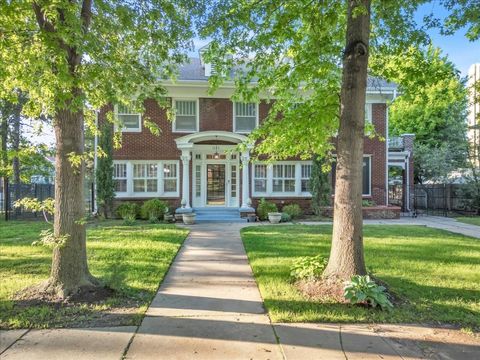
Active
$473,400
3
bds
|
3
ba
|
0
sqft
|
built
1915
714 NW 32nd St, Oklahoma City, OK 73118
$-404
Cash flow
-4.5%
Cash-on-Cash Return
4.7%
Cap rate
0.7%
Rent to Value Ratio
Active
$395,900
3
bds
|
3
ba
|
0
sqft
|
built
1929
2523 NW 57th St, Oklahoma City, OK 73112
$-906
Cash flow
-11.9%
Cash-on-Cash Return
2.9%
Cap rate
0.5%
Rent to Value Ratio
Active
$164,900
2
bds
|
1
ba
|
0
sqft
|
built
2025
2212 N Kelham Ave, Oklahoma City, OK 73111
$-82
Cash flow
-2.6%
Cash-on-Cash Return
5.1%
Cap rate
0.7%
Rent to Value Ratio
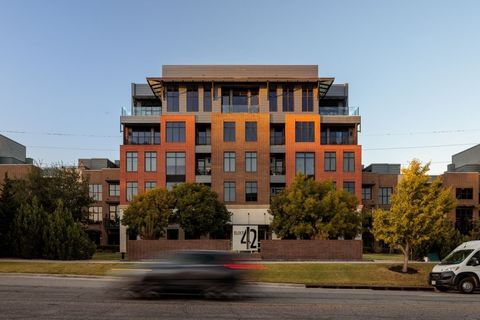
Active
$200,000
1
bds
|
1
ba
|
0
sqft
|
built
2009
1 NE 2nd St, Oklahoma City, OK 73104
$-413
Cash flow
-10.8%
Cash-on-Cash Return
3.2%
Cap rate
0.7%
Rent to Value Ratio
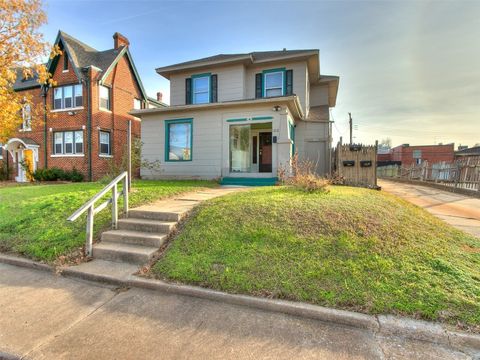
Active
$249,000
3
bds
|
2
ba
|
0
sqft
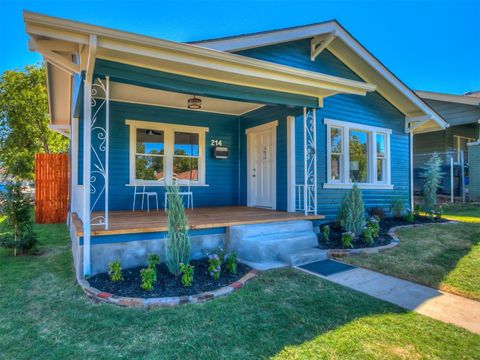
|
built
1929
214 NW 25th St, Oklahoma City, OK 73103
$-176
Cash flow
-3.7%
Cash-on-Cash Return
4.8%
Cap rate
0.6%
Rent to Value Ratio
Active
$200,000
4
bds
|
1
ba
|
0
sqft
|
built
1936
3125 NW 24th St, Oklahoma City, OK 73107
$5
Cash flow
0.1%
Cash-on-Cash Return
5.7%
Cap rate
0.8%
Rent to Value Ratio

Active
$495,000
4
bds
|
2
ba
|
0
sqft
|
built
1910
904 NW 19th St, Oklahoma City, OK 73106
$-677
Cash flow
-7.1%
Cash-on-Cash Return
4.0%
Cap rate
0.6%
Rent to Value Ratio
Active
$609,500
2
bds
|
2
ba
|
0
sqft
|
built
1936
500 NW 41st St, Oklahoma City, OK 73118
$-882
Cash flow
-7.6%
Cash-on-Cash Return
3.9%
Cap rate
0.6%
Rent to Value Ratio
Active
$455,000
4
bds
|
4
ba
|
0
sqft
|
built
2021
109 SW 167th St, Oklahoma City, OK 73170
$-429
Cash flow
-4.9%
Cash-on-Cash Return
4.5%
Cap rate
0.7%
Rent to Value Ratio
Active
$169,900
3
bds
|
2
ba
|
0
sqft
|
built
1980
4821 Cinderella Dr, Oklahoma City, OK 73129
$172
Cash flow
5.3%
Cash-on-Cash Return
6.9%
Cap rate
0.9%
Rent to Value Ratio

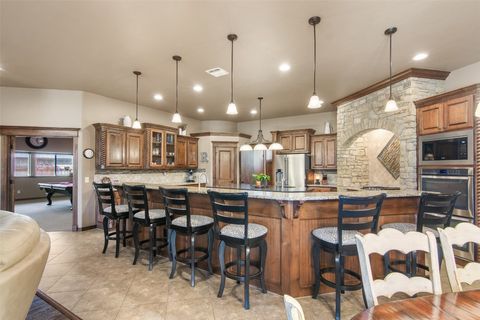
Active
$995,000
4
bds
|
5
ba
|
0
sqft
|
built
1994
4800 Bocage Pl, Oklahoma City, OK 73142
$-2,373
Cash flow
-12.4%
Cash-on-Cash Return
2.8%
Cap rate
0.5%
Rent to Value Ratio
Active
$697,000
4
bds
|
3
ba
|
0
sqft
|
built
1925
1223 NW 20th St, Oklahoma City, OK 73106
$-2,003
Cash flow
-15.0%
Cash-on-Cash Return
2.2%
Cap rate
0.4%
Rent to Value Ratio
Active
$1,500,000
8
bds
|
8
ba
|
0
sqft
|
built
1930
506 SW 24th St, Oklahoma City, OK 73109
$-5,923
Cash flow
-20.6%
Cash-on-Cash Return
0.9%
Cap rate
0.1%
Rent to Value Ratio
Active
$165,000
4
bds
|
1
ba
|
0
sqft
|
built
1960
321 NW 80th St, Oklahoma City, OK 73114
$130
Cash flow
4.1%
Cash-on-Cash Return
6.6%
Cap rate
0.8%
Rent to Value Ratio
Active
$100,000
2
bds
|
2
ba
|
0
sqft
|
built
1985
2720 SW 74th St, Oklahoma City, OK 73159
$578
Cash flow
30.2%
Cash-on-Cash Return
12.6%
Cap rate
1.6%
Rent to Value Ratio
Active
$980,000
3
bds
|
4
ba
|
0
sqft
|
built
2022
117 NE 3rd St, Oklahoma City, OK 73104
$-2,452
Cash flow
-13.1%
Cash-on-Cash Return
2.7%
Cap rate
0.4%
Rent to Value Ratio
Active
$457,900
6
bds
|
4
ba
|
0
sqft
|
built
1910
312 NW 24th St, Oklahoma City, OK 73103
$-994
Cash flow
-11.3%
Cash-on-Cash Return
3.1%
Cap rate
0.4%
Rent to Value Ratio
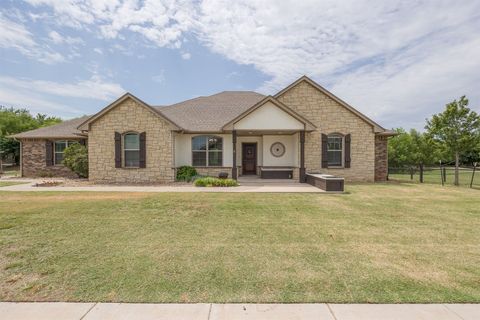
Active
$479,900
4
bds
|
4
ba
|
0
sqft
|
built
2016
14709 Bella Maria Dr, Oklahoma City, OK 73165
$-350
Cash flow
-3.8%
Cash-on-Cash Return
4.8%
Cap rate
0.7%
Rent to Value Ratio
Active
$875,000
3
bds
|
4
ba
|
0
sqft
|
built
2008
223 NE 4th St, Oklahoma City, OK 73104
$-2,668
Cash flow
-15.9%
Cash-on-Cash Return
2.0%
Cap rate
0.5%
Rent to Value Ratio
Active
$139,900
3
bds
|
2
ba
|
0
sqft
|
built
1928
940 NE 32nd St, Oklahoma City, OK 73105
$246
Cash flow
9.2%
Cash-on-Cash Return
7.8%
Cap rate
1.0%
Rent to Value Ratio

Active
$212,000
3
bds
|
2
ba
|
0
sqft
|
built
1983
401 NW 120th St, Oklahoma City, OK 73114
$12
Cash flow
0.3%
Cash-on-Cash Return
5.7%
Cap rate
0.8%
Rent to Value Ratio

Active
$307,000
4
bds
|
3
ba
|
0
sqft
|
built
1970
2416 NW 115th St, Oklahoma City, OK 73120
$-286
Cash flow
-4.9%
Cash-on-Cash Return
4.6%
Cap rate
0.6%
Rent to Value Ratio

Active
$187,900
2
bds
|
3
ba
|
0
sqft
|
built
1975
5805 Hefner Village Ct, Oklahoma City, OK 73162
$-215
Cash flow
-6.0%
Cash-on-Cash Return
4.3%
Cap rate
0.9%
Rent to Value Ratio

Active
$129,900
2
bds
|
1
ba
|
0
sqft
|
built
1929
2144 NW 32nd St, Oklahoma City, OK 73112
$184
Cash flow
7.4%
Cash-on-Cash Return
7.4%
Cap rate
1.0%
Rent to Value Ratio

Active
$205,999
2
bds
|
3
ba
|
0
sqft
|
built
1978
7817 Old Hickory Ln, Oklahoma City, OK 73116
$-254
Cash flow
-6.4%
Cash-on-Cash Return
4.2%
Cap rate
0.8%
Rent to Value Ratio