Oklahoma City, OK Investment Properties for Sale
Browse homes for sale and investment properties in Oklahoma City, OK. Refine your search by price, property type, or more.
Best cash flowing properties in Oklahoma City, OK
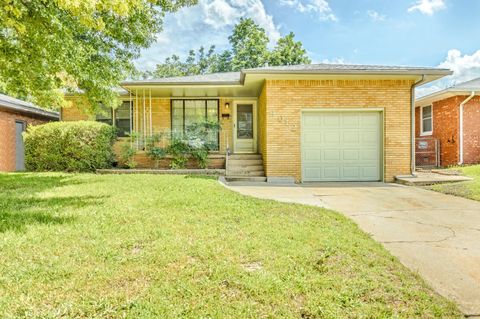
Active
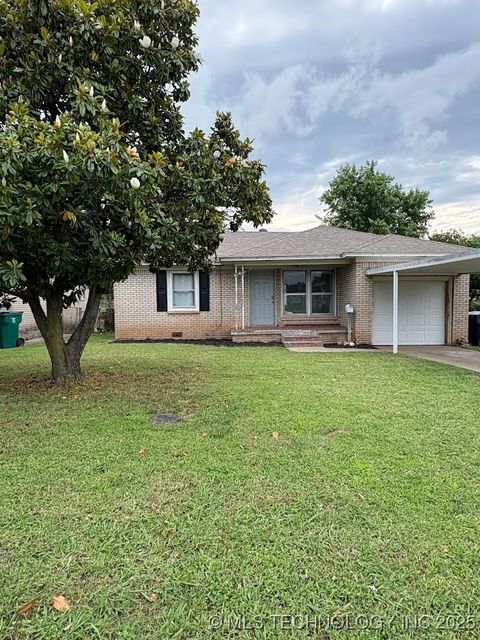
$117,000
2
bds
|
1
ba
|
783
sqft
|
built
1952
9621 N Mc Kinley Ave, Oklahoma City, OK 73114
$357
Cash flow
15.9%
Cash-on-Cash Return
9.3%
Cap rate
1.2%
Rent to Value Ratio

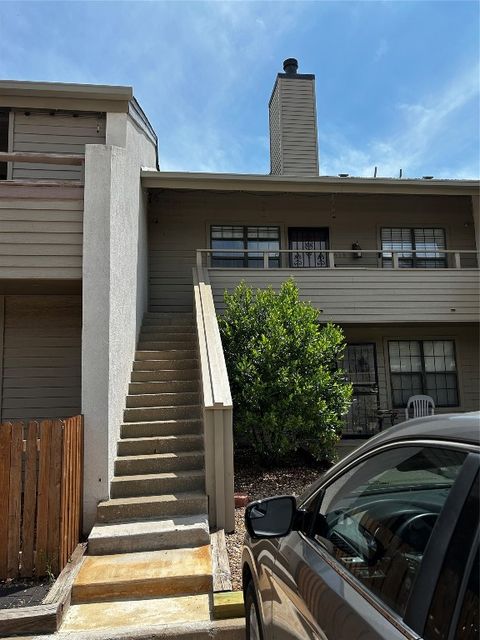
Active
$119,000
3
bds
|
1
ba
|
0
sqft
|
built
1948
3201 NW 32nd St, Oklahoma City, OK 73112
$323
Cash flow
14.2%
Cash-on-Cash Return
8.9%
Cap rate
1.2%
Rent to Value Ratio
1,114 out of 1,448 properties for sale in Oklahoma City, OK
Limited Results Shown
Create a free account, or log in to reveal all property listings and enjoy the complete experience.
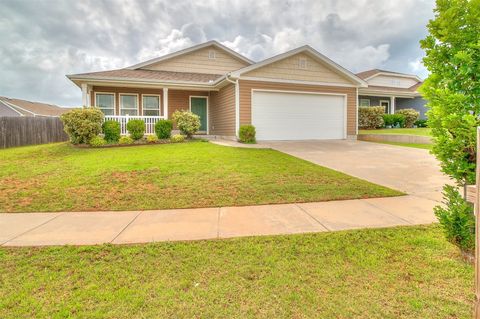
Active
$350,000
7
bds
|
4
ba
|
0
sqft
|
built
1949
6101 S Douglas Ave, Oklahoma City, OK 73139
$-690
Cash flow
-10.3%
Cash-on-Cash Return
3.3%
Cap rate
0.4%
Rent to Value Ratio
Active
$275,000
3
bds
|
2
ba
|
0
sqft
|
built
1937
2505 NW 25th St, Oklahoma City, OK 73107
$-201
Cash flow
-3.8%
Cash-on-Cash Return
4.8%
Cap rate
0.7%
Rent to Value Ratio
Active
$255,000
3
bds
|
2
ba
|
0
sqft
|
built
2017
8340 NW 137th St, Oklahoma City, OK 73142
$-223
Cash flow
-4.6%
Cash-on-Cash Return
4.6%
Cap rate
0.7%
Rent to Value Ratio
Active
$178,000
2
bds
|
1
ba
|
0
sqft
|
built
1920
2719 NW 14th St, Oklahoma City, OK 73107
$-105
Cash flow
-3.1%
Cash-on-Cash Return
5.0%
Cap rate
0.7%
Rent to Value Ratio
Active
$305,000
3
bds
|
2
ba
|
0
sqft
|
built
2023
8700 Ricard Dr, Oklahoma City, OK 73135
$-413
Cash flow
-7.1%
Cash-on-Cash Return
4.1%
Cap rate
0.7%
Rent to Value Ratio
Active
$479,900
4
bds
|
4
ba
|
0
sqft
|
built
2016
14709 Bella Maria Dr, Oklahoma City, OK 73165
$-350
Cash flow
-3.8%
Cash-on-Cash Return
4.8%
Cap rate
0.7%
Rent to Value Ratio
Active
$374,900
4
bds
|
3
ba
|
0
sqft
|
built
2008
1600 SW 123rd St, Oklahoma City, OK 73170
$-606
Cash flow
-8.4%
Cash-on-Cash Return
3.7%
Cap rate
0.6%
Rent to Value Ratio
Active
$175,000
3
bds
|
2
ba
|
0
sqft
|
built
1976
4904 Washington Sq, Oklahoma City, OK 73135
$108
Cash flow
3.2%
Cash-on-Cash Return
6.4%
Cap rate
0.9%
Rent to Value Ratio
Active
$950,000
5
bds
|
6
ba
|
0
sqft
|
built
1991
6540 S Donna Ln, Oklahoma City, OK 73150
$-2,570
Cash flow
-14.1%
Cash-on-Cash Return
2.4%
Cap rate
0.4%
Rent to Value Ratio
Active
$225,000
3
bds
|
2
ba
|
0
sqft
|
built
1978
8228 NW 90th Ter, Oklahoma City, OK 73132
$-15
Cash flow
-0.3%
Cash-on-Cash Return
5.6%
Cap rate
0.8%
Rent to Value Ratio
Active
$292,000
3
bds
|
2
ba
|
0
sqft
|
built
2018
3412 Superior Dr, Oklahoma City, OK 73160
$-438
Cash flow
-7.8%
Cash-on-Cash Return
3.9%
Cap rate
0.6%
Rent to Value Ratio
Active
$185,000
3
bds
|
1
ba
|
0
sqft
|
built
1954
3012 NW 67th St, Oklahoma City, OK 73116
$-79
Cash flow
-2.2%
Cash-on-Cash Return
5.2%
Cap rate
0.8%
Rent to Value Ratio
Active
$109,900
2
bds
|
2
ba
|
0
sqft
|
built
1984
11130 Stratford Dr, Oklahoma City, OK 73120
$22
Cash flow
1.0%
Cash-on-Cash Return
5.9%
Cap rate
1.1%
Rent to Value Ratio
Active
$89,000
2
bds
|
1
ba
|
0
sqft
|
built
1953
9424 NE 28th St, Oklahoma City, OK 73141
$136
Cash flow
8.0%
Cash-on-Cash Return
7.5%
Cap rate
1.0%
Rent to Value Ratio
Active
$248,000
3
bds
|
2
ba
|
0
sqft
|
built
2018
15108 Cold Sun Rd, Oklahoma City, OK 73170
$-314
Cash flow
-6.6%
Cash-on-Cash Return
4.2%
Cap rate
0.6%
Rent to Value Ratio
Active
$315,000
4
bds
|
3
ba
|
0
sqft
|
built
1964
4808 NW 68th St, Oklahoma City, OK 73132
$-297
Cash flow
-4.9%
Cash-on-Cash Return
4.5%
Cap rate
0.7%
Rent to Value Ratio
Active
$875,000
3
bds
|
4
ba
|
0
sqft
|
built
2008
223 NE 4th St, Oklahoma City, OK 73104
$-2,668
Cash flow
-15.9%
Cash-on-Cash Return
2.0%
Cap rate
0.5%
Rent to Value Ratio
Active
$795,000
4
bds
|
4
ba
|
0
sqft
|
built
2022
1205 NW 42nd St, Oklahoma City, OK 73118
$-1,965
Cash flow
-12.9%
Cash-on-Cash Return
2.7%
Cap rate
0.5%
Rent to Value Ratio
Active
$234,990
4
bds
|
2
ba
|
0
sqft
|
built
1971
8533 SW 76th St, Oklahoma City, OK 73169
$-345
Cash flow
-7.7%
Cash-on-Cash Return
3.9%
Cap rate
0.6%
Rent to Value Ratio
Active
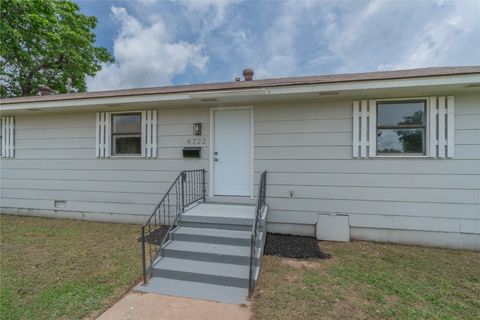
$195,000
4
bds
|
2
ba
|
0
sqft
|
built
1981
4720 S Youngs Blvd, Oklahoma City, OK 73119
$-37
Cash flow
-1.0%
Cash-on-Cash Return
5.5%
Cap rate
0.7%
Rent to Value Ratio
Active
$284,700
3
bds
|
2
ba
|
0
sqft
|
built
2011
716 SW 157th St, Oklahoma City, OK 73170
$-340
Cash flow
-6.2%
Cash-on-Cash Return
4.2%
Cap rate
0.6%
Rent to Value Ratio
Active
$369,900
3
bds
|
2
ba
|
0
sqft
|
built
2008
12409 Gaylon Cir, Oklahoma City, OK 73170
$-556
Cash flow
-7.8%
Cash-on-Cash Return
3.9%
Cap rate
0.6%
Rent to Value Ratio
Active
$270,000
3
bds
|
2
ba
|
0
sqft
|
built
1990
8113 Turtle Dove Dr, Oklahoma City, OK 73132
$-335
Cash flow
-6.5%
Cash-on-Cash Return
4.2%
Cap rate
0.6%
Rent to Value Ratio

Active
$212,000
3
bds
|
2
ba
|
0
sqft
|
built
1983
401 NW 120th St, Oklahoma City, OK 73114
$12
Cash flow
0.3%
Cash-on-Cash Return
5.7%
Cap rate
0.8%
Rent to Value Ratio

Active
$307,000
4
bds
|
3
ba
|
0
sqft
|
built
1970
2416 NW 115th St, Oklahoma City, OK 73120
$-286
Cash flow
-4.9%
Cash-on-Cash Return
4.6%
Cap rate
0.6%
Rent to Value Ratio

Active
$129,900
2
bds
|
1
ba
|
0
sqft
|
built
1929
2144 NW 32nd St, Oklahoma City, OK 73112
$184
Cash flow
7.4%
Cash-on-Cash Return
7.4%
Cap rate
1.0%
Rent to Value Ratio

Active
$205,999
2
bds
|
3
ba
|
0
sqft
|
built
1978
7817 Old Hickory Ln, Oklahoma City, OK 73116
$-254
Cash flow
-6.4%
Cash-on-Cash Return
4.2%
Cap rate
0.8%
Rent to Value Ratio

Active
$285,000
4
bds
|
2
ba
|
0
sqft
|
built
1998
6128 SE 58th St, Oklahoma City, OK 73135
$-151
Cash flow
-2.8%
Cash-on-Cash Return
5.0%
Cap rate
0.7%
Rent to Value Ratio

Active
$100,000
3
bds
|
3
ba
|
0
sqft
|
built
1940
2904 S Indiana Ave, Oklahoma City, OK 73108
$-96
Cash flow
-5.0%
Cash-on-Cash Return
4.5%
Cap rate
0.6%
Rent to Value Ratio

Active
$79,000
3
bds
|
2
ba
|
0
sqft
|
built
1975
2628 N Ann Arbor Ave, Oklahoma City, OK 73127
$8
Cash flow
0.5%
Cash-on-Cash Return
5.8%
Cap rate
1.5%
Rent to Value Ratio

Active
$289,900
2
bds
|
1
ba
|
0
sqft
|
built
1936
5905 NW 50th St, Oklahoma City, OK 73122
$-295
Cash flow
-5.3%
Cash-on-Cash Return
4.5%
Cap rate
0.6%
Rent to Value Ratio
Active
$210,000
5
bds
|
2
ba
|
0
sqft
|
built
1954
813 SW 56th St, Oklahoma City, OK 73109
$-170
Cash flow
-4.2%
Cash-on-Cash Return
4.7%
Cap rate
0.6%
Rent to Value Ratio
Active
$320,000
4
bds
|
4
ba
|
0
sqft
|
built
1938
3157 NW 25th St, Oklahoma City, OK 73107
$-659
Cash flow
-10.7%
Cash-on-Cash Return
3.2%
Cap rate
0.5%
Rent to Value Ratio

Active
$750,000
4
bds
|
4
ba
|
0
sqft
|
built
1968
4901 NW 34th St, Oklahoma City, OK 73122
$-1,801
Cash flow
-12.5%
Cash-on-Cash Return
2.8%
Cap rate
0.5%
Rent to Value Ratio

Active
$905,000
4
bds
|
4
ba
|
0
sqft
|
built
2023
6524 NE 96th Cir, Oklahoma City, OK 73151
$-1,968
Cash flow
-11.3%
Cash-on-Cash Return
3.1%
Cap rate
0.4%
Rent to Value Ratio

Active
$188,000
2
bds
|
1
ba
|
0
sqft
|
built
1954
3029 NW 65th St, Oklahoma City, OK 73116
$-8
Cash flow
-0.2%
Cash-on-Cash Return
5.6%
Cap rate
0.9%
Rent to Value Ratio

Active
$700,000
5
bds
|
5
ba
|
0
sqft
|
built
2024
8924 NW 130th St, Oklahoma City, OK 73142
$-837
Cash flow
-6.2%
Cash-on-Cash Return
4.2%
Cap rate
0.6%
Rent to Value Ratio

Active
$460,000
4
bds
|
3
ba
|
0
sqft
|
built
2005
1501 SW 131st St, Oklahoma City, OK 73170
$-724
Cash flow
-8.2%
Cash-on-Cash Return
3.8%
Cap rate
0.6%
Rent to Value Ratio