Provo, UT Investment Properties for Sale
Browse homes for sale and investment properties in Provo, UT. Refine your search by price, property type, or more.
Best cash flowing properties in Provo, UT

Active
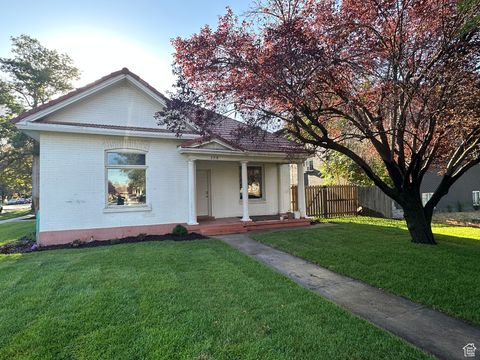
$270,000
3
bds
|
2
ba
|
1,122
sqft
|
built
1980
1633 Woodland Dr, Provo, UT 84604
$-496
Cash flow
-9.6%
Cash-on-Cash Return
3.5%
Cap rate
0.6%
Rent to Value Ratio
Active
$267,000
2
bds
|
1
ba
|
890
sqft
|
built
1985
361 N 300 W, Provo, UT 84601
$-645
Cash flow
-12.6%
Cash-on-Cash Return
2.8%
Cap rate
0.5%
Rent to Value Ratio
79 out of 87 properties for sale in Provo, UT
Limited Results Shown
Create a free account, or log in to reveal all property listings and enjoy the complete experience.
Active
$750,000
4
bds
|
2
ba
|
7,768
sqft
|
built
1884
389 W 500 S, Provo, UT 84601
$-1,616
Cash flow
-11.2%
Cash-on-Cash Return
3.1%
Cap rate
0.5%
Rent to Value Ratio
Active
$689,000
4
bds
|
4
ba
|
3,125
sqft
|
built
2012
1965 N 3050 W, Provo, UT 84601
$-1,635
Cash flow
-12.4%
Cash-on-Cash Return
2.8%
Cap rate
0.4%
Rent to Value Ratio
Active
$435,000
3
bds
|
2
ba
|
1,236
sqft
|
built
1999
932 N 1760 W, Provo, UT 84604
$-1,438
Cash flow
-17.2%
Cash-on-Cash Return
1.7%
Cap rate
0.3%
Rent to Value Ratio
Active
$625,000
3
bds
|
3
ba
|
3,232
sqft
|
built
1995
2295 N 470 E, Provo, UT 84604
$-2,196
Cash flow
-18.3%
Cash-on-Cash Return
1.5%
Cap rate
0.3%
Rent to Value Ratio
Active
$444,900
3
bds
|
3
ba
|
1,550
sqft
|
built
1982
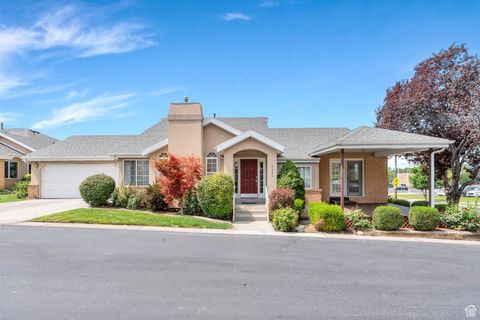
2939 Marrcrest W, Provo, UT 84604
$-1,119
Cash flow
-13.1%
Cash-on-Cash Return
2.7%
Cap rate
0.4%
Rent to Value Ratio
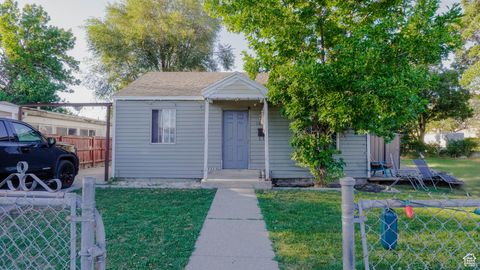
Active
$350,000
2
bds
|
1
ba
|
747
sqft
|
built
1943
1614 W 50 N, Provo, UT 84601
$-946
Cash flow
-14.1%
Cash-on-Cash Return
2.4%
Cap rate
0.3%
Rent to Value Ratio
Active
$739,000
7
bds
|
4
ba
|
3,669
sqft
|
built
2011
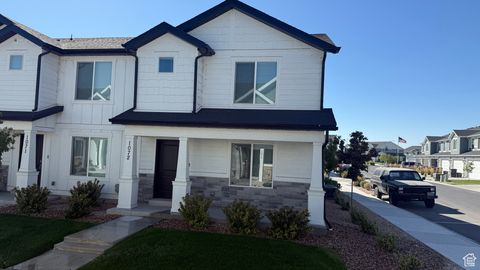
1332 Cinnamon Ridge Way, Provo, UT 84606
$-1,623
Cash flow
-11.5%
Cash-on-Cash Return
3.0%
Cap rate
0.4%
Rent to Value Ratio
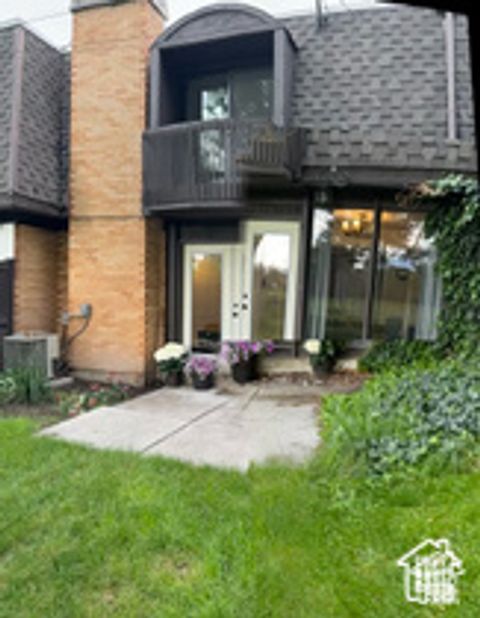
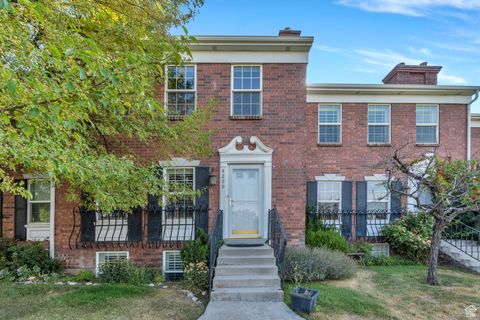
Active
$485,000
3
bds
|
1
ba
|
1,361
sqft
|
built
1900
394 N 300 E, Provo, UT 84606
$-1,238
Cash flow
-13.3%
Cash-on-Cash Return
2.6%
Cap rate
0.4%
Rent to Value Ratio
Active
$620,000
7
bds
|
4
ba
|
2,678
sqft
|
built
2001
526 N 1025 W, Provo, UT 84601
$-1,147
Cash flow
-9.7%
Cash-on-Cash Return
3.5%
Cap rate
0.5%
Rent to Value Ratio
Active
$731,500
6
bds
|
3
ba
|
3,500
sqft
|
built
1973
895 E 2620 N, Provo, UT 84604
$-2,210
Cash flow
-15.8%
Cash-on-Cash Return
2.1%
Cap rate
0.3%
Rent to Value Ratio
Active
$619,900
5
bds
|
3
ba
|
2,436
sqft
|
built
1969
3985 N 850 E, Provo, UT 84604
$-2,139
Cash flow
-18.0%
Cash-on-Cash Return
1.5%
Cap rate
0.2%
Rent to Value Ratio
Active
$414,900
3
bds
|
2
ba
|
1,399
sqft
|
built
2023
661 W 1920 S, Provo, UT 84601
$-850
Cash flow
-10.7%
Cash-on-Cash Return
3.2%
Cap rate
0.5%
Rent to Value Ratio
Active
$1,950,000
7
bds
|
6
ba
|
6,245
sqft
|
built
2023
1662 N 2250 W, Provo, UT 84604
$-4,649
Cash flow
-12.4%
Cash-on-Cash Return
2.8%
Cap rate
0.4%
Rent to Value Ratio
Active
$545,000
5
bds
|
2
ba
|
2,204
sqft
|
built
1978
655 W 1280 S, Provo, UT 84601
$-1,391
Cash flow
-13.3%
Cash-on-Cash Return
2.6%
Cap rate
0.4%
Rent to Value Ratio
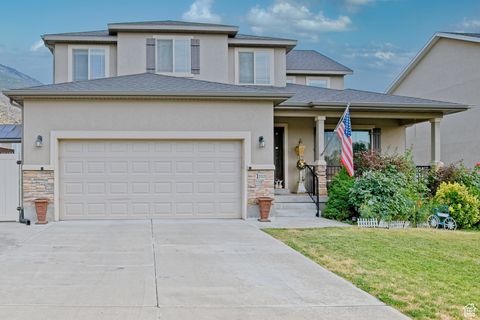
Active
$559,000
4
bds
|
3
ba
|
2,129
sqft
|
built
1997
154 N 2560 W, Provo, UT 84601
$-1,337
Cash flow
-12.5%
Cash-on-Cash Return
2.8%
Cap rate
0.4%
Rent to Value Ratio
Active
$1,099,000
7
bds
|
3
ba
|
4,334
sqft
|
built
1962
3129 Cherokee Ln, Provo, UT 84604
$-2,477
Cash flow
-11.8%
Cash-on-Cash Return
3.0%
Cap rate
0.4%
Rent to Value Ratio
Active
$1,175,000
5
bds
|
5
ba
|
5,574
sqft
|
built
1997
3936 Foothill Dr, Provo, UT 84604
$-3,845
Cash flow
-17.1%
Cash-on-Cash Return
1.8%
Cap rate
0.3%
Rent to Value Ratio
Active
$1,199,500
7
bds
|
4
ba
|
4,182
sqft
|
built
2019
3702 N 920 E, Provo, UT 84604
$-3,833
Cash flow
-16.7%
Cash-on-Cash Return
1.8%
Cap rate
0.3%
Rent to Value Ratio
Active
$364,900
3
bds
|
2
ba
|
1,242
sqft
|
built
2003
1068 Canyon Meadow Dr, Provo, UT 84606
$-1,012
Cash flow
-14.5%
Cash-on-Cash Return
2.4%
Cap rate
0.4%
Rent to Value Ratio
Active
$995,000
6
bds
|
6
ba
|
3,644
sqft
|
built
1899
319 E 100 N, Provo, UT 84606
$-3,453
Cash flow
-18.1%
Cash-on-Cash Return
1.5%
Cap rate
0.2%
Rent to Value Ratio
Active
$550,000
5
bds
|
3
ba
|
2,502
sqft
|
built
1986
4299 Ivy Ln, Provo, UT 84604
$-1,831
Cash flow
-17.4%
Cash-on-Cash Return
1.7%
Cap rate
0.4%
Rent to Value Ratio
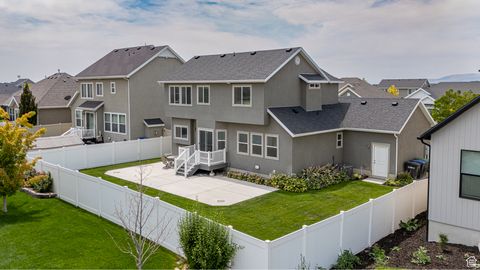
Active
$674,900
3
bds
|
3
ba
|
2,891
sqft
|
built
2017
1418 N 3250 W, Provo, UT 84601
$-1,989
Cash flow
-15.4%
Cash-on-Cash Return
2.1%
Cap rate
0.3%
Rent to Value Ratio
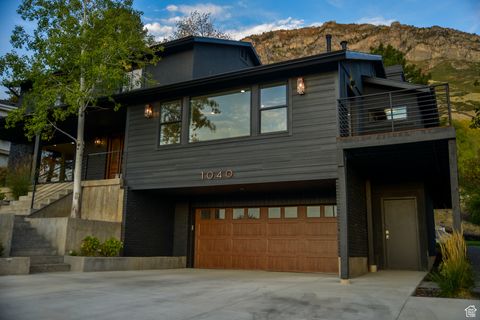
Active
$1,449,900
6
bds
|
5
ba
|
3,935
sqft
|
built
1979
1040 Oakmont Ln, Provo, UT 84604
$-3,732
Cash flow
-13.4%
Cash-on-Cash Return
2.6%
Cap rate
0.3%
Rent to Value Ratio
Active
$565,000
4
bds
|
3
ba
|
2,092
sqft
|
built
2001
1911 S Oregon Ave, Provo, UT 84606
$-1,502
Cash flow
-13.9%
Cash-on-Cash Return
2.5%
Cap rate
0.4%
Rent to Value Ratio
Active
$1,500,000
5
bds
|
4
ba
|
5,962
sqft
|
built
1980
4365 Bedford Dr, Provo, UT 84604
$-5,473
Cash flow
-19.0%
Cash-on-Cash Return
1.3%
Cap rate
0.2%
Rent to Value Ratio
Active
$559,900
5
bds
|
2
ba
|
2,136
sqft
|
built
1980
2727 W 220 N, Provo, UT 84601
$-1,327
Cash flow
-12.4%
Cash-on-Cash Return
2.8%
Cap rate
0.4%
Rent to Value Ratio
Active
$399,900
3
bds
|
3
ba
|
2,140
sqft
|
built
2014
2043 W 1100 N, Provo, UT 84604
$-1,149
Cash flow
-15.0%
Cash-on-Cash Return
2.2%
Cap rate
0.5%
Rent to Value Ratio
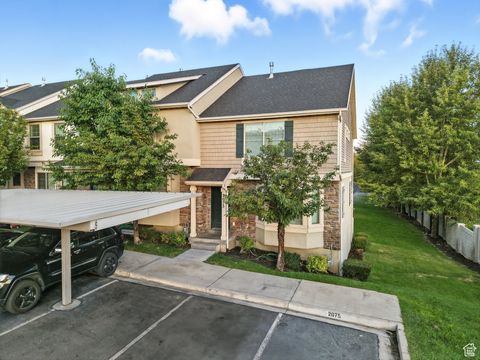
Active
$399,900
3
bds
|
3
ba
|
2,140
sqft
|
built
2013
2075 W 1080 N, Provo, UT 84604
$-1,218
Cash flow
-15.9%
Cash-on-Cash Return
2.0%
Cap rate
0.4%
Rent to Value Ratio

Active
$1,624,000
6
bds
|
8
ba
|
5,300
sqft
|
built
1983
664 E 2320 N, Provo, UT 84604
$-5,573
Cash flow
-17.9%
Cash-on-Cash Return
1.6%
Cap rate
0.2%
Rent to Value Ratio
Active
$500,000
3
bds
|
2
ba
|
1,352
sqft
|
built
1900
614 W 400 N, Provo, UT 84601
$-1,270
Cash flow
-13.3%
Cash-on-Cash Return
2.6%
Cap rate
0.4%
Rent to Value Ratio
Active
$2,250,000
5
bds
|
4
ba
|
6,152
sqft
|
built
2022
1679 N 2250 W, Provo, UT 84604
$-8,626
Cash flow
-20.0%
Cash-on-Cash Return
1.1%
Cap rate
0.2%
Rent to Value Ratio

Active
$2,300,000
7
bds
|
6
ba
|
6,777
sqft
|
built
2022
1682 N 2250 W, Provo, UT 84604
$-7,137
Cash flow
-16.2%
Cash-on-Cash Return
2.0%
Cap rate
0.3%
Rent to Value Ratio
Active
$620,000
6
bds
|
3
ba
|
3,752
sqft
|
built
1982
1188 W 1380 N, Provo, UT 84604
$-1,265
Cash flow
-10.6%
Cash-on-Cash Return
3.2%
Cap rate
0.5%
Rent to Value Ratio

Active
$305,000
3
bds
|
2
ba
|
1,120
sqft
|
built
1980
1763 Willowbrook Dr, Provo, UT 84604
$-800
Cash flow
-13.7%
Cash-on-Cash Return
2.5%
Cap rate
0.5%
Rent to Value Ratio
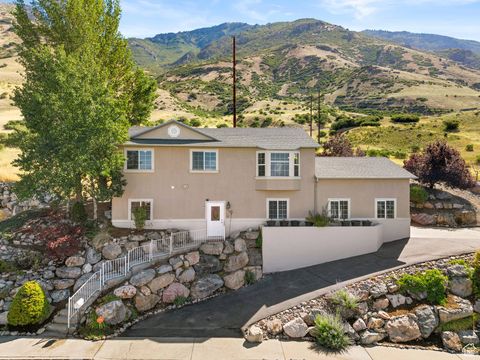
Active
$825,000
5
bds
|
3
ba
|
5,121
sqft
|
built
1972
3006 Indian Hills Dr, Provo, UT 84604
$-2,336
Cash flow
-14.8%
Cash-on-Cash Return
2.3%
Cap rate
0.3%
Rent to Value Ratio
Active
$412,500
2
bds
|
1
ba
|
1,267
sqft
|
built
1899
144 E 200 S, Provo, UT 84606
$-1,009
Cash flow
-12.8%
Cash-on-Cash Return
2.7%
Cap rate
0.4%
Rent to Value Ratio
Active
$1,295,000
4
bds
|
4
ba
|
3,810
sqft
|
built
1996
3535 N 160 W, Provo, UT 84604
$-4,402
Cash flow
-17.7%
Cash-on-Cash Return
1.6%
Cap rate
0.2%
Rent to Value Ratio

Active
$645,000
4
bds
|
2
ba
|
1,740
sqft
|
built
1949
920 W Columbia Ln, Provo, UT 84604
$-1,318
Cash flow
-10.7%
Cash-on-Cash Return
3.2%
Cap rate
0.4%
Rent to Value Ratio