San Antonio, TX Investment Properties for Sale
Browse homes for sale and investment properties in San Antonio, TX. Refine your search by price, property type, or more.
Best cash flowing properties in San Antonio, TX
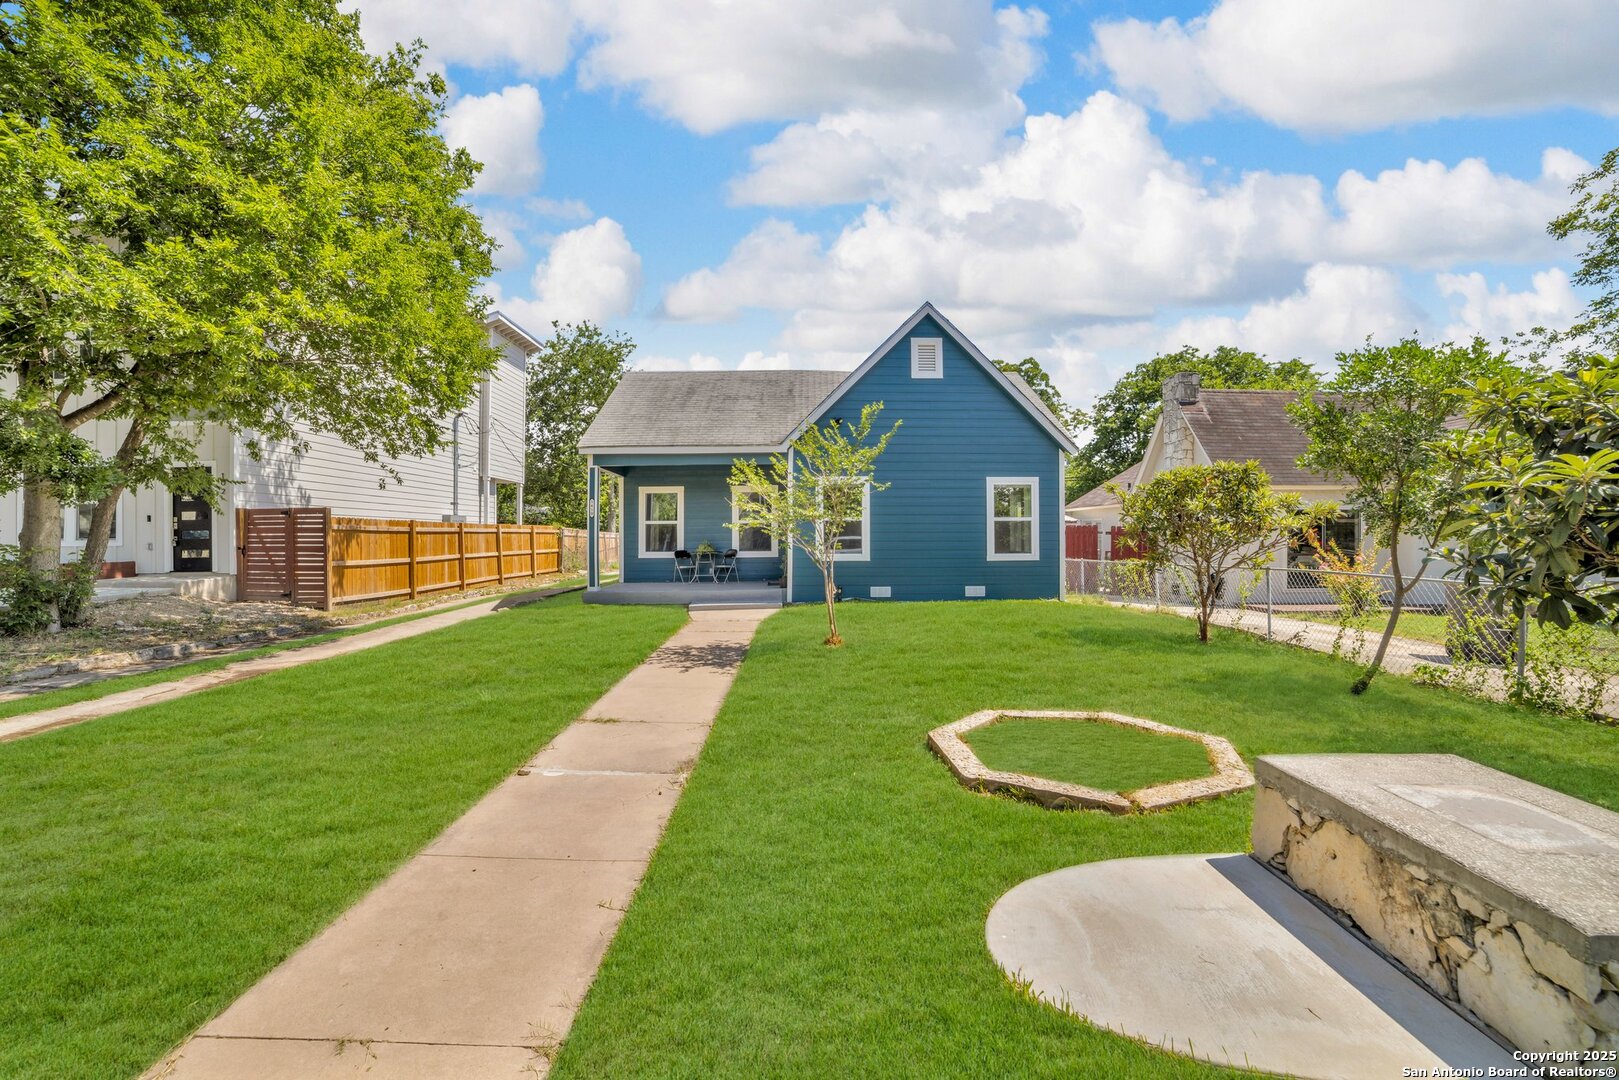
Active
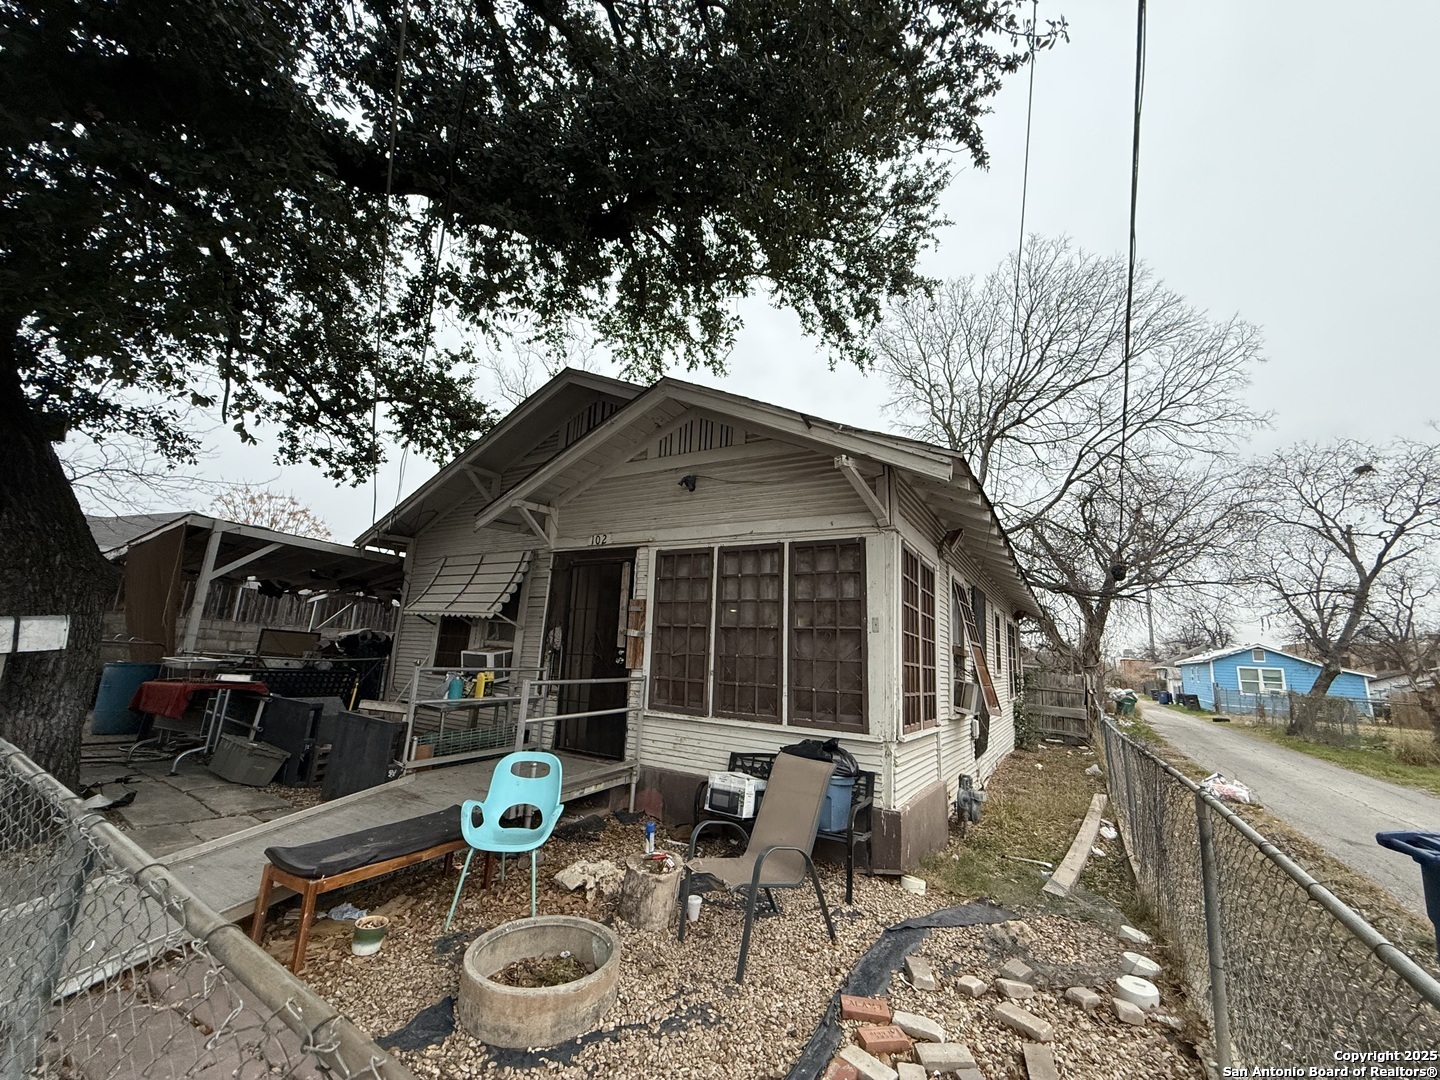
$85,000
3
bds
|
1
ba
|
984
sqft
|
built
1940
102 S Rosillo, San Antonio, TX 78207
$210
Cash flow
12.9%
Cash-on-Cash Return
8.6%
Cap rate
1.4%
Rent to Value Ratio
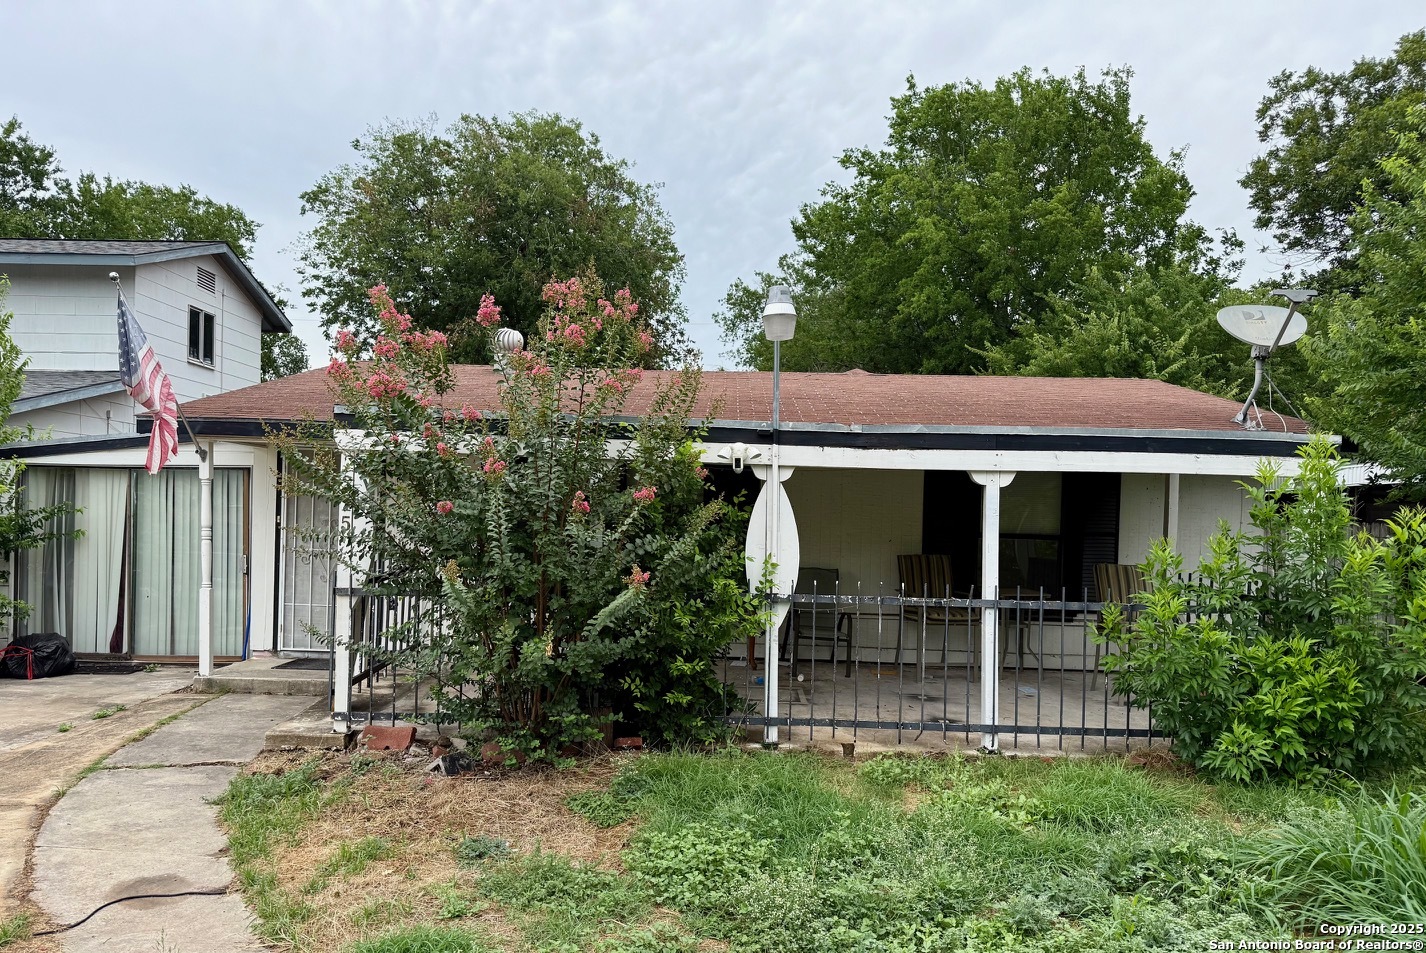
Active
$130,000
3
bds
|
2
ba
|
1,803
sqft
|
built
1953
215 W Academy St, San Antonio, TX 78226
$160
Cash flow
6.4%
Cash-on-Cash Return
7.2%
Cap rate
1.2%
Rent to Value Ratio
5,751 out of 6,031 properties for sale in San Antonio, TX
Limited Results Shown
Create a free account, or log in to reveal all property listings and enjoy the complete experience.
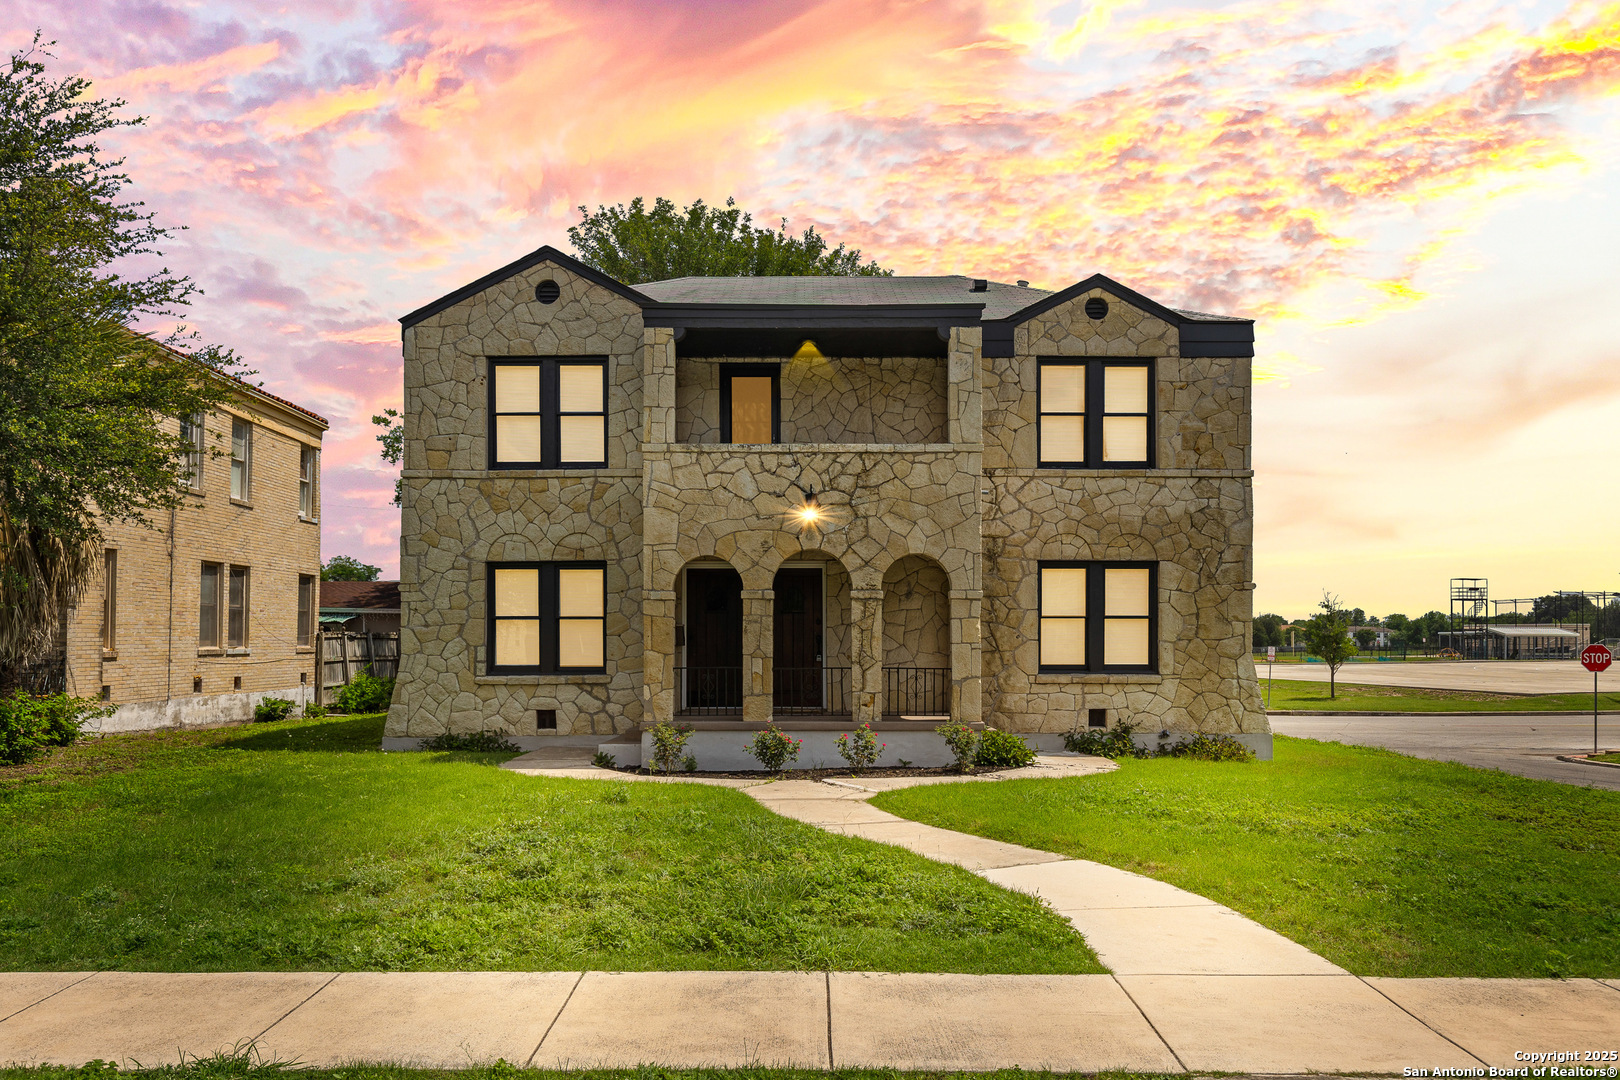
Active
$599,000
5
bds
|
4
ba
|
2,622
sqft
|
built
1936
424 Club Dr, San Antonio, TX 78201
$-2,475
Cash flow
-21.6%
Cash-on-Cash Return
0.7%
Cap rate
0.2%
Rent to Value Ratio
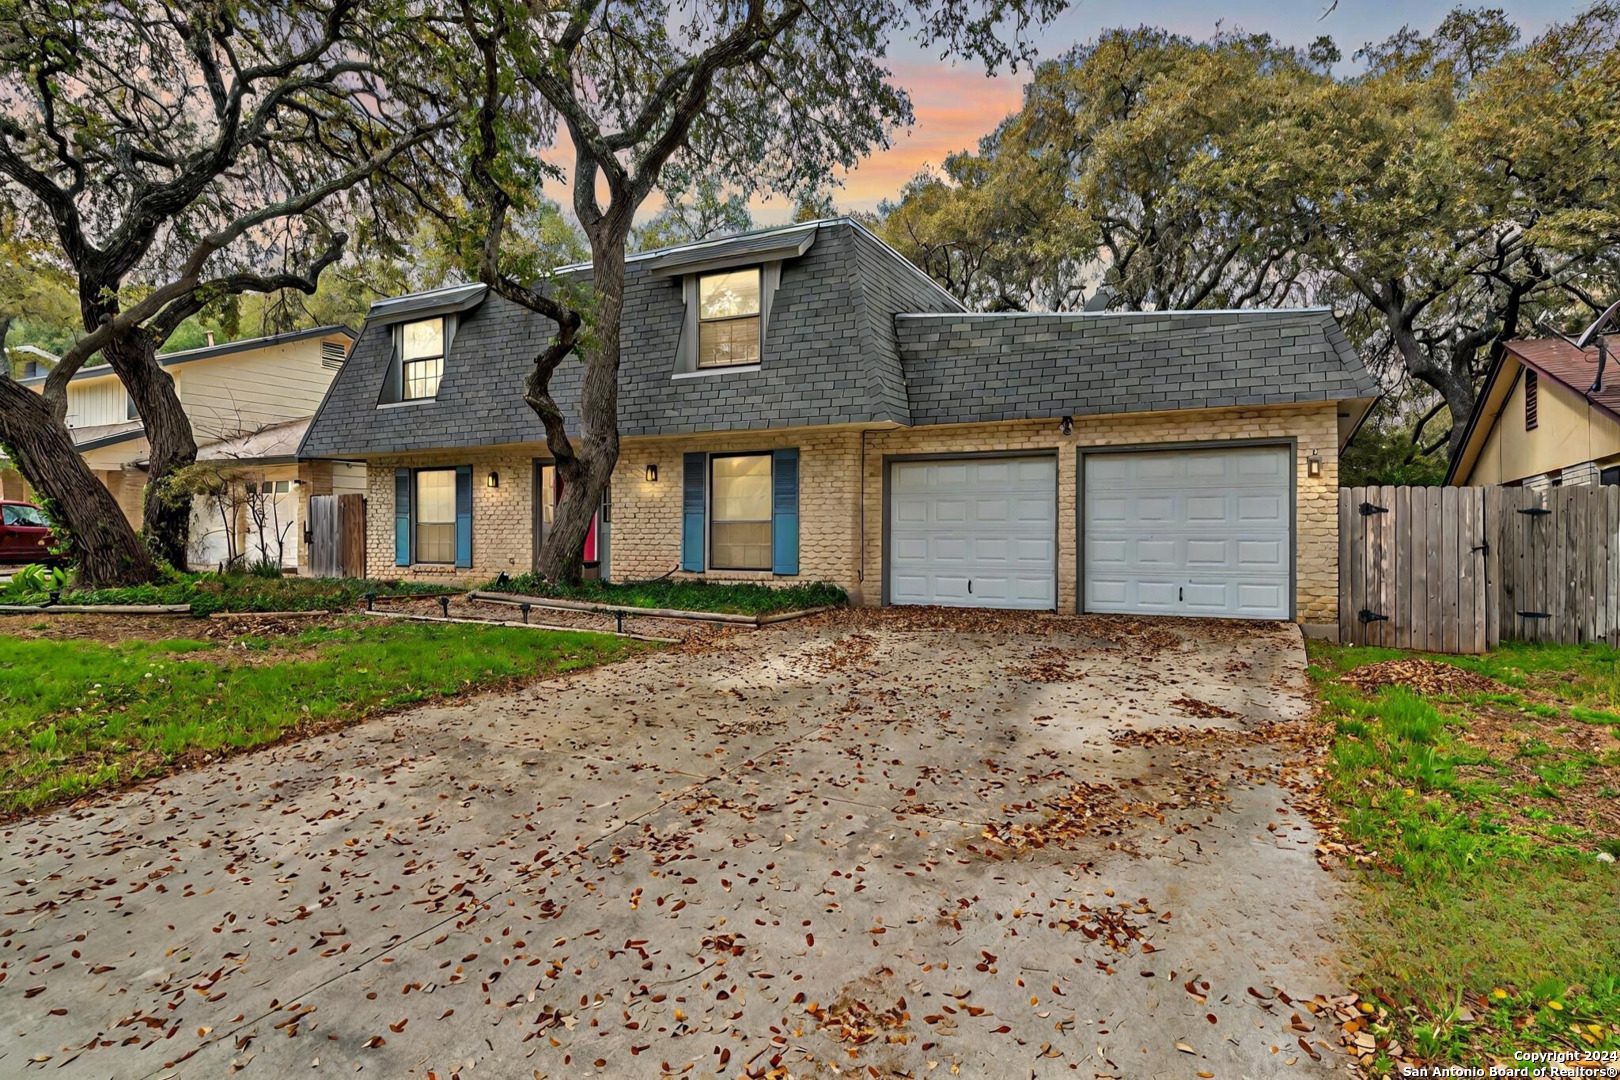
Active
$263,000
3
bds
|
3
ba
|
1,617
sqft
|
built
1976
8831 Brigadoon St, San Antonio, TX 78254
$-52,086
Cash flow
-1033.3%
Cash-on-Cash Return
-232.0%
Cap rate
0.7%
Rent to Value Ratio
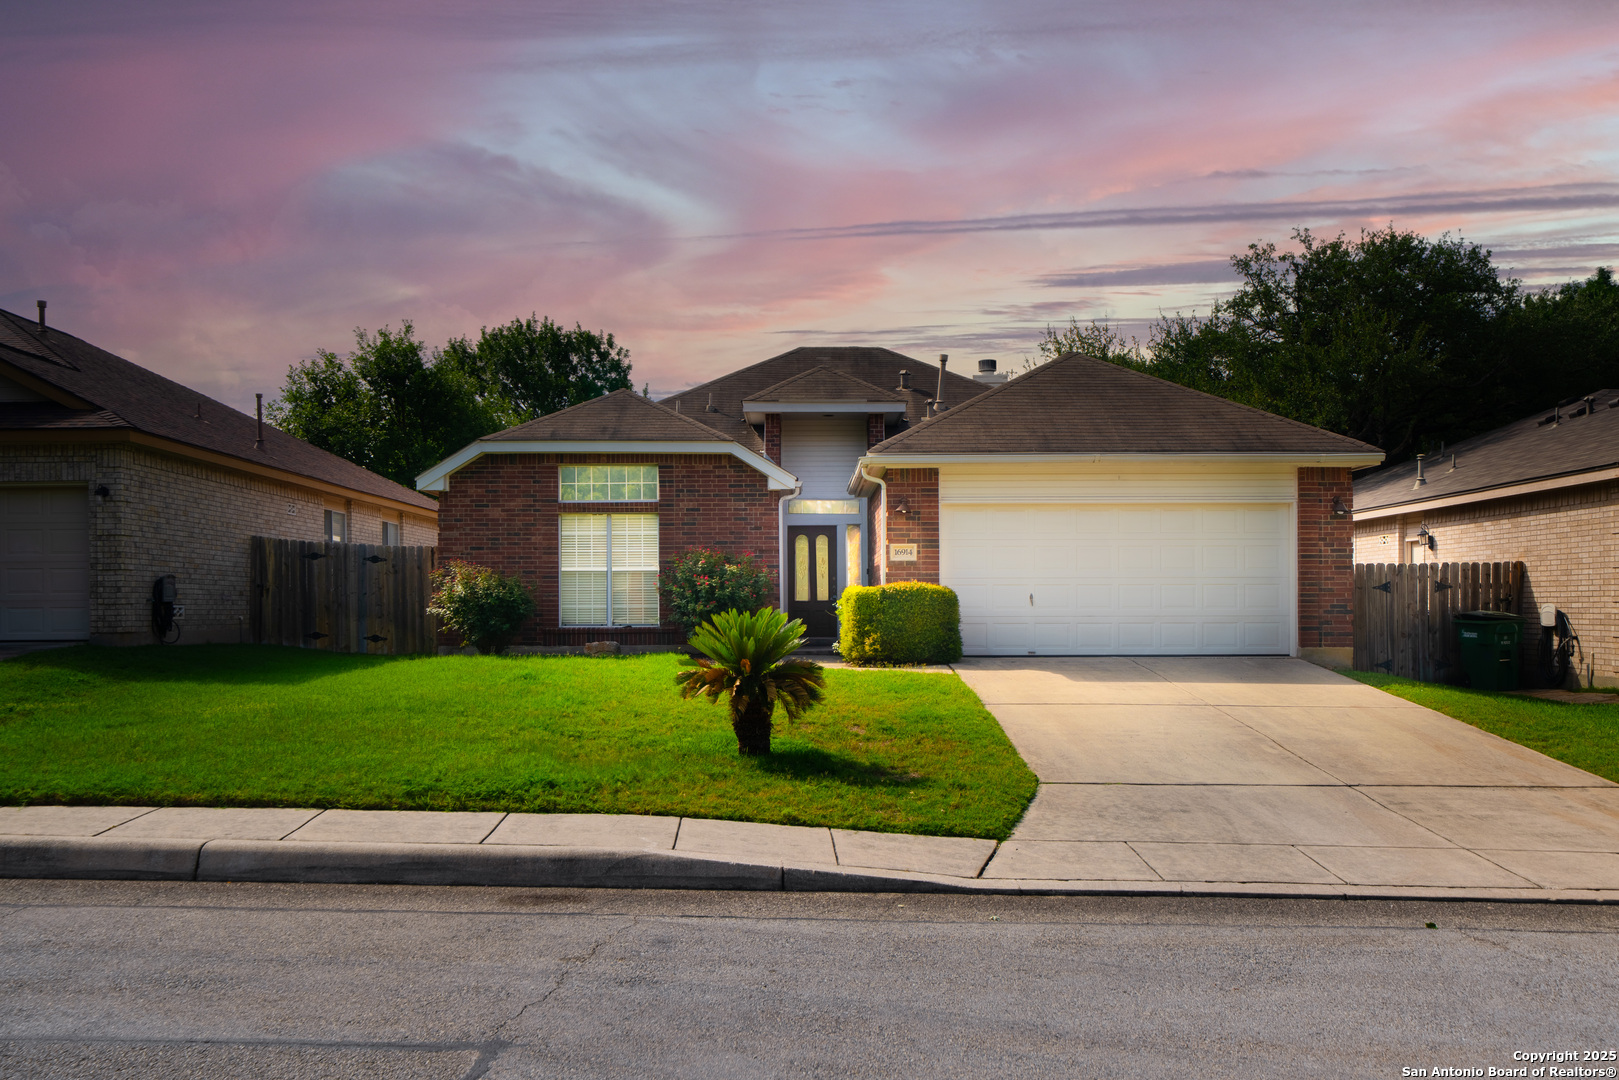
Active
$329,900
3
bds
|
2
ba
|
1,828
sqft
|
built
1999
16914 Redhorse Pass, San Antonio, TX 78247
$-823
Cash flow
-13.0%
Cash-on-Cash Return
2.7%
Cap rate
0.6%
Rent to Value Ratio
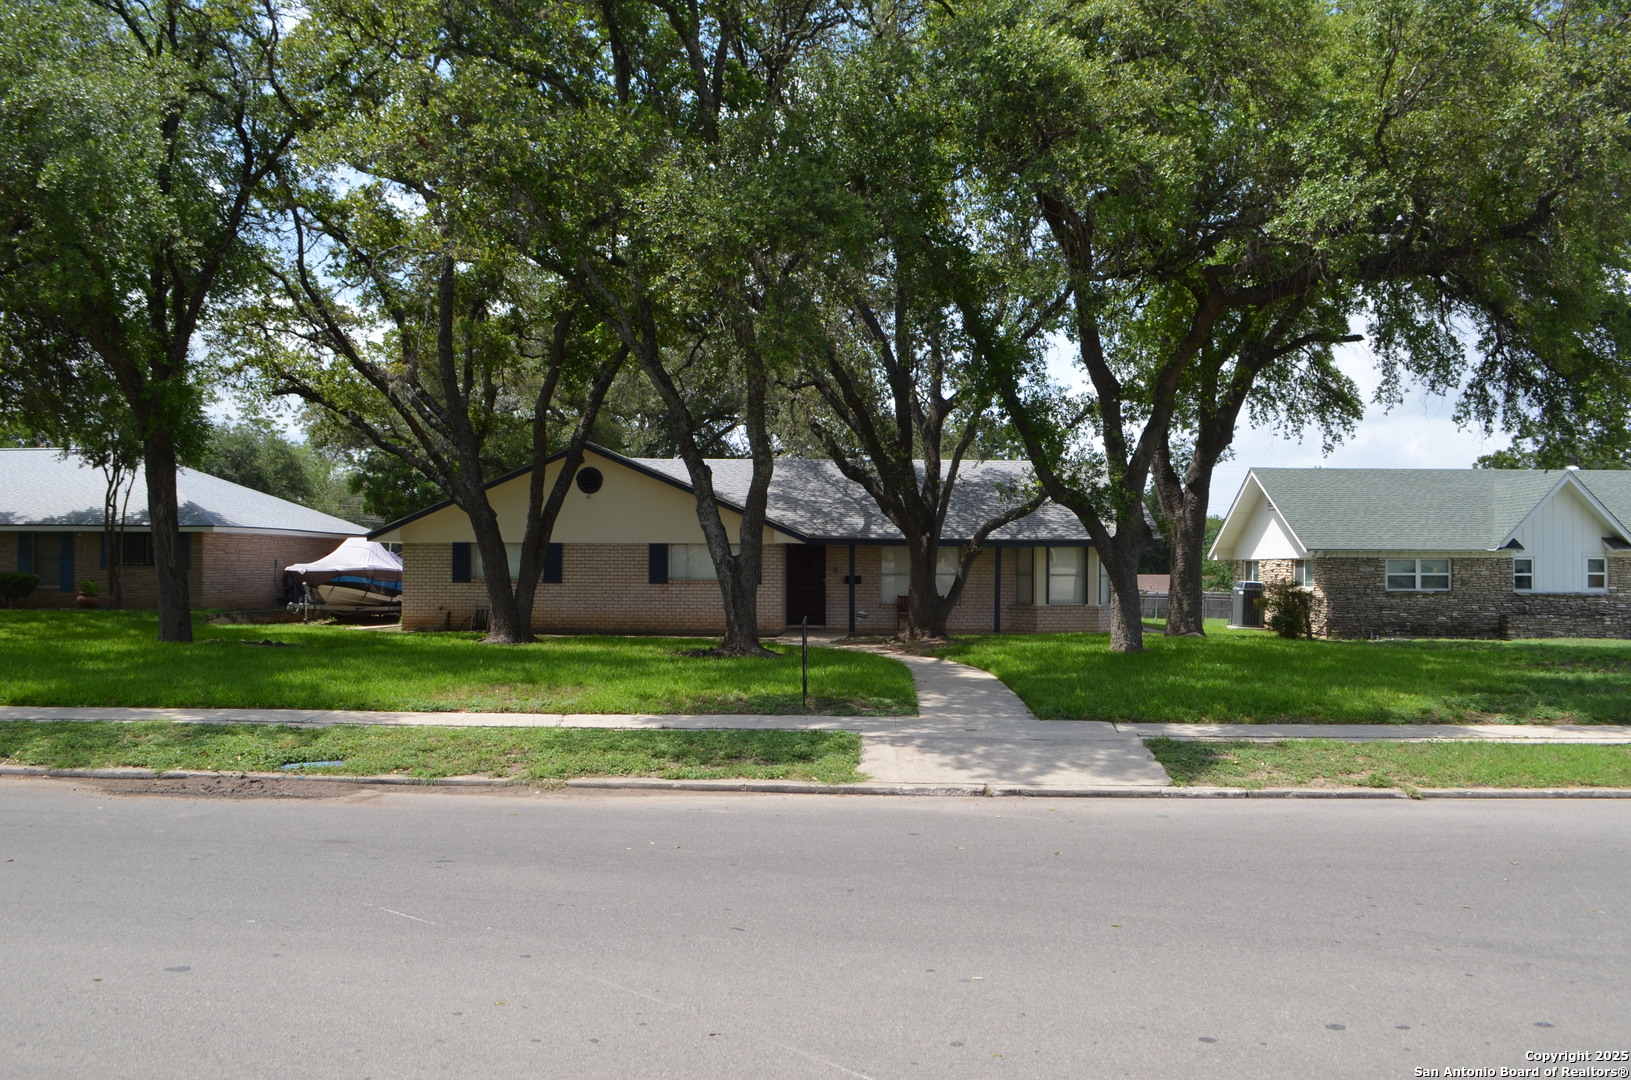
Active
$429,000
4
bds
|
3
ba
|
2,260
sqft
|
built
1961
154 Sprucewood Ln, San Antonio, TX 78216
$-1,066
Cash flow
-13.0%
Cash-on-Cash Return
2.7%
Cap rate
0.6%
Rent to Value Ratio
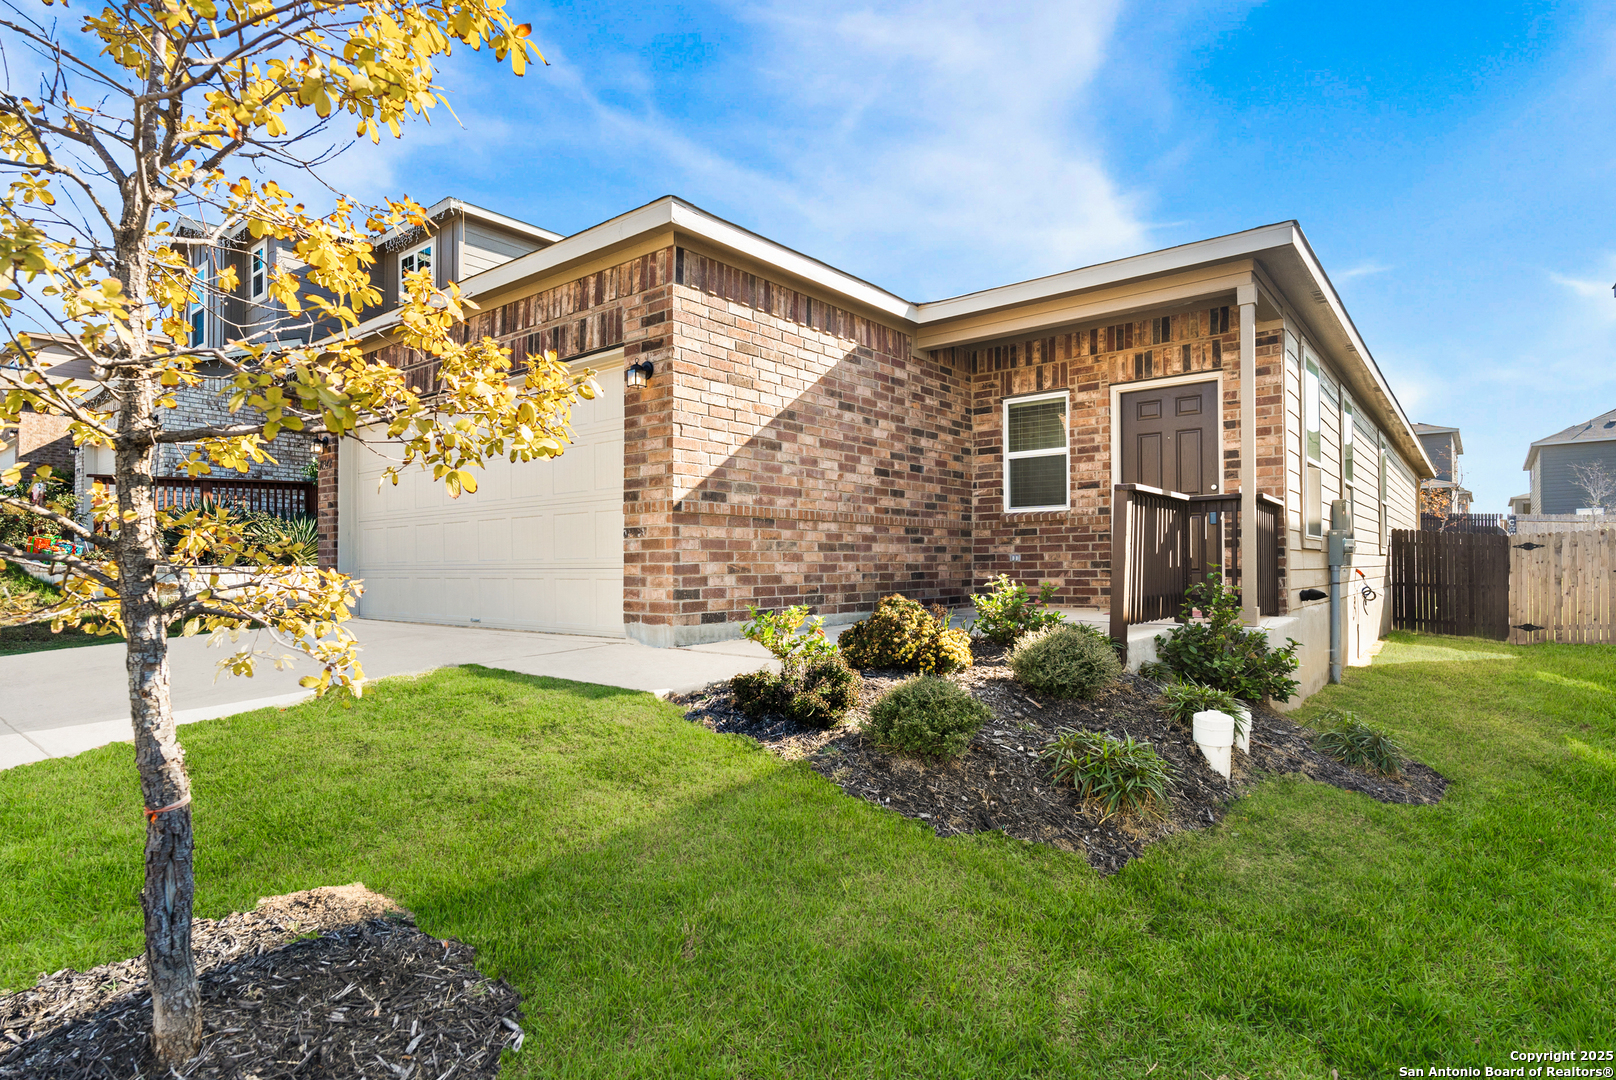
Active
$238,500
3
bds
|
2
ba
|
1,510
sqft
|
built
2021
10342 Gibbons Crk, San Antonio, TX 78252
$-477
Cash flow
-10.4%
Cash-on-Cash Return
3.3%
Cap rate
0.8%
Rent to Value Ratio
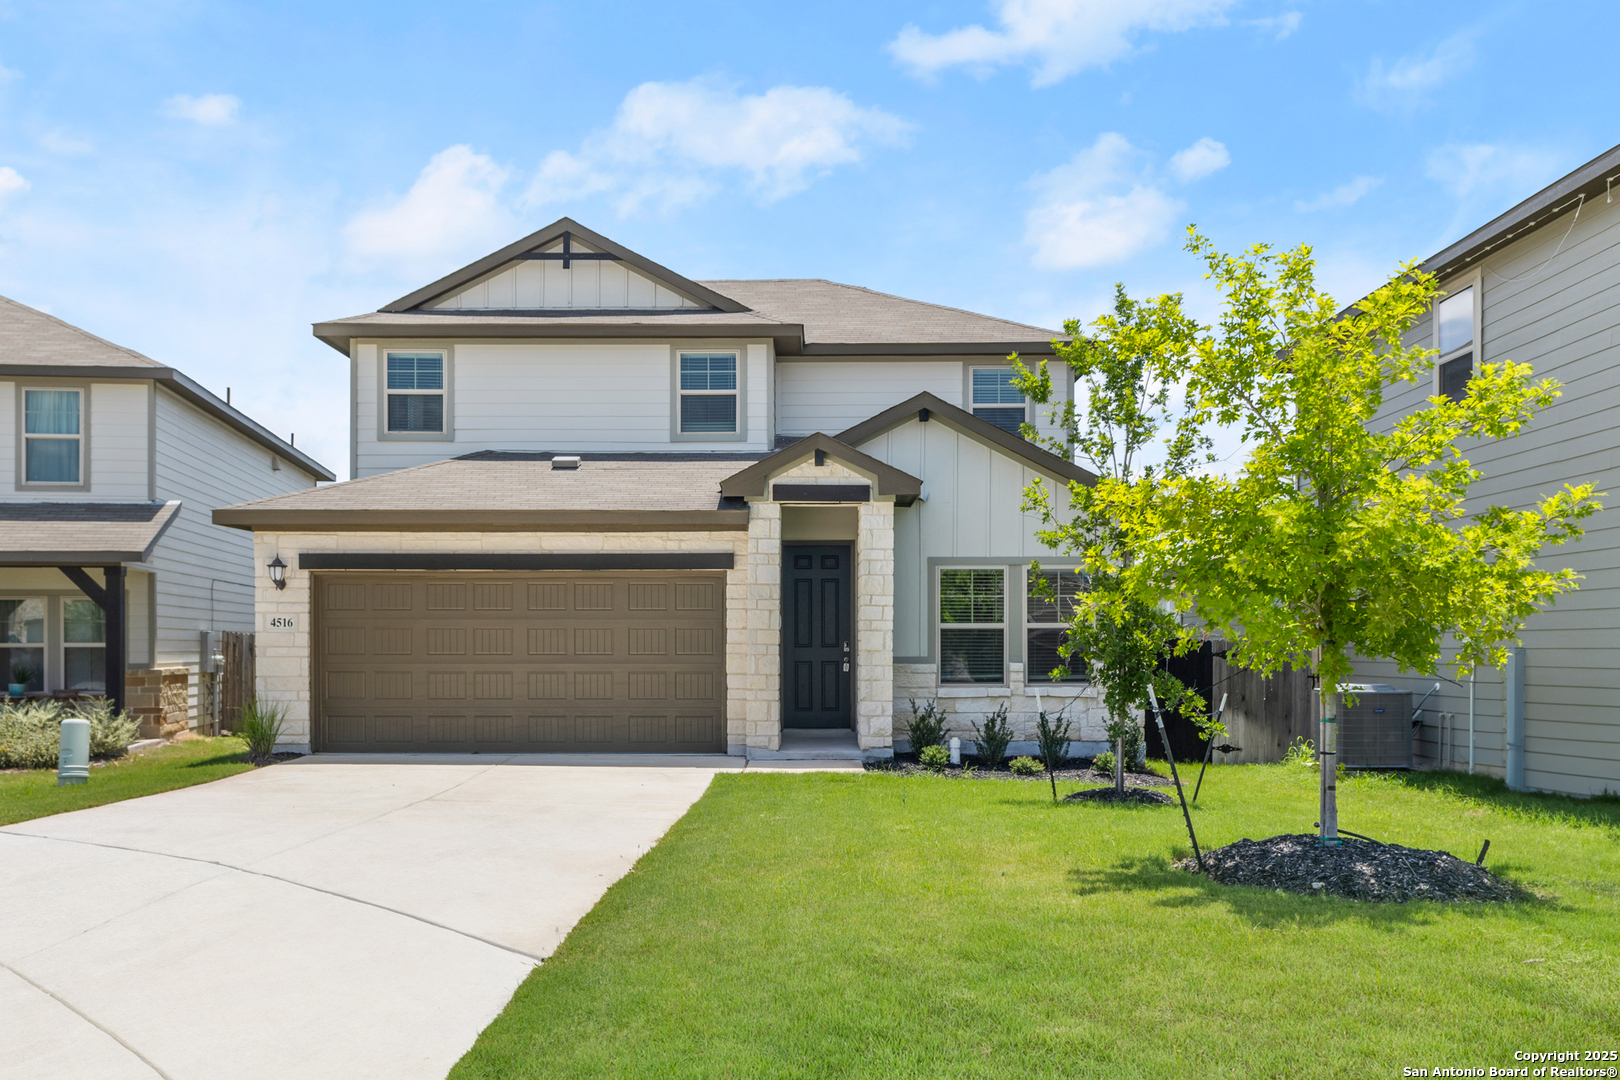
Active
$334,990
4
bds
|
3
ba
|
2,333
sqft
|
built
2022
4516 Appaloosa Crst, San Antonio, TX 78245
$-575
Cash flow
-9.0%
Cash-on-Cash Return
3.6%
Cap rate
0.7%
Rent to Value Ratio
Active
$909,000
4
bds
|
5
ba
|
3,529
sqft
|
built
2017
3634 Belle Strait, San Antonio, TX 78257
$-2,449
Cash flow
-14.1%
Cash-on-Cash Return
2.4%
Cap rate
0.6%
Rent to Value Ratio
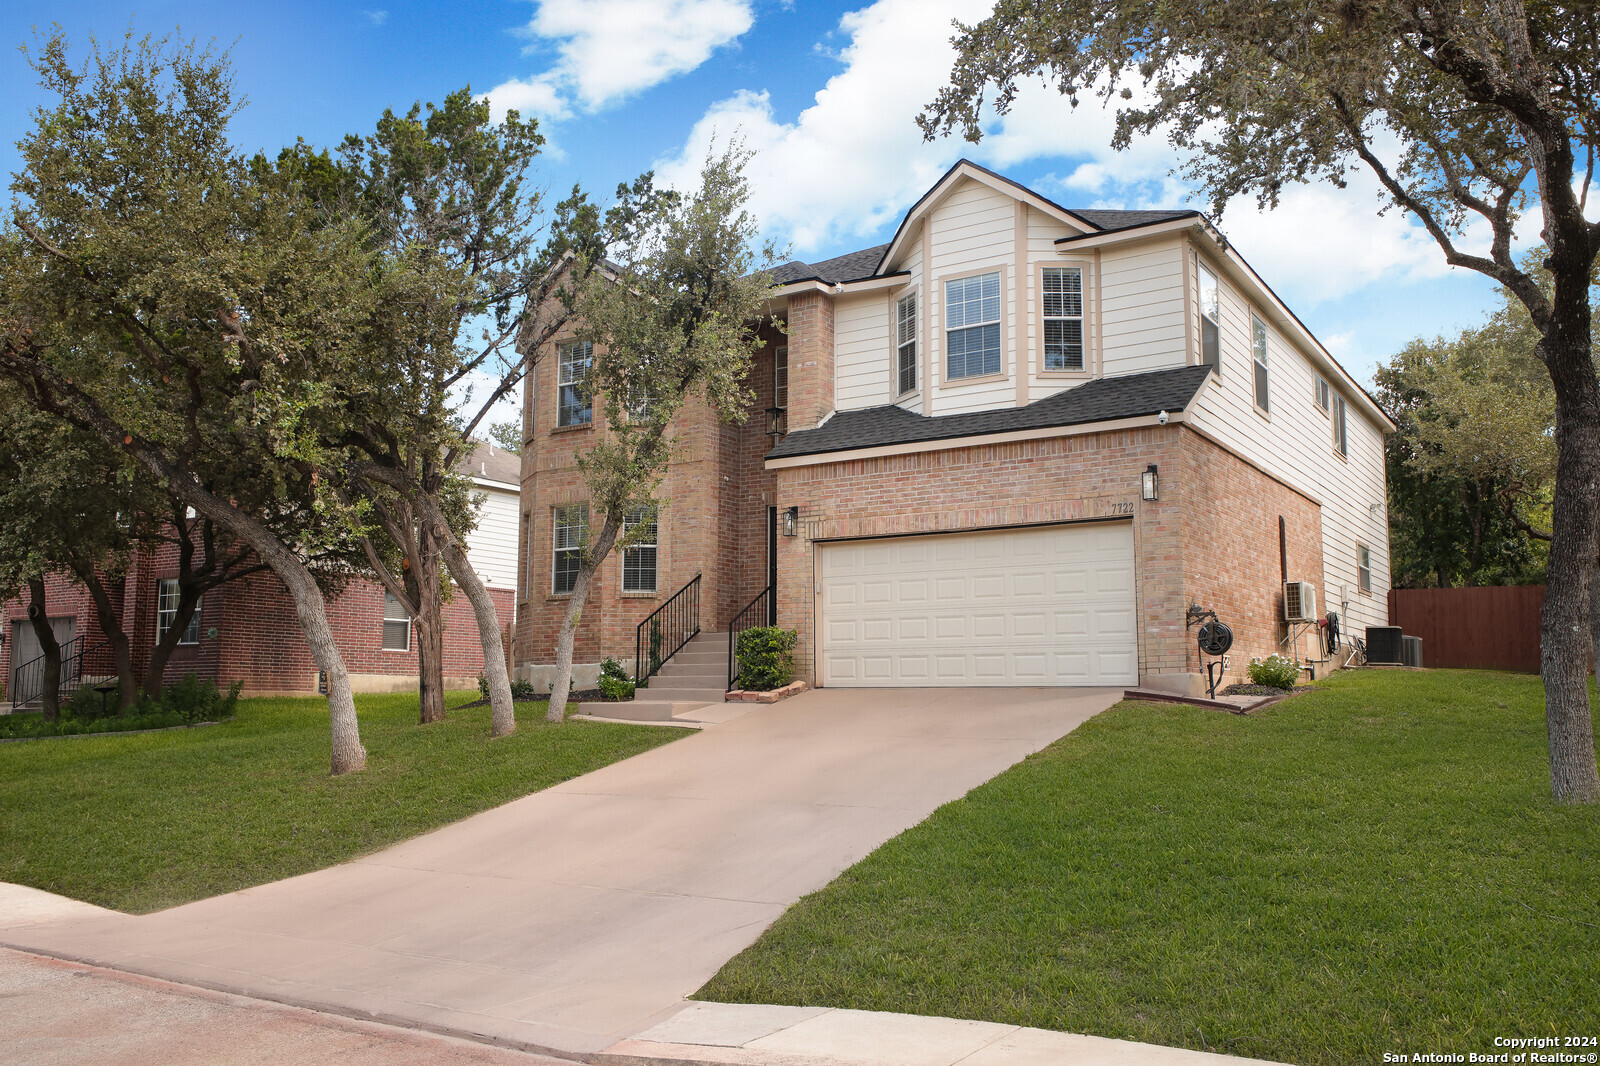
Active
$510,000
5
bds
|
4
ba
|
3,406
sqft
|
built
2000
7722 Braun Bnd, San Antonio, TX 78250
$-1,151
Cash flow
-11.8%
Cash-on-Cash Return
3.0%
Cap rate
0.6%
Rent to Value Ratio
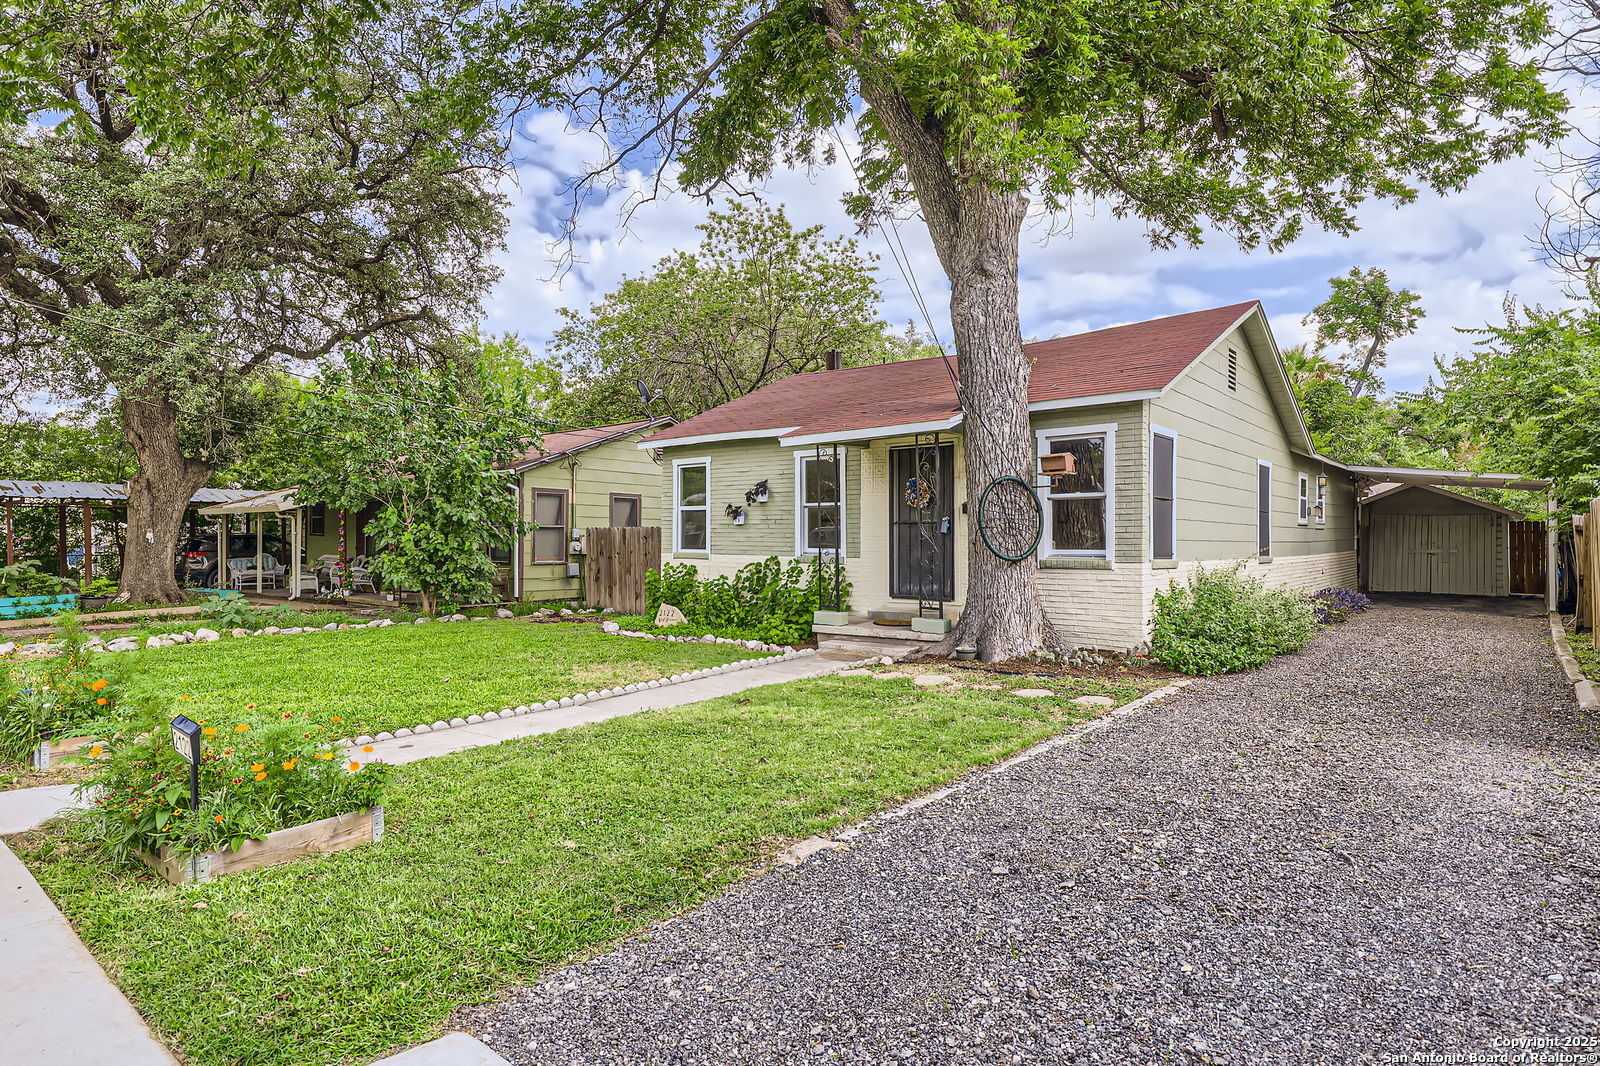
Pending
$200,000
3
bds
|
2
ba
|
1,262
sqft
|
built
1946
2122 W Hermosa Dr, San Antonio, TX 78201
$-384
Cash flow
-10.0%
Cash-on-Cash Return
3.4%
Cap rate
0.7%
Rent to Value Ratio
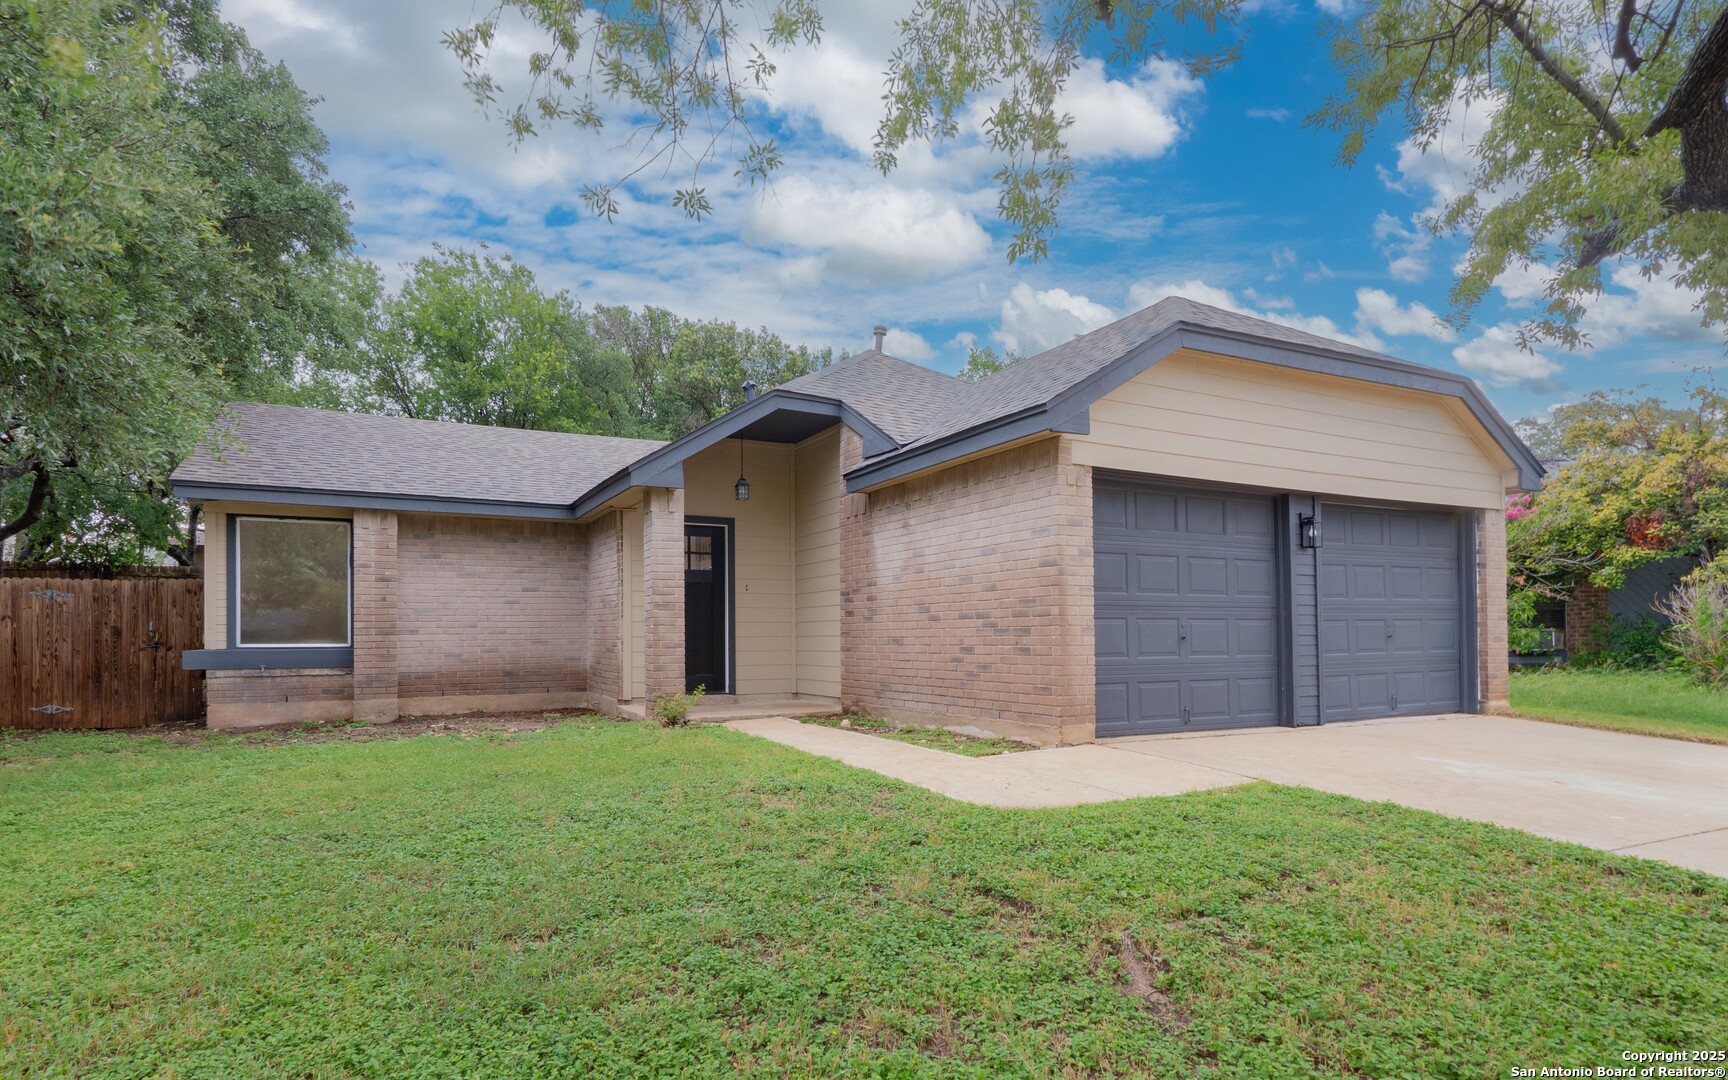
Active
$325,000
3
bds
|
2
ba
|
1,455
sqft
|
built
1984
9511 Deerbrook, San Antonio, TX 78250
$-1,085
Cash flow
-17.4%
Cash-on-Cash Return
1.7%
Cap rate
0.4%
Rent to Value Ratio
Active
$1,999,000
5
bds
|
5
ba
|
3,911
sqft
|
built
2024
6 Turin Ct, San Antonio, TX 78257
$-6,548
Cash flow
-17.1%
Cash-on-Cash Return
1.7%
Cap rate
0.4%
Rent to Value Ratio
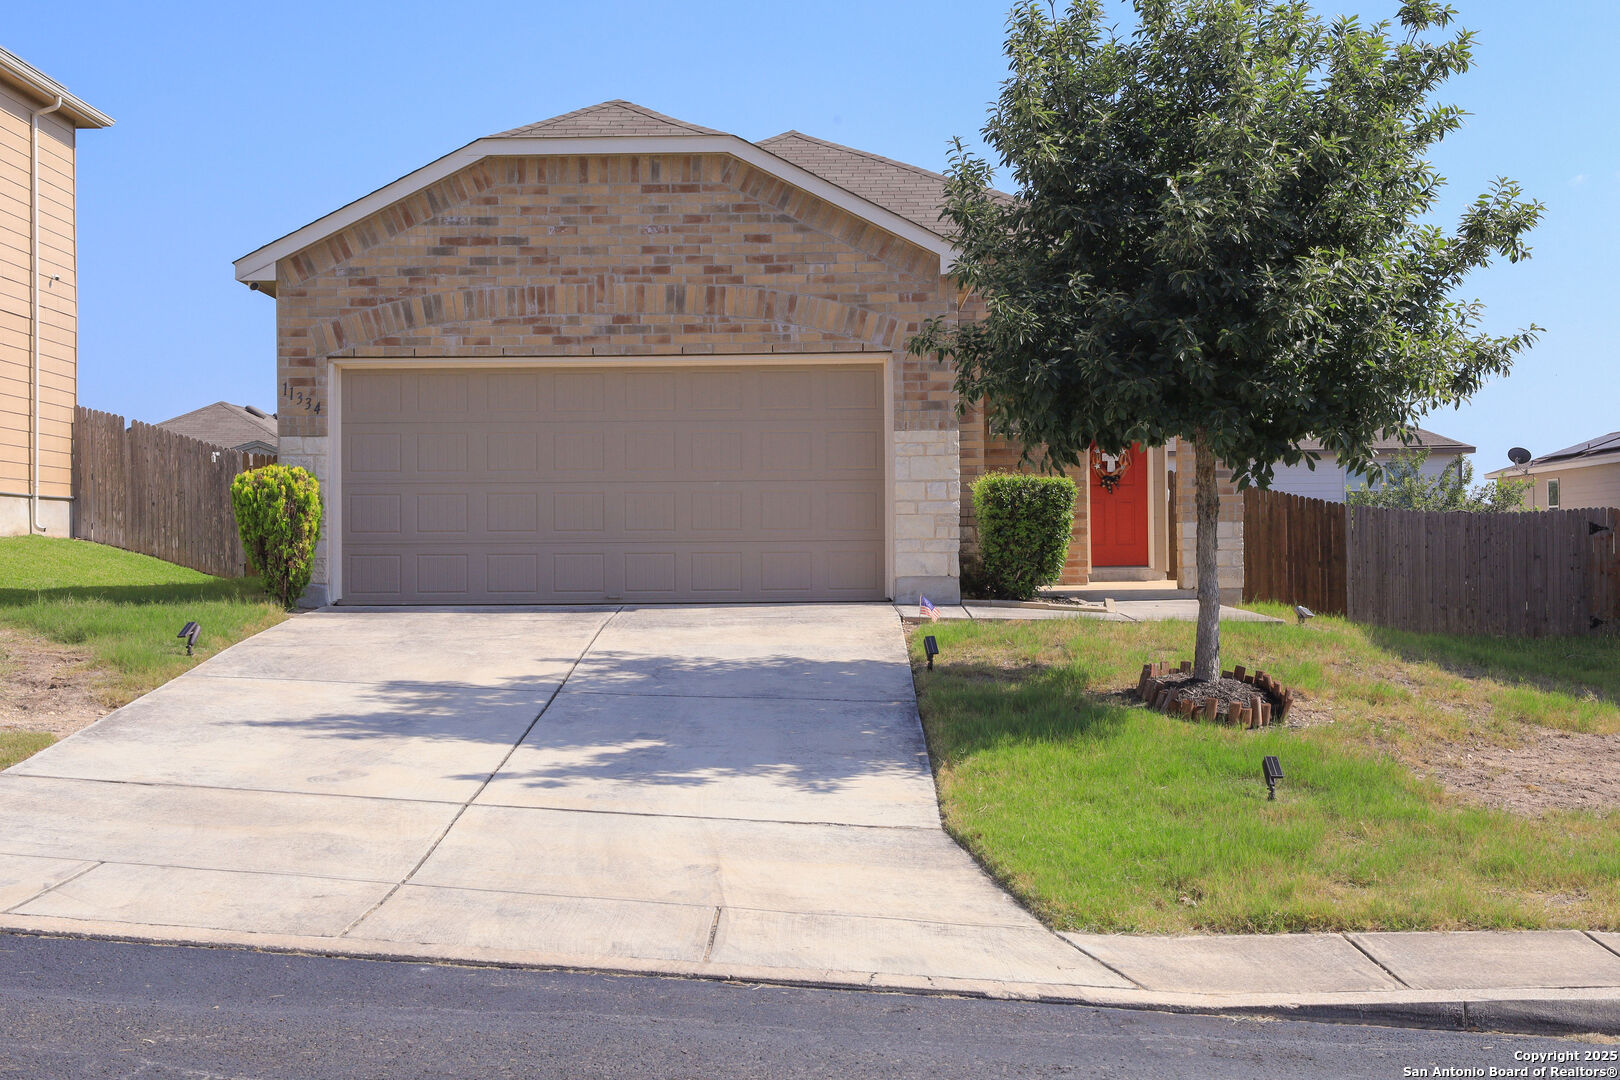
Active
$242,500
3
bds
|
2
ba
|
1,226
sqft
|
built
2015
11334 Pink Star, San Antonio, TX 78245
$-361
Cash flow
-7.8%
Cash-on-Cash Return
3.9%
Cap rate
0.7%
Rent to Value Ratio
Active
$209,000
3
bds
|
2
ba
|
1,155
sqft
|
built
2001
335 Silver Bit, San Antonio, TX 78227
$-254
Cash flow
-6.3%
Cash-on-Cash Return
4.2%
Cap rate
0.8%
Rent to Value Ratio
Active
$215,000
3
bds
|
2
ba
|
1,328
sqft
|
built
1940
1410 Hicks Ave, San Antonio, TX 78210
$-252
Cash flow
-6.1%
Cash-on-Cash Return
4.3%
Cap rate
0.8%
Rent to Value Ratio
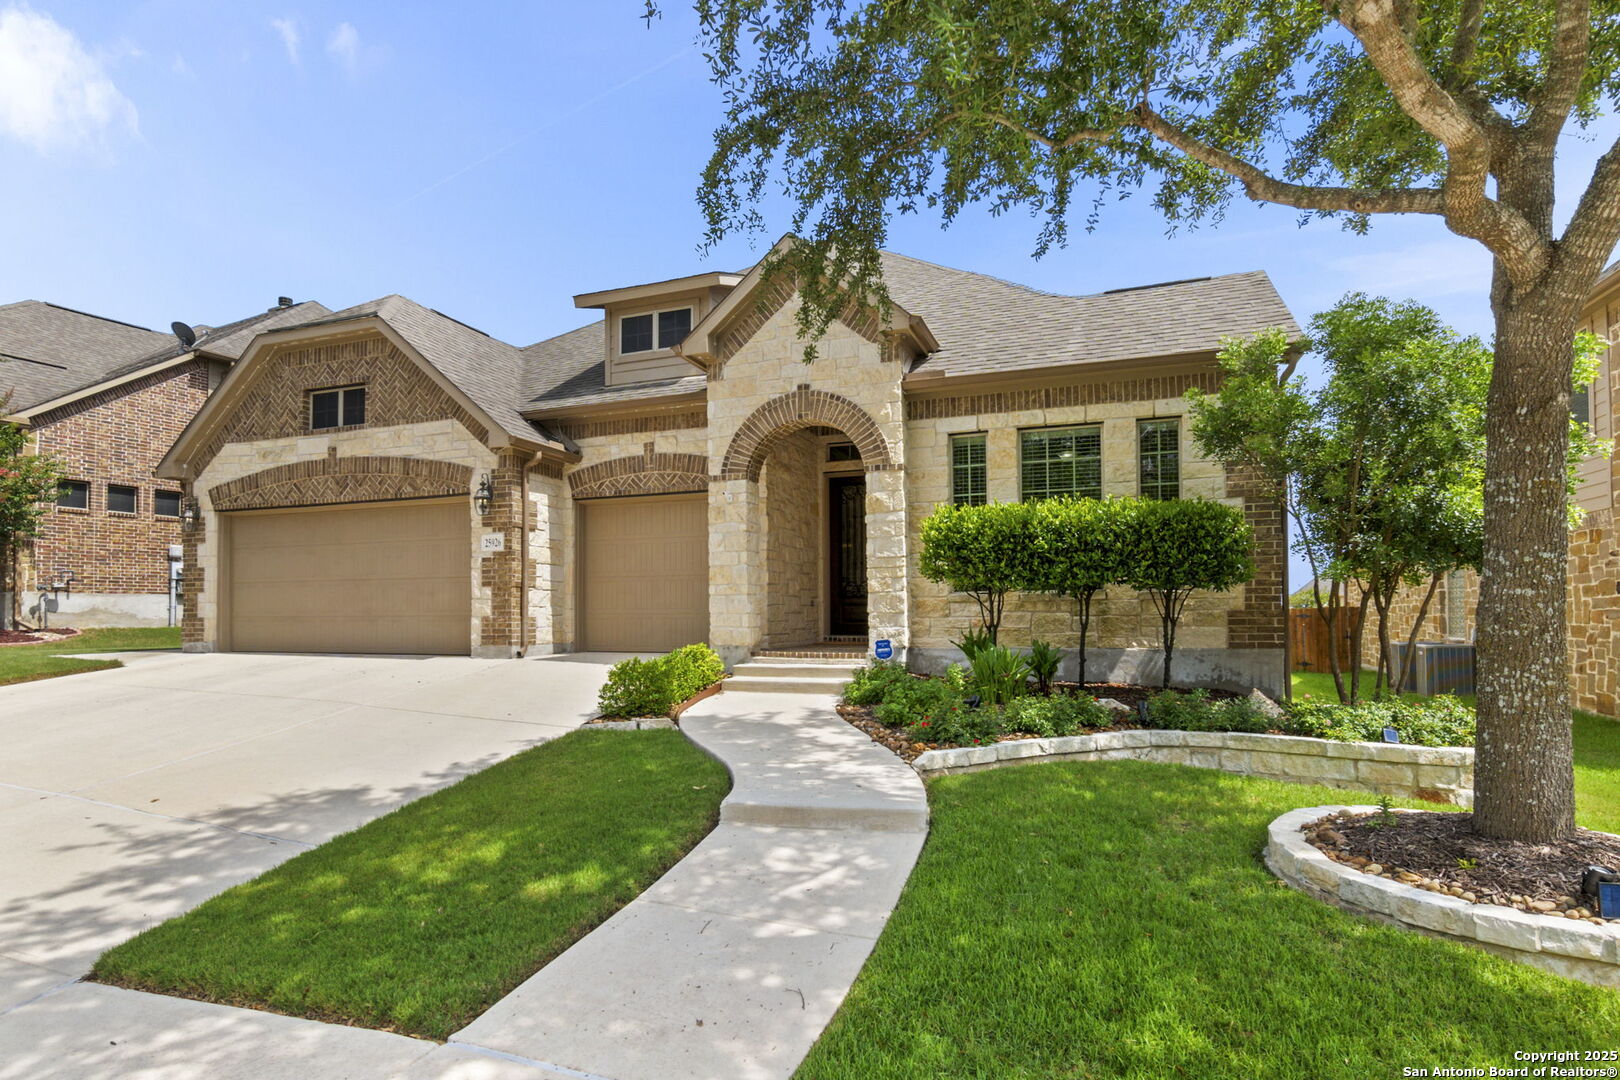
Active
$530,000
4
bds
|
4
ba
|
2,820
sqft
|
built
2012
25926 Natal Plum, San Antonio, TX 78261
$-1,454
Cash flow
-14.3%
Cash-on-Cash Return
2.4%
Cap rate
0.5%
Rent to Value Ratio
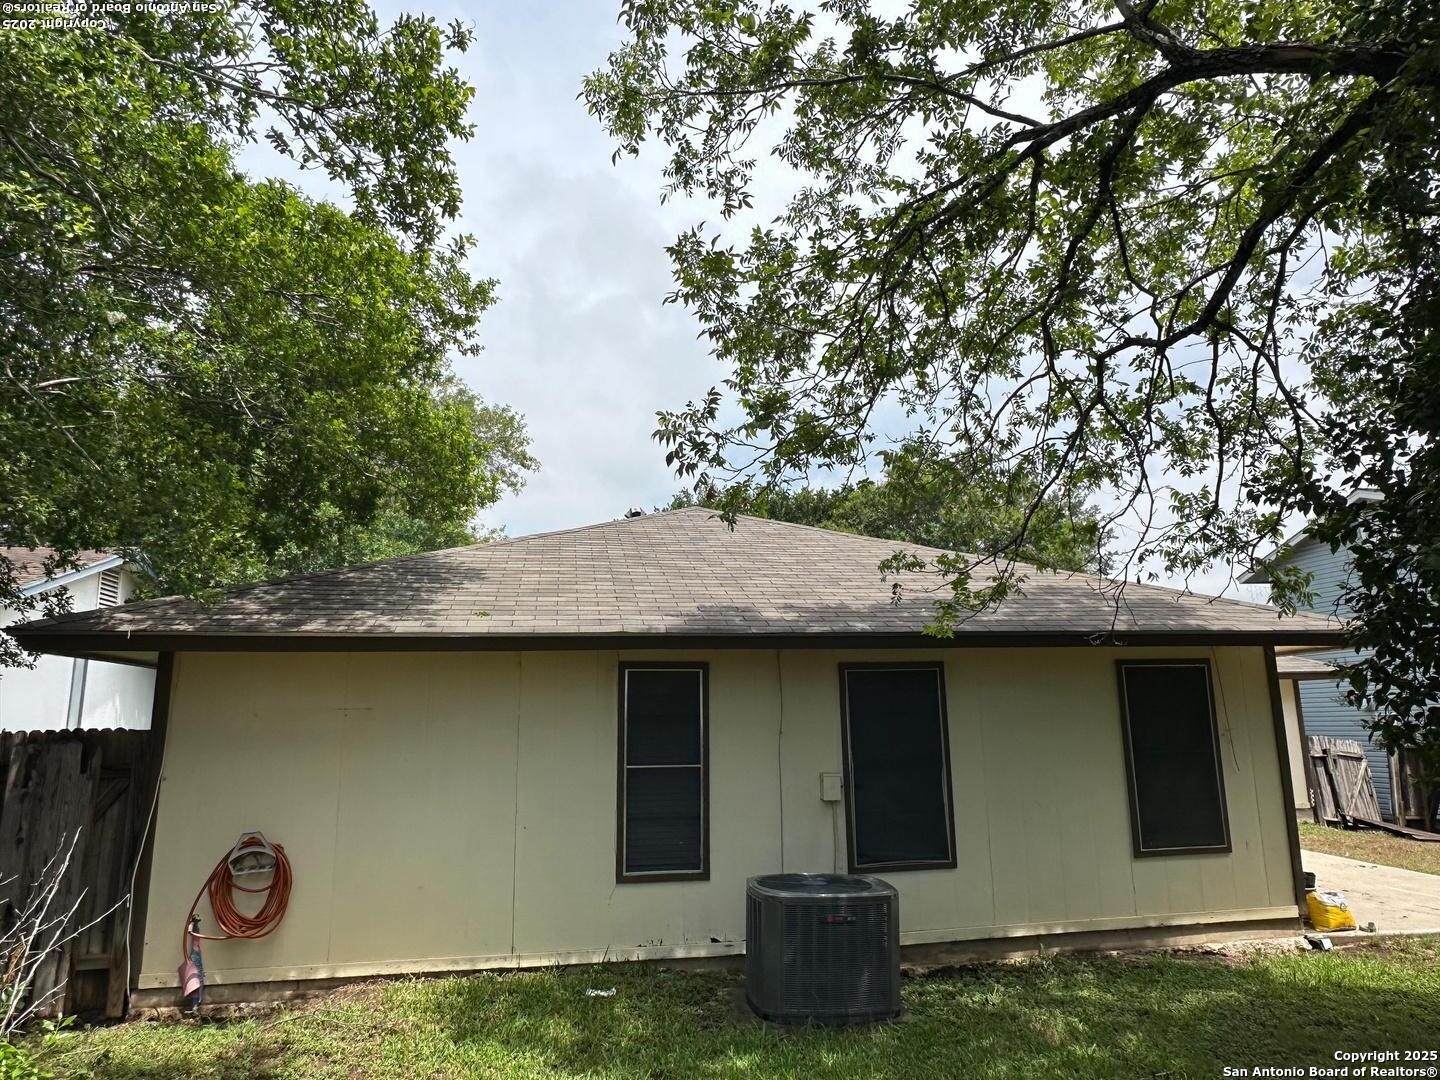
Active
$275,000
5
bds
|
2
ba
|
1,784
sqft
|
built
1980
5619 Wood Walk St, San Antonio, TX 78233
$-544
Cash flow
-10.3%
Cash-on-Cash Return
3.3%
Cap rate
0.7%
Rent to Value Ratio
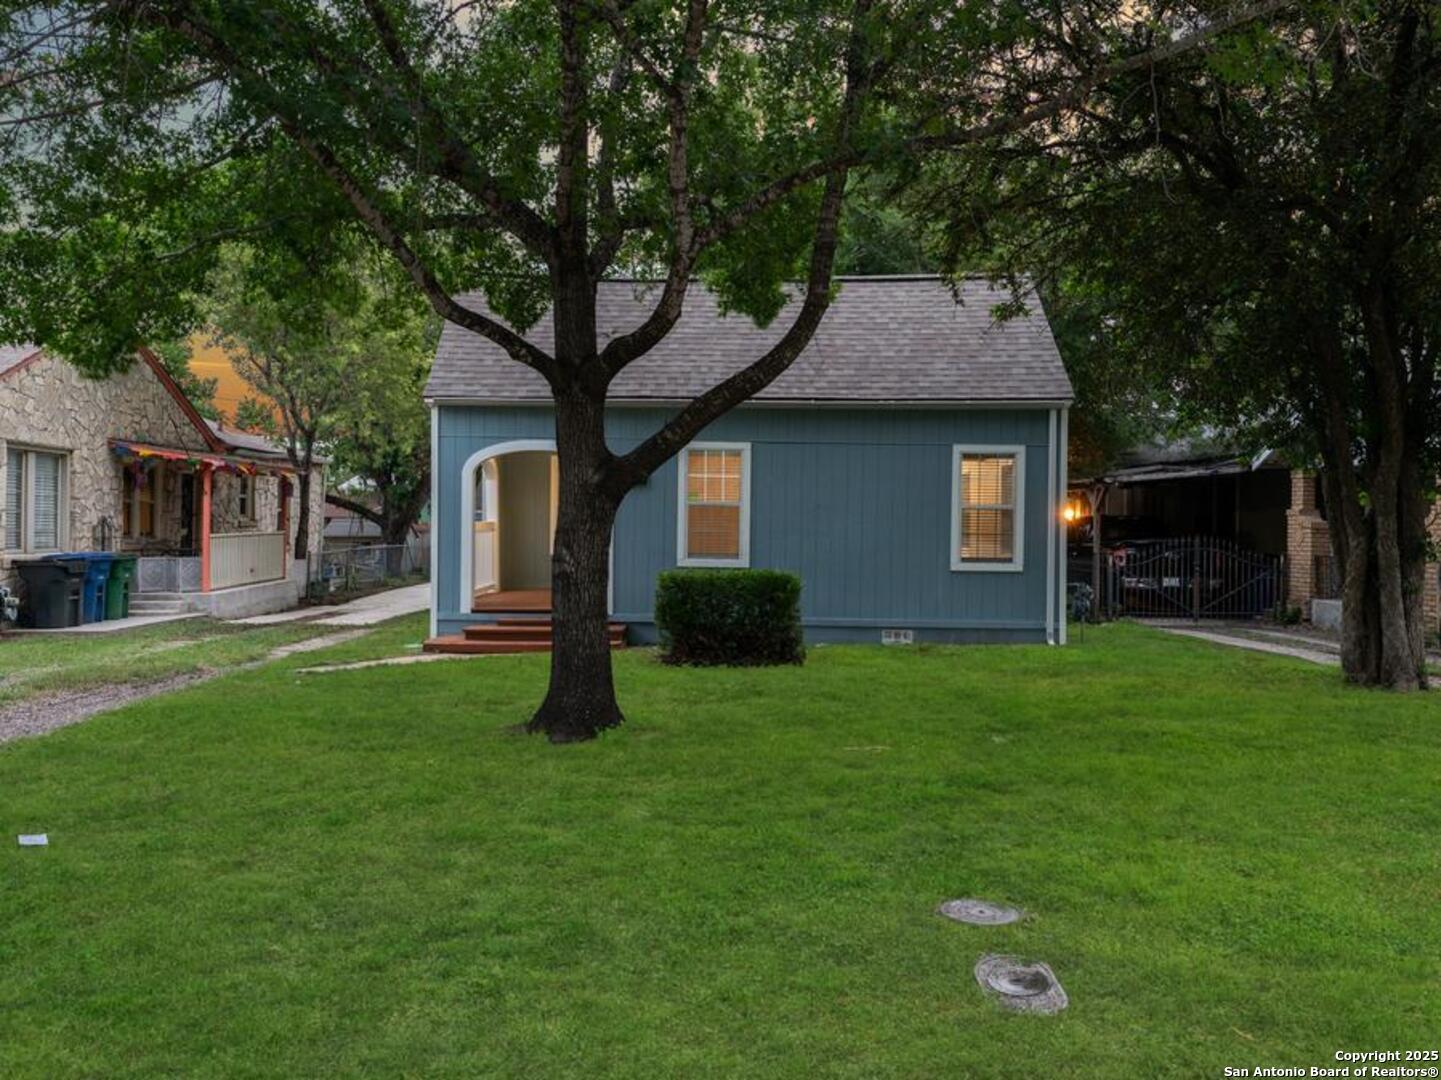
Active
$309,000
2
bds
|
1
ba
|
1,152
sqft
|
built
1931
1806 W Mistletoe Ave, San Antonio, TX 78201
$-841
Cash flow
-14.2%
Cash-on-Cash Return
2.4%
Cap rate
0.6%
Rent to Value Ratio
Active under contract
$465,000
3
bds
|
2
ba
|
2,126
sqft
|
built
1985
2102 Encino Cliff St, San Antonio, TX 78259
$-1,363
Cash flow
-15.3%
Cash-on-Cash Return
2.2%
Cap rate
0.5%
Rent to Value Ratio
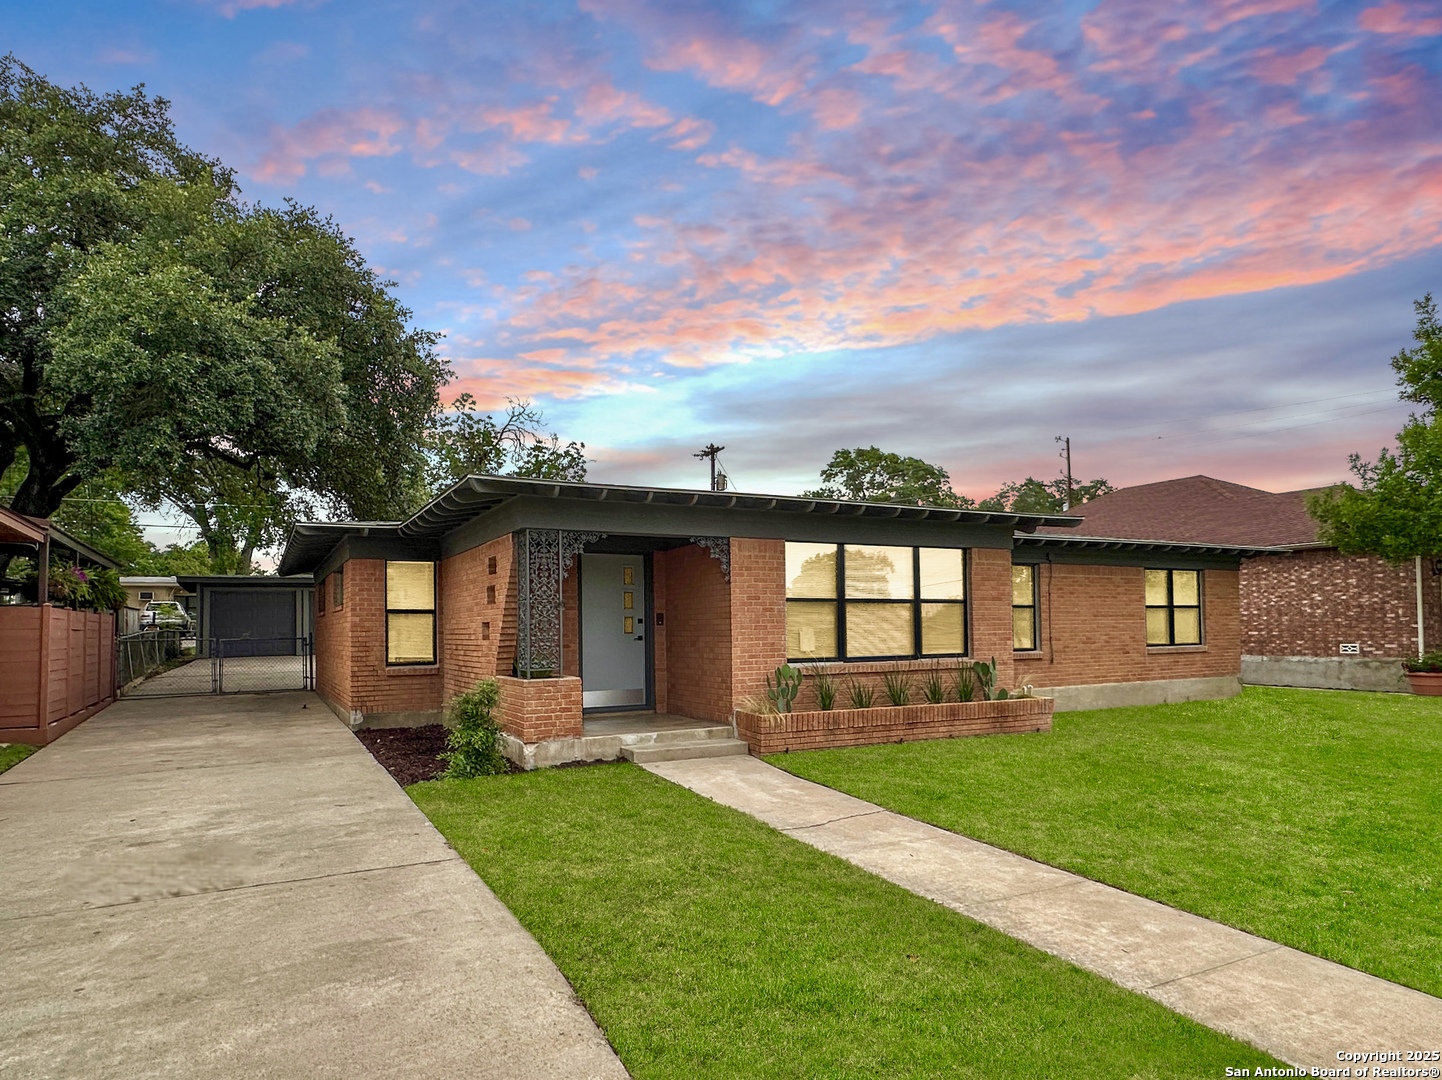
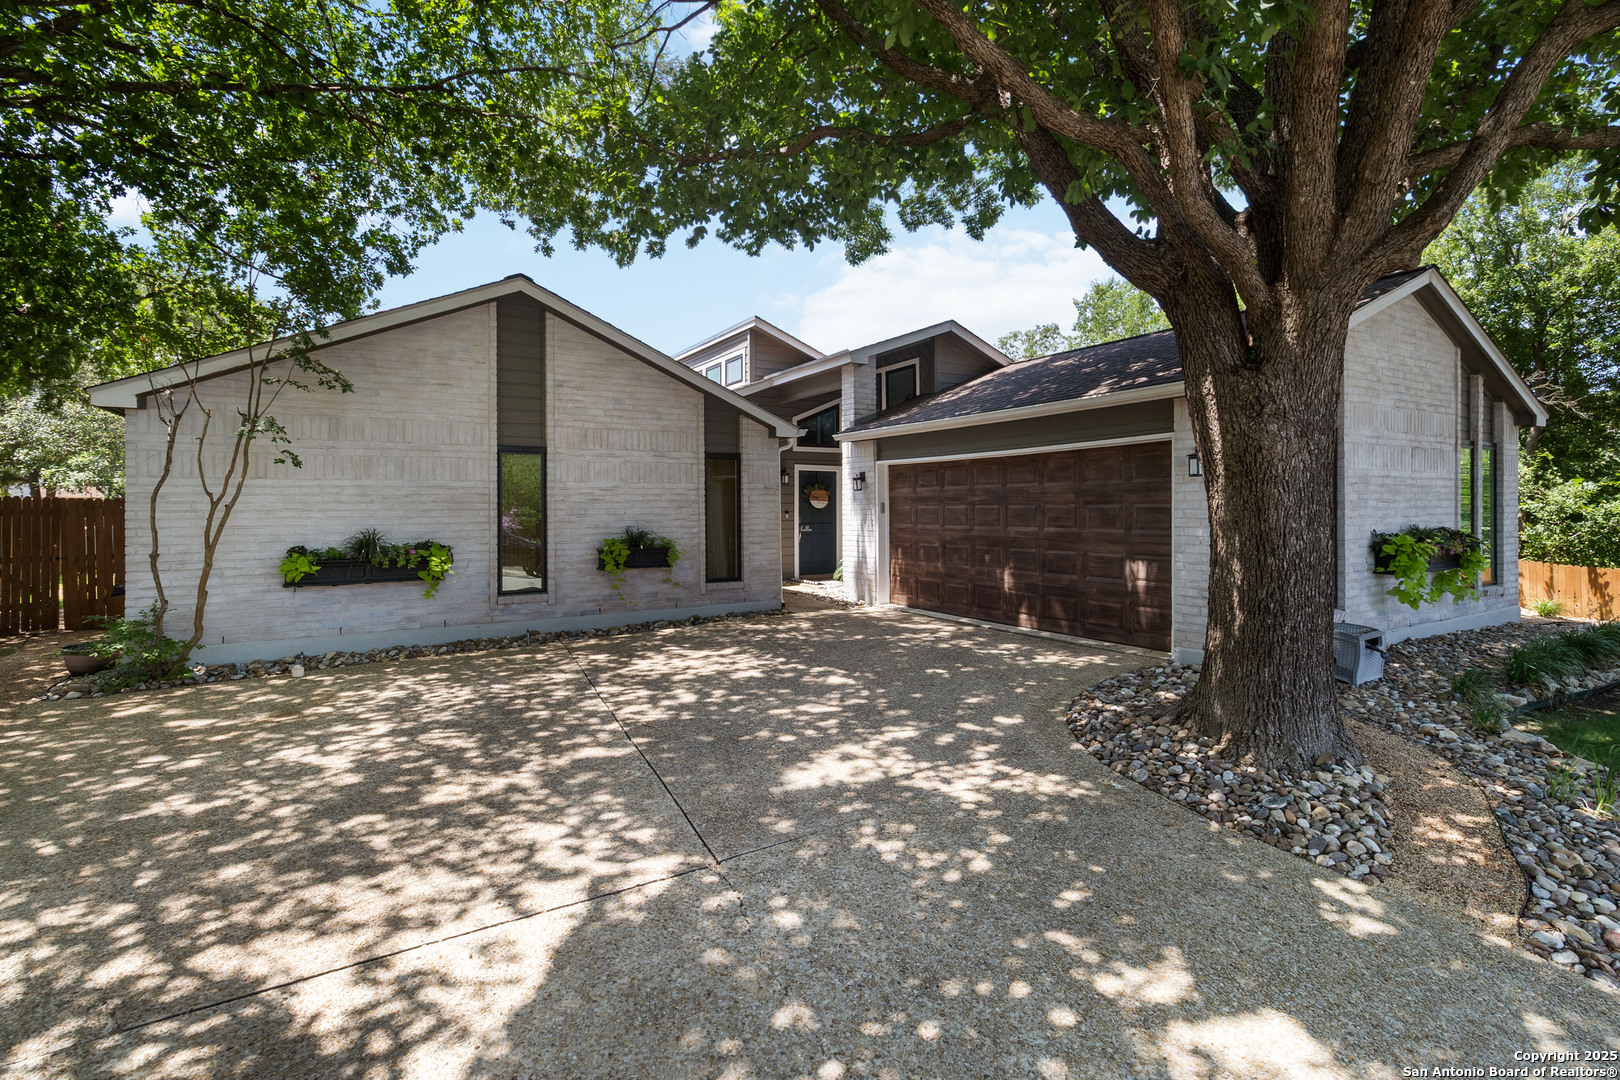
Active
$314,900
3
bds
|
2
ba
|
1,894
sqft
|
built
1955
543 Cosgrove St, San Antonio, TX 78210
$-570
Cash flow
-9.4%
Cash-on-Cash Return
3.5%
Cap rate
0.6%
Rent to Value Ratio

Active
$179,000
2
bds
|
1
ba
|
720
sqft
|
built
1955
230 Nock Ave, San Antonio, TX 78221
$-188
Cash flow
-5.5%
Cash-on-Cash Return
4.4%
Cap rate
0.7%
Rent to Value Ratio
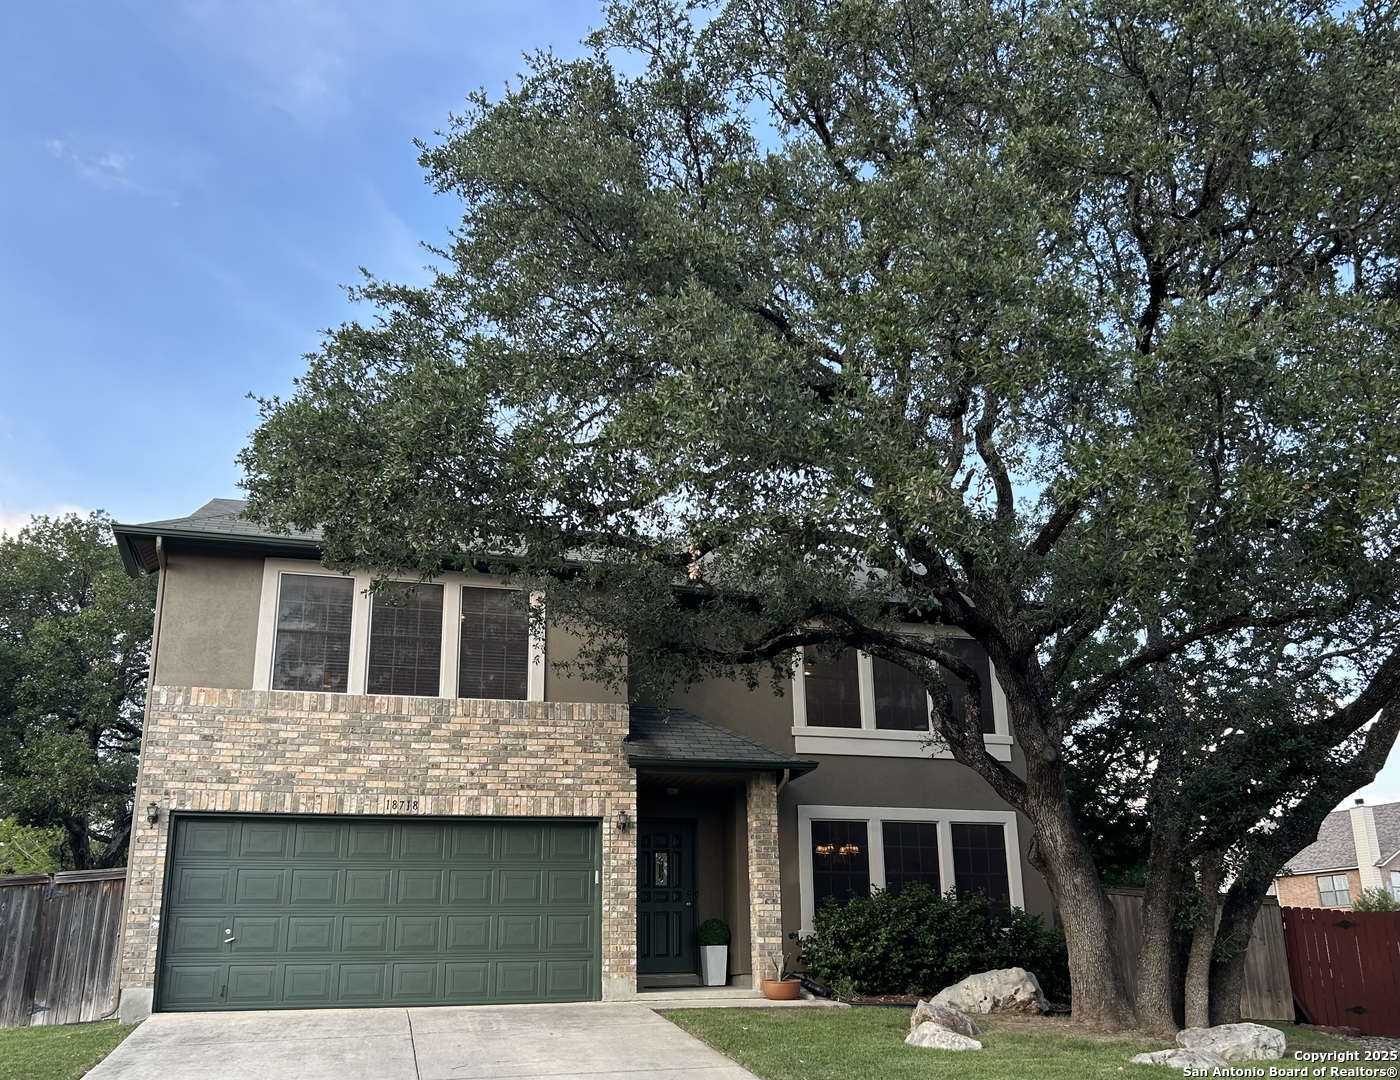
Active
$399,900
3
bds
|
3
ba
|
2,871
sqft
|
built
2000
18718 Taylore Run, San Antonio, TX 78259
$-921
Cash flow
-12.0%
Cash-on-Cash Return
2.9%
Cap rate
0.6%
Rent to Value Ratio
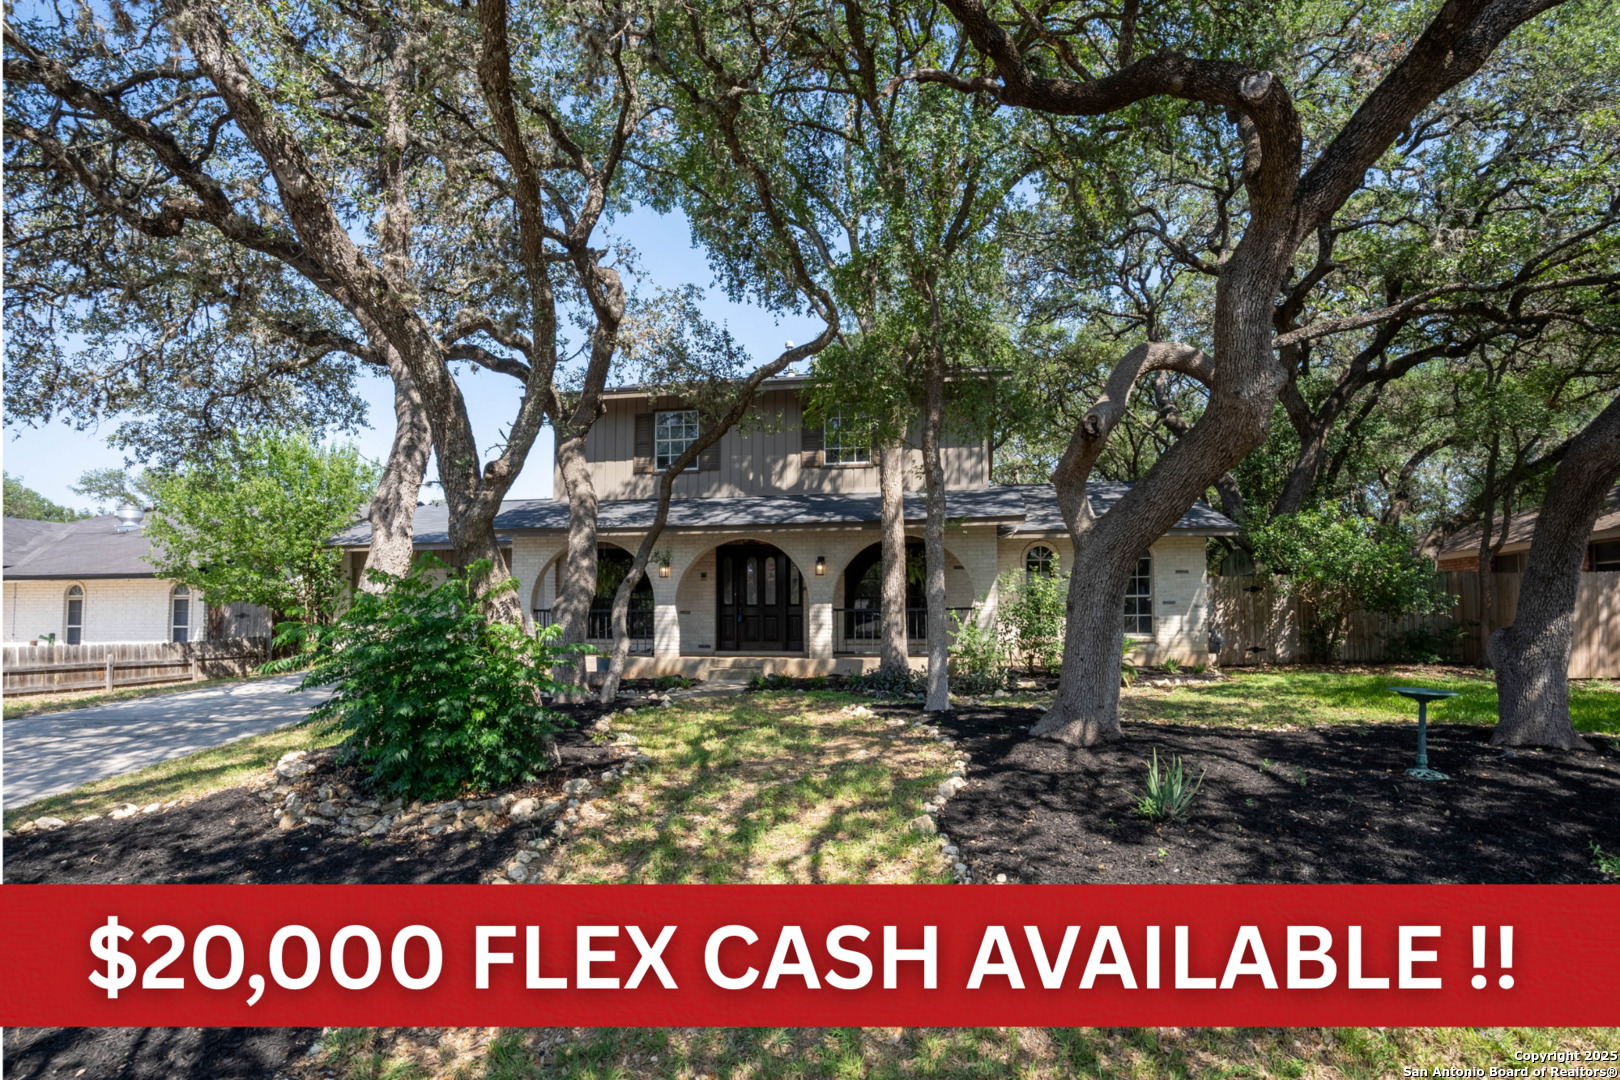
Active
$389,900
4
bds
|
3
ba
|
2,365
sqft
|
built
1974
3006 Charter Rock St, San Antonio, TX 78230
$-801
Cash flow
-10.7%
Cash-on-Cash Return
3.2%
Cap rate
0.6%
Rent to Value Ratio
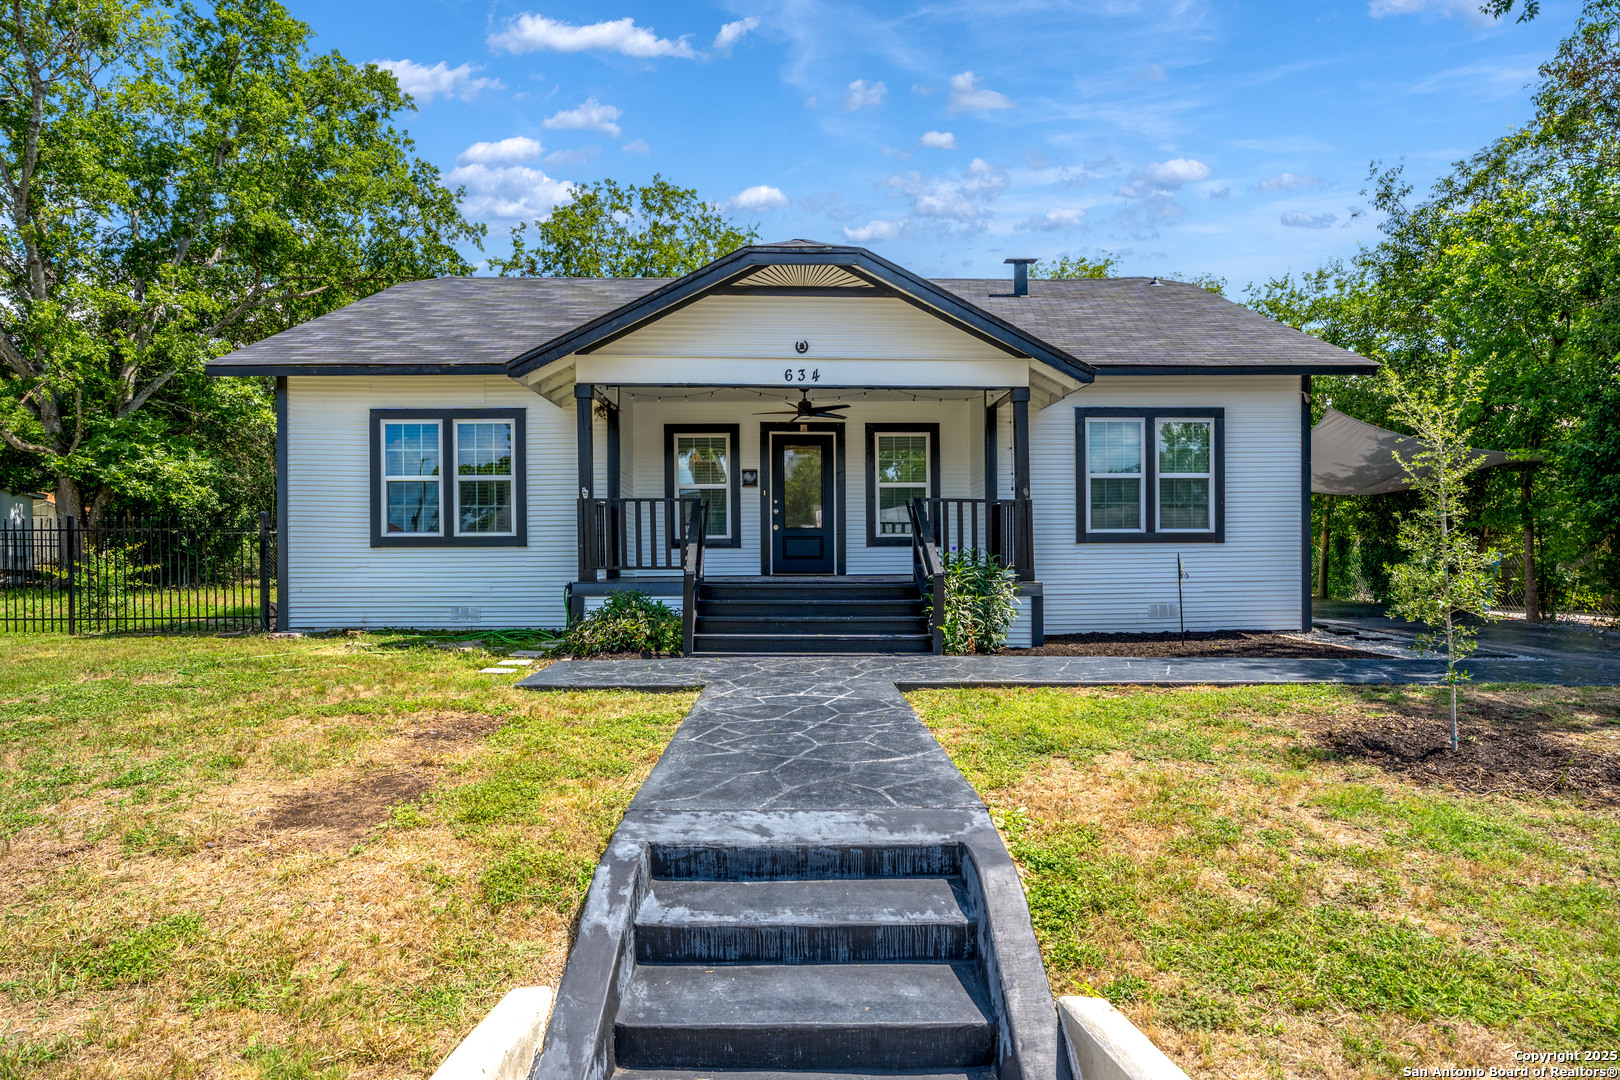
Active
$315,000
4
bds
|
2
ba
|
1,696
sqft
|
built
1925
634 Bailey Ave, San Antonio, TX 78210
$-737
Cash flow
-12.2%
Cash-on-Cash Return
2.9%
Cap rate
0.6%
Rent to Value Ratio
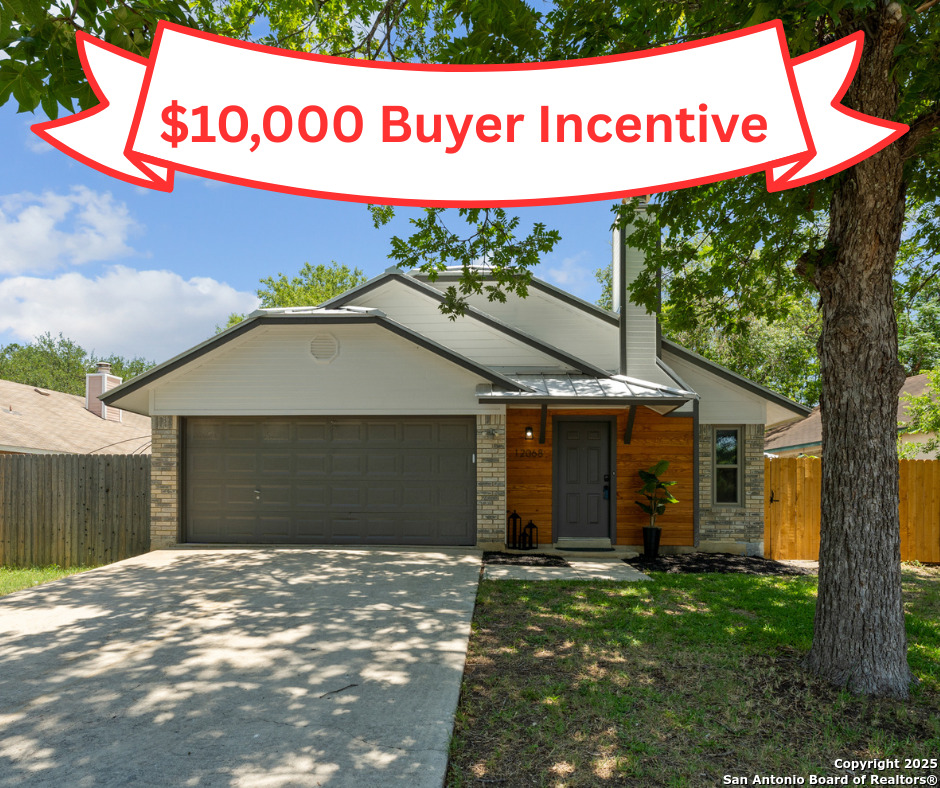
Active under contract
$284,999
3
bds
|
2
ba
|
1,149
sqft
|
built
1984
12068 Stoney Brg, San Antonio, TX 78247
$-680
Cash flow
-12.4%
Cash-on-Cash Return
2.8%
Cap rate
0.6%
Rent to Value Ratio

Active
$339,000
5
bds
|
3
ba
|
2,630
sqft
|
built
2021
195 Cuban Emerald, San Antonio, TX 78253
$-144
Cash flow
-2.2%
Cash-on-Cash Return
5.2%
Cap rate
0.6%
Rent to Value Ratio
Active
$130,000
3
bds
|
2
ba
|
1,803
sqft
|
built
1953
215 W Academy St, San Antonio, TX 78226
$160
Cash flow
6.4%
Cash-on-Cash Return
7.2%
Cap rate
1.2%
Rent to Value Ratio
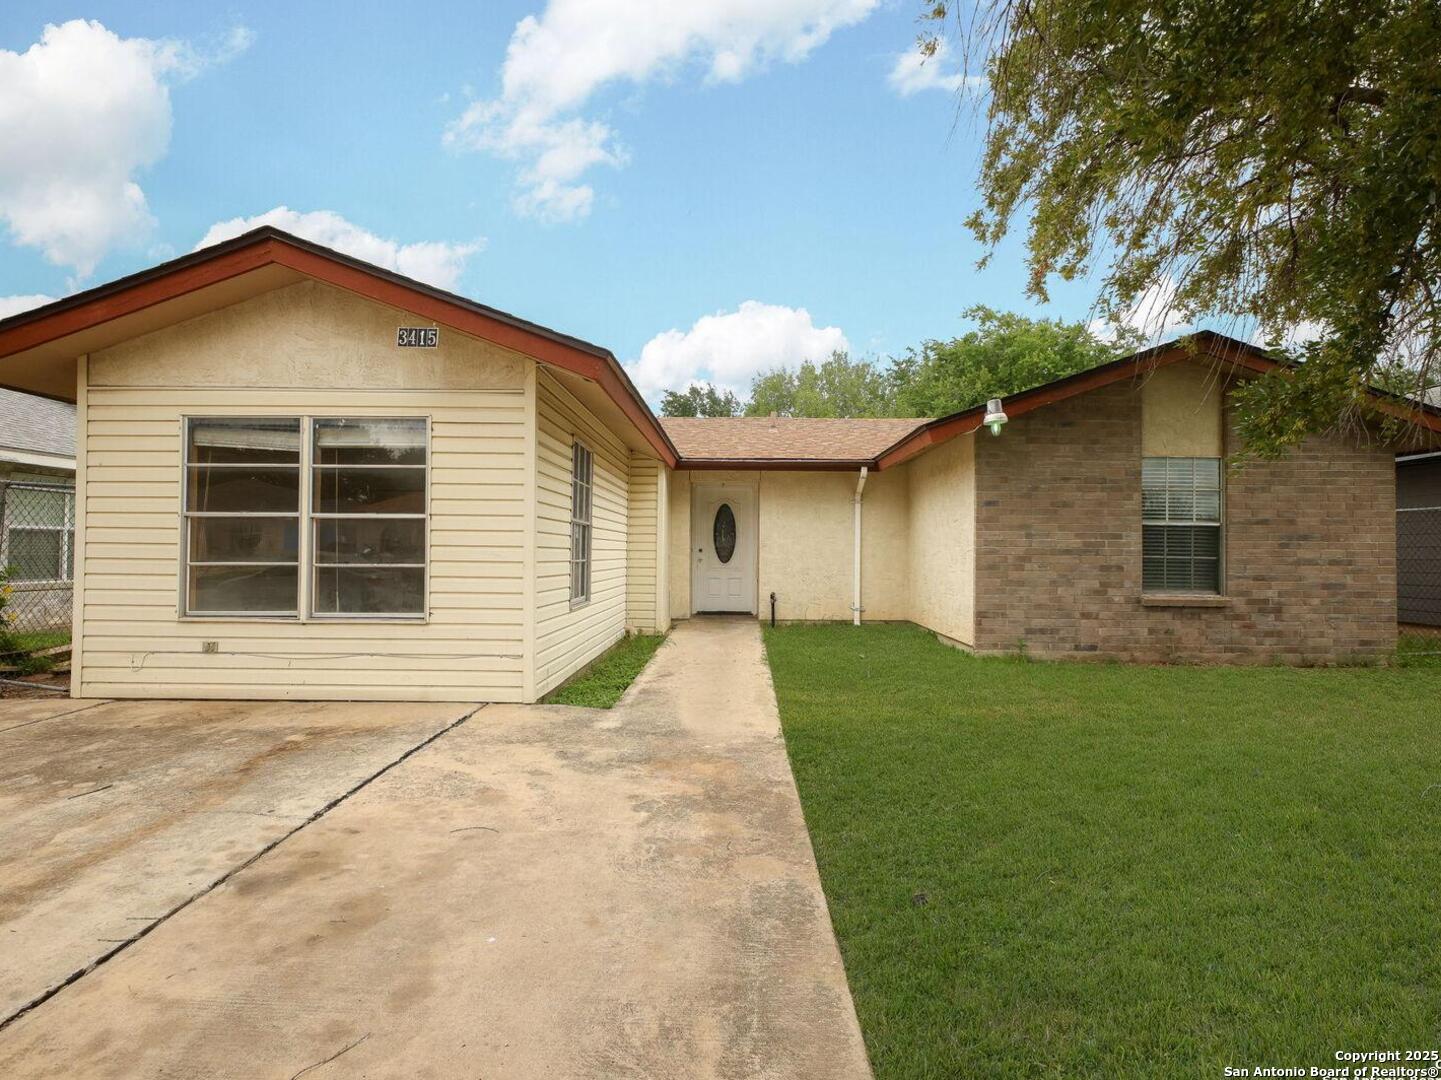
Active
$179,999
3
bds
|
2
ba
|
1,267
sqft
|
built
1986
3415 Twining Dr, San Antonio, TX 78211
$-246
Cash flow
-7.1%
Cash-on-Cash Return
4.0%
Cap rate
0.8%
Rent to Value Ratio
Active
$995,000
4
bds
|
5
ba
|
4,356
sqft
|
built
2003
22418 Roan Frst, San Antonio, TX 78259
$-3,020
Cash flow
-15.8%
Cash-on-Cash Return
2.0%
Cap rate
0.5%
Rent to Value Ratio
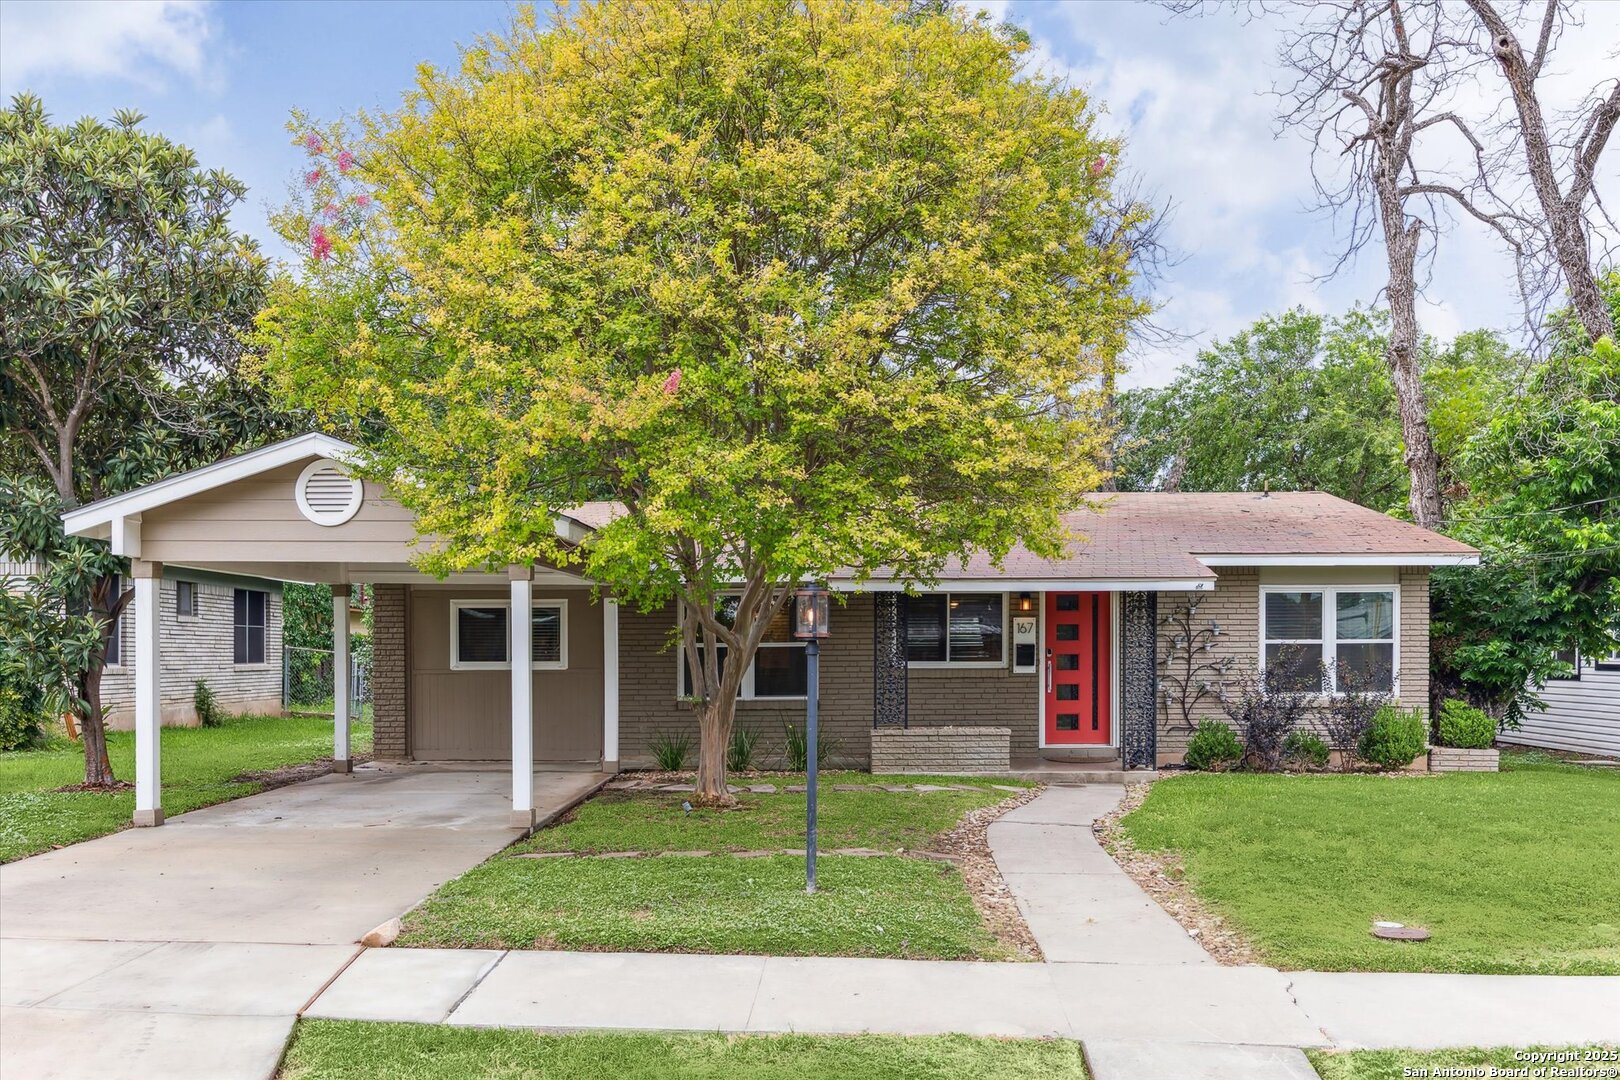
Active
$235,000
3
bds
|
2
ba
|
1,312
sqft
|
built
1957
167 Fennel Dr, San Antonio, TX 78213
$-397
Cash flow
-8.8%
Cash-on-Cash Return
3.7%
Cap rate
0.7%
Rent to Value Ratio
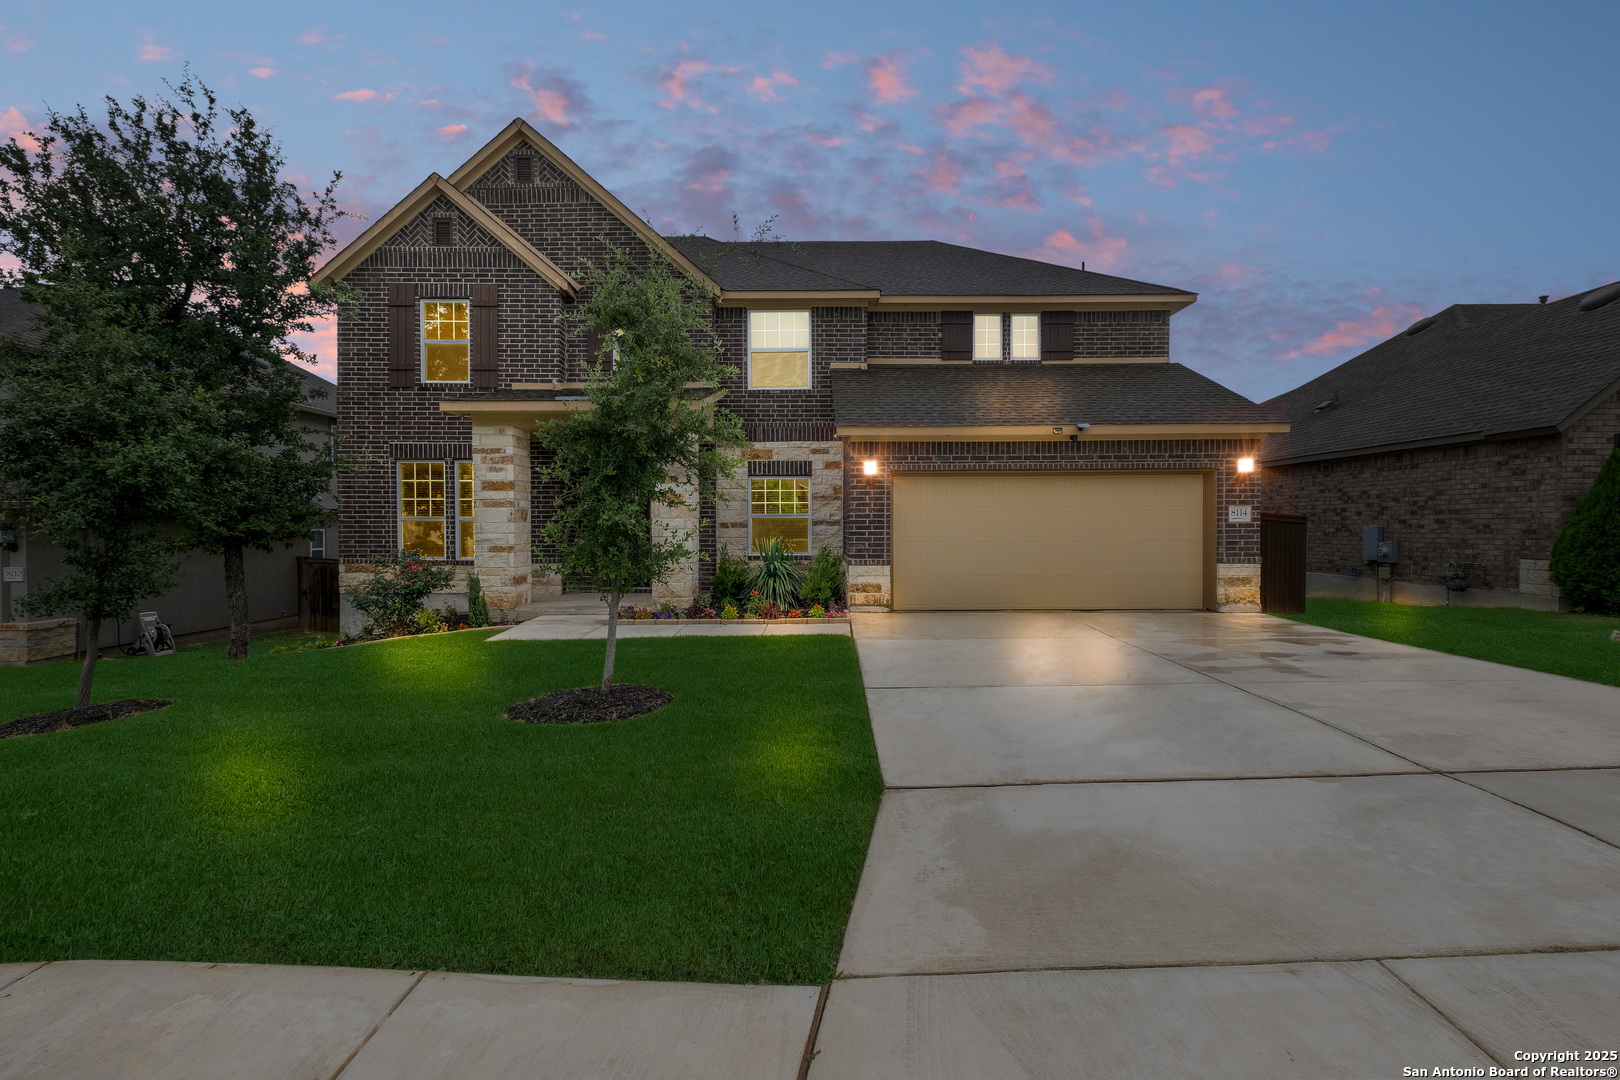
Active
$620,000
4
bds
|
3
ba
|
2,781
sqft
|
built
2022
8114 Waterman Bch, San Antonio, TX 78255
$-1,493
Cash flow
-12.6%
Cash-on-Cash Return
2.8%
Cap rate
0.5%
Rent to Value Ratio
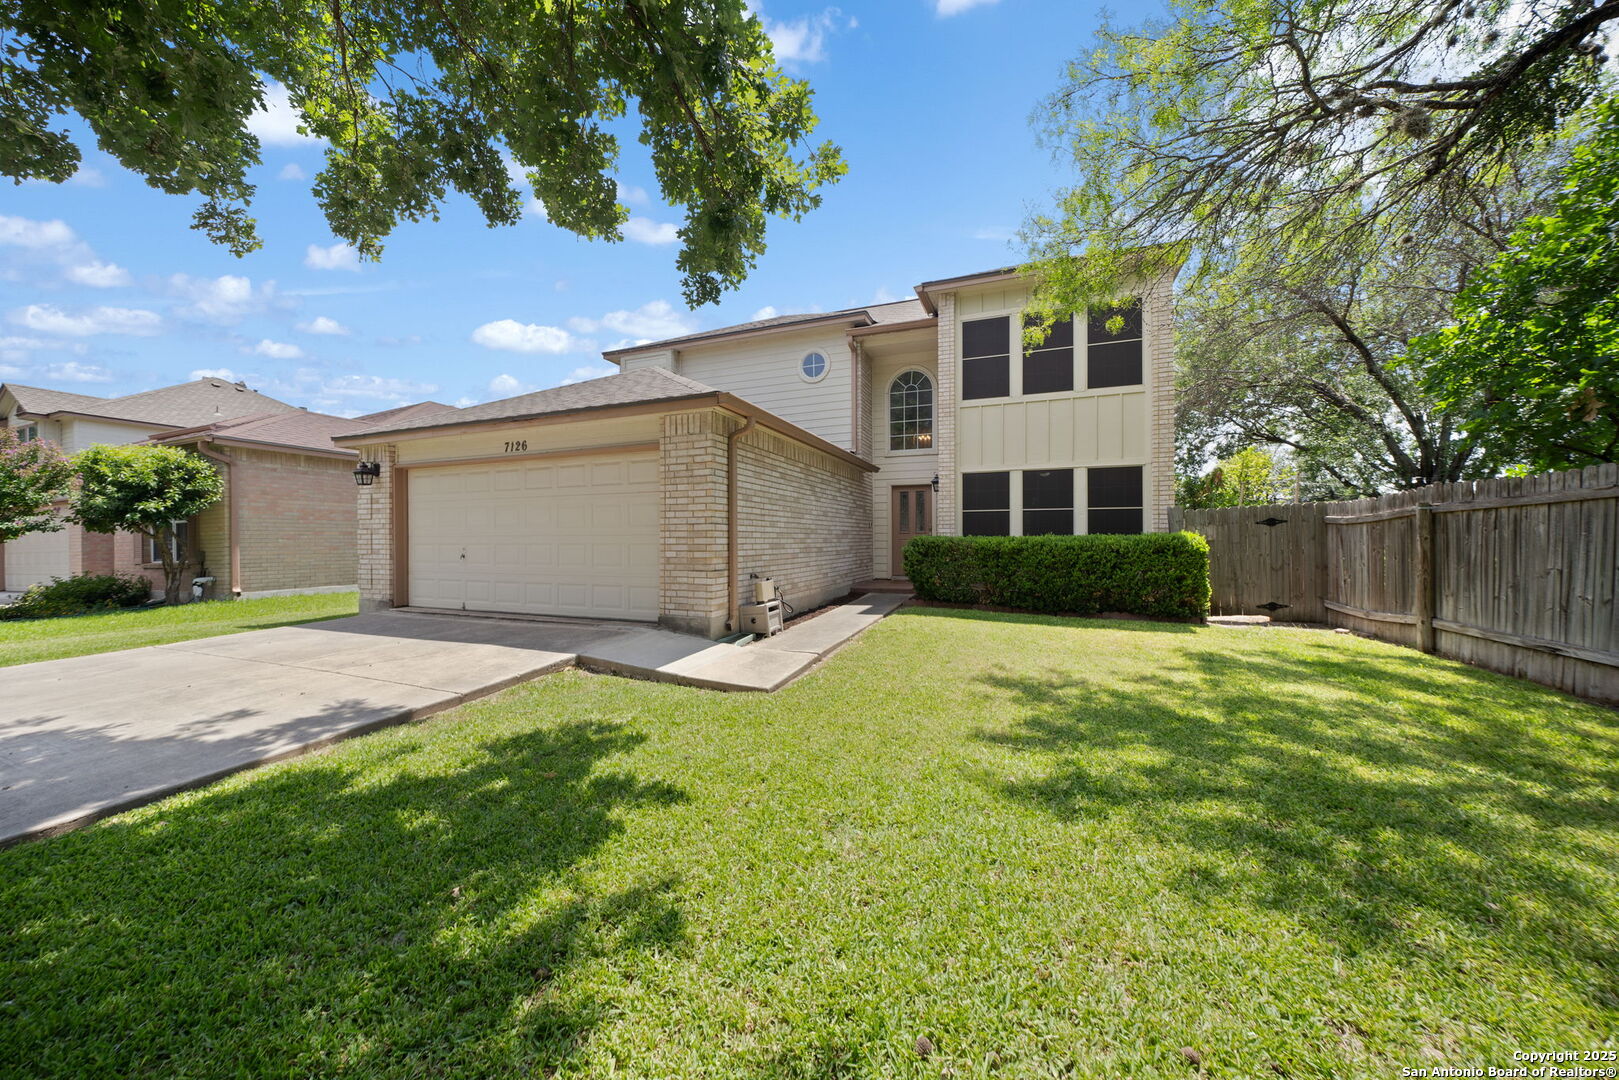
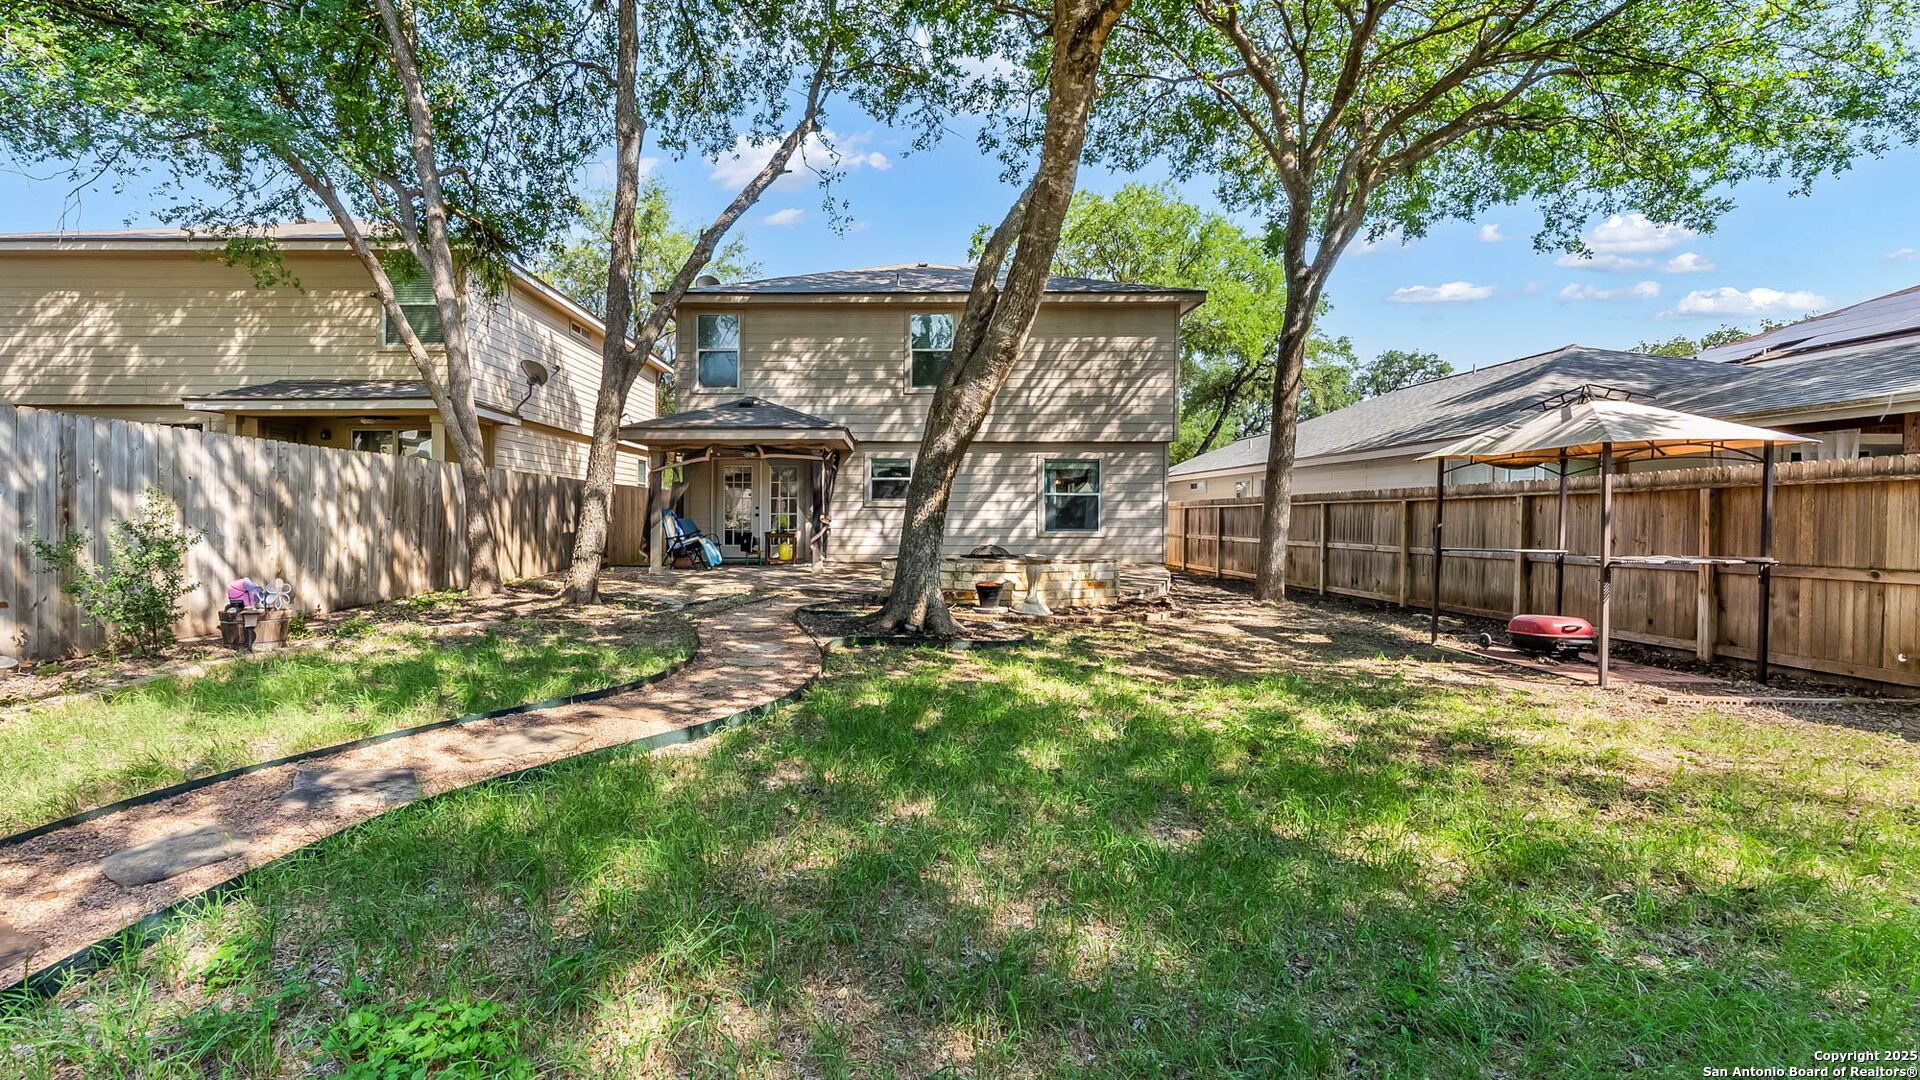
Active
$358,750
3
bds
|
3
ba
|
2,356
sqft
|
built
2001
7126 Linkcrest, San Antonio, TX 78240
$-744
Cash flow
-10.8%
Cash-on-Cash Return
3.2%
Cap rate
0.6%
Rent to Value Ratio
Active
$325,000
3
bds
|
3
ba
|
1,955
sqft
|
built
2003
5327 Missouri Bnd, San Antonio, TX 78247
$-779
Cash flow
-12.5%
Cash-on-Cash Return
2.8%
Cap rate
0.6%
Rent to Value Ratio
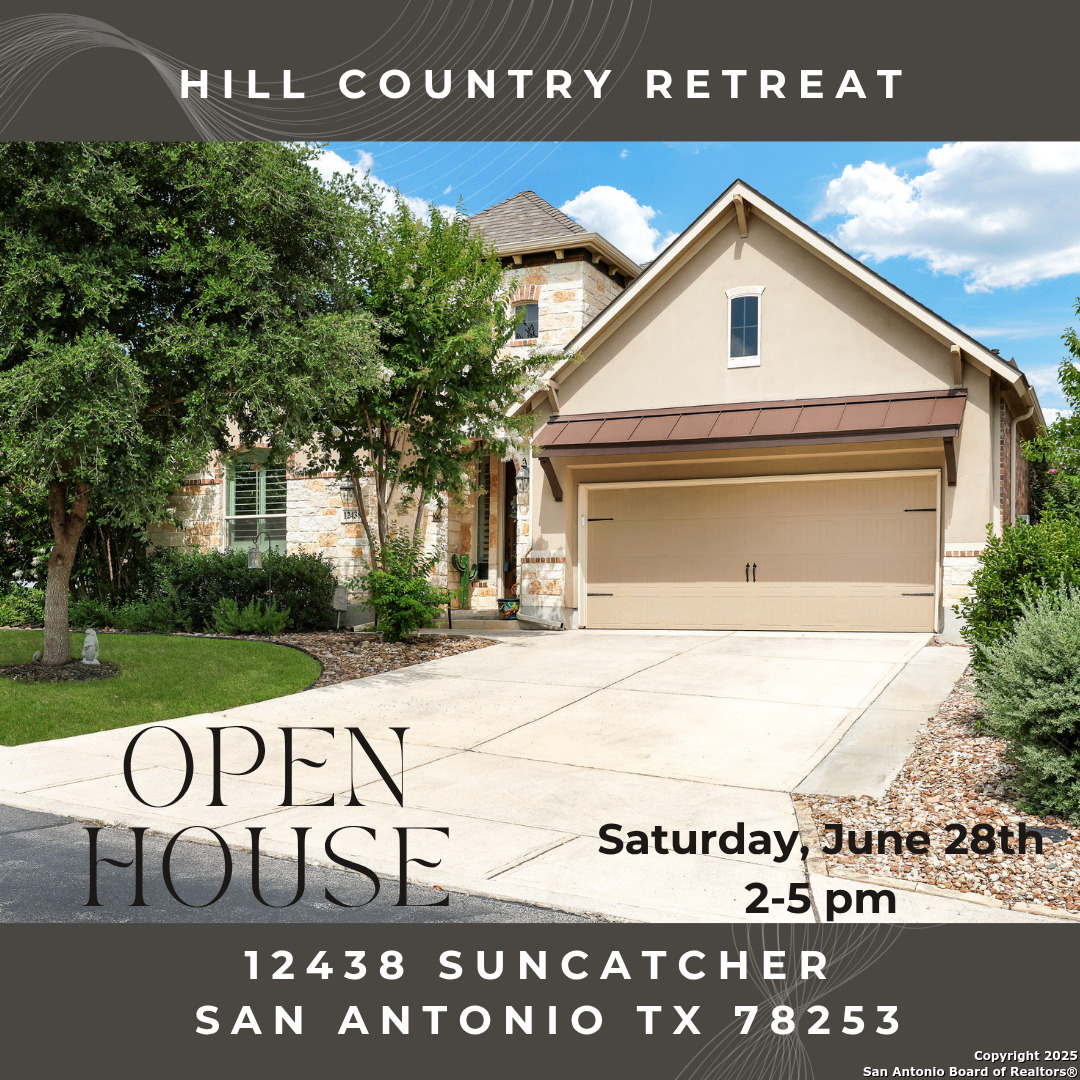
Active
$449,900
3
bds
|
2
ba
|
2,068
sqft
|
built
2014
12438 Suncatcher, San Antonio, TX 78253
$-1,198
Cash flow
-13.9%
Cash-on-Cash Return
2.5%
Cap rate
0.6%
Rent to Value Ratio

Active
$269,000
4
bds
|
3
ba
|
1,501
sqft
|
built
1986
6158 Valley Clf, San Antonio, TX 78250
$-513
Cash flow
-9.9%
Cash-on-Cash Return
3.4%
Cap rate
0.7%
Rent to Value Ratio
Active under contract
$560,000
4
bds
|
4
ba
|
3,368
sqft
|
built
2005
106 Stonewall Bnd, San Antonio, TX 78256
$-1,355
Cash flow
-12.6%
Cash-on-Cash Return
2.8%
Cap rate
0.6%
Rent to Value Ratio
Active
$85,000
3
bds
|
1
ba
|
984
sqft
|
built
1940
102 S Rosillo, San Antonio, TX 78207
$210
Cash flow
12.9%
Cash-on-Cash Return
8.6%
Cap rate
1.4%
Rent to Value Ratio
Active
$225,000
3
bds
|
2
ba
|
1,274
sqft
|
built
1962
2614 Lovelace Blvd, San Antonio, TX 78217
$-389
Cash flow
-9.0%
Cash-on-Cash Return
3.6%
Cap rate
0.7%
Rent to Value Ratio
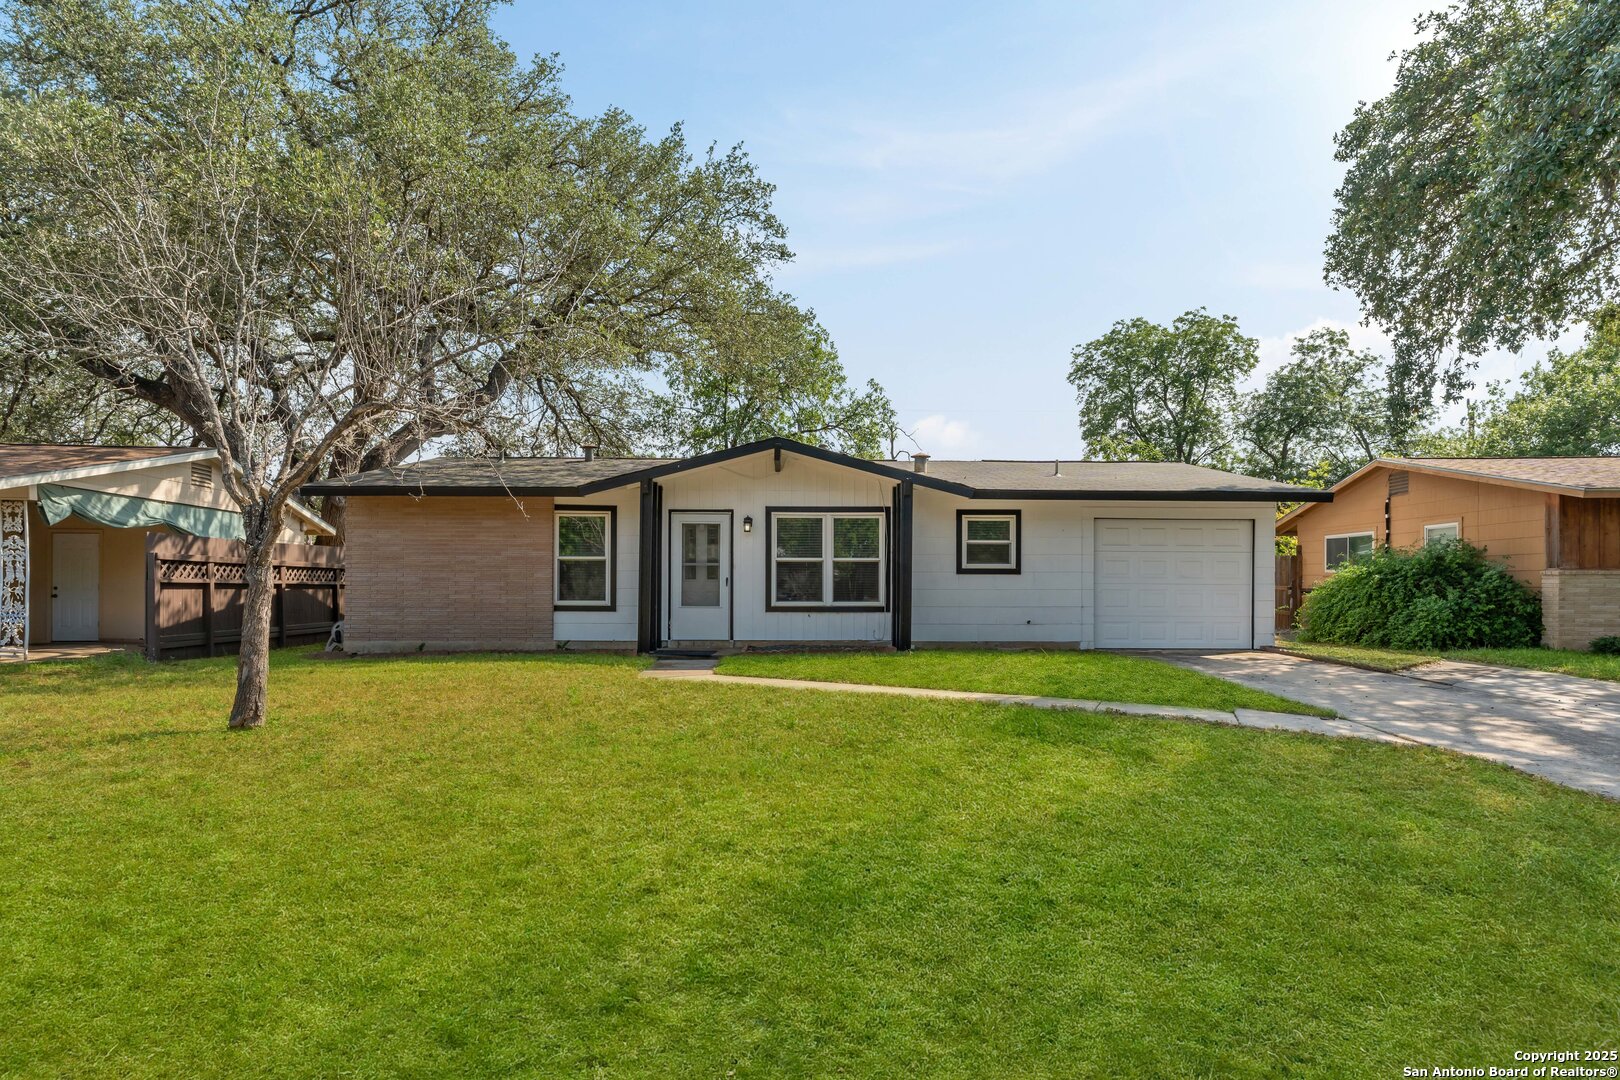
Active under contract
$215,000
4
bds
|
3
ba
|
2,135
sqft
|
built
1974
6403 Port Royal St, San Antonio, TX 78244
$-197
Cash flow
-4.8%
Cash-on-Cash Return
4.6%
Cap rate
0.8%
Rent to Value Ratio
Active under contract
$225,000
3
bds
|
2
ba
|
1,651
sqft
|
built
1948
702 John Adams Dr, San Antonio, TX 78228
$-256
Cash flow
-5.9%
Cash-on-Cash Return
4.3%
Cap rate
0.7%
Rent to Value Ratio
Active
$759,000
5
bds
|
4
ba
|
3,408
sqft
|
built
1991
23613 Grayling Ln, San Antonio, TX 78259
$-2,476
Cash flow
-17.0%
Cash-on-Cash Return
1.8%
Cap rate
0.4%
Rent to Value Ratio