Miami Dade County Investment Properties for Sale
Browse homes for sale and investment properties in Miami Dade County. Refine your search by price, property type, or more.
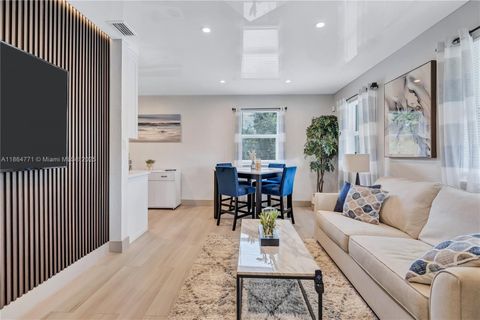
Best cash flowing properties in Miami Dade County
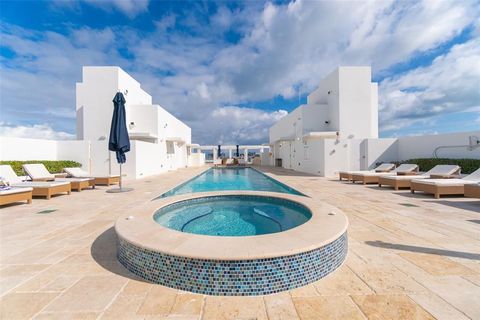
Active
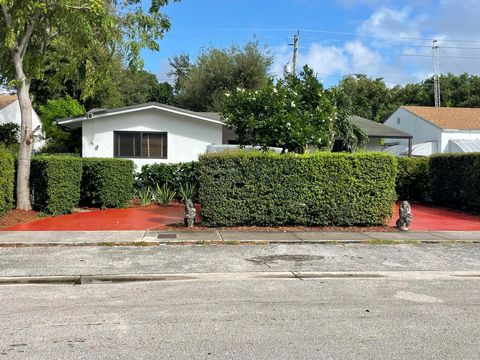
$525,000
3
bds
|
2
ba
|
1,376
sqft
|
built
1963
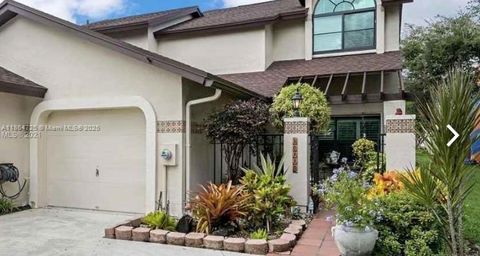
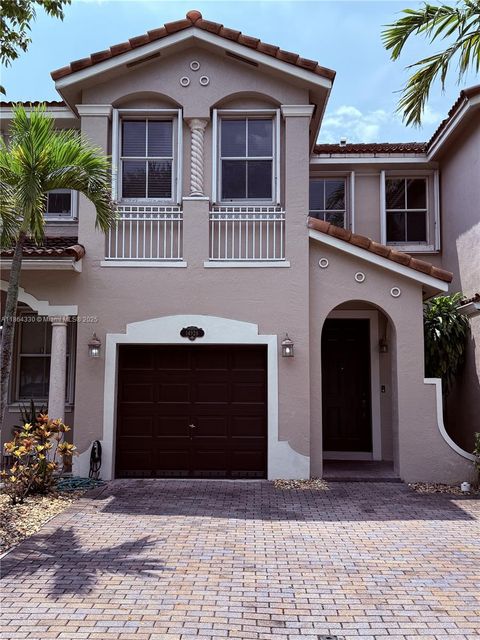
919 NW 47th Ter, Miami, FL 33127
$-343
Cash flow
-3.4%
Cash-on-Cash Return
5.4%
Cap rate
0.7%
Rent to Value Ratio

Active
$197,000
bds
|
1
ba
|
420
sqft
|
built
1956
911 Meridian Ave, Miami Beach, FL 33139
$-429
Cash flow
-11.4%
Cash-on-Cash Return
3.5%
Cap rate
0.9%
Rent to Value Ratio
10,000 out of 16,132 properties for sale in Miami Dade County
Limited Results Shown
Create a free account, or log in to reveal all property listings and enjoy the complete experience.
Active
$525,000
3
bds
|
2
ba
|
900
sqft
|
built
1946
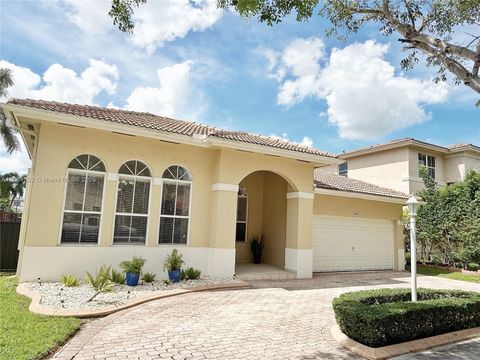
1390 NE 150th St, Miami, FL 33161
$-736
Cash flow
-7.3%
Cash-on-Cash Return
4.5%
Cap rate
0.7%
Rent to Value Ratio
Active
$699,000
5
bds
|
2
ba
|
2,173
sqft
|
built
1987
11341 SW 163rd St, Miami, FL 33157
$-1,929
Cash flow
-14.4%
Cash-on-Cash Return
2.8%
Cap rate
0.5%
Rent to Value Ratio
Active
$550,000
1
bds
|
2
ba
|
930
sqft
|
built
1968
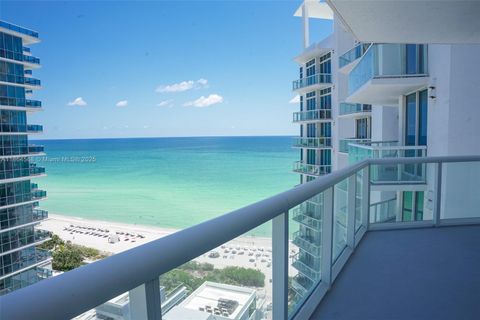
5601 Collins Ave, Miami Beach, FL 33140
$-2,067
Cash flow
-19.6%
Cash-on-Cash Return
1.6%
Cap rate
0.7%
Rent to Value Ratio
Active
$625,000
3
bds
|
3
ba
|
1,819
sqft
|
built
1989
10110 SW 137th Ct, Miami, FL 33186
$-1,341
Cash flow
-11.2%
Cash-on-Cash Return
3.6%
Cap rate
0.5%
Rent to Value Ratio

Active
$1,090,000
bds
|
1
ba
|
526
sqft
|
built
2005
4401 Collins Ave, Miami Beach, FL 33140
$-4,725
Cash flow
-22.6%
Cash-on-Cash Return
0.9%
Cap rate
0.4%
Rent to Value Ratio
Active
$695,000
2
bds
|
2
ba
|
1,048
sqft
|
built
2008
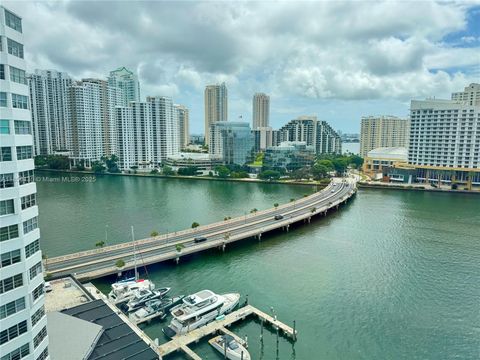
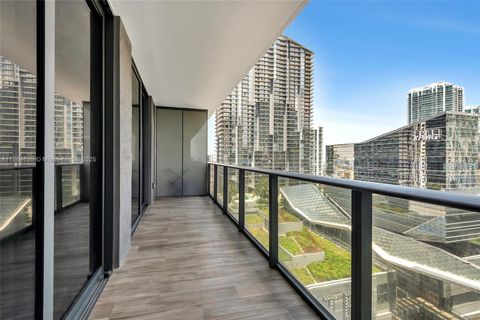
1750 N Bayshore Dr, Miami, FL 33132
$-3,711
Cash flow
-27.9%
Cash-on-Cash Return
-0.3%
Cap rate
0.6%
Rent to Value Ratio
Active
$312,000
2
bds
|
1
ba
|
860
sqft
|
built
1957
1265 Marseille Dr, Miami Beach, FL 33141
$-981
Cash flow
-16.4%
Cash-on-Cash Return
2.4%
Cap rate
0.8%
Rent to Value Ratio
Active
$465,900
2
bds
|
2
ba
|
1,446
sqft
|
built
1986
9059 SW 133rd Ct, Miami, FL 33186
$-871
Cash flow
-9.8%
Cash-on-Cash Return
3.9%
Cap rate
0.6%
Rent to Value Ratio
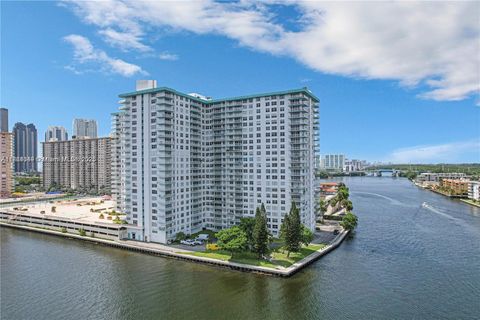
Active
$2,799,000
4
bds
|
4
ba
|
2,251
sqft
|
built
1947
899 NE 71st St, Miami, FL 33138
$-9,766
Cash flow
-18.2%
Cash-on-Cash Return
2.0%
Cap rate
0.3%
Rent to Value Ratio
Active
$1,625,000
2
bds
|
2
ba
|
1,128
sqft
|
built
2004
6515 Collins Ave, Miami Beach, FL 33141
$-6,639
Cash flow
-21.3%
Cash-on-Cash Return
1.2%
Cap rate
0.4%
Rent to Value Ratio
Active
$410,000
2
bds
|
3
ba
|
990
sqft
|
built
1968
905 Brickell Bay Dr, Miami, FL 33131
$-1,316
Cash flow
-16.7%
Cash-on-Cash Return
2.3%
Cap rate
0.8%
Rent to Value Ratio
Active
$1,700,000
4
bds
|
2
ba
|
3,308
sqft
|
built
1983
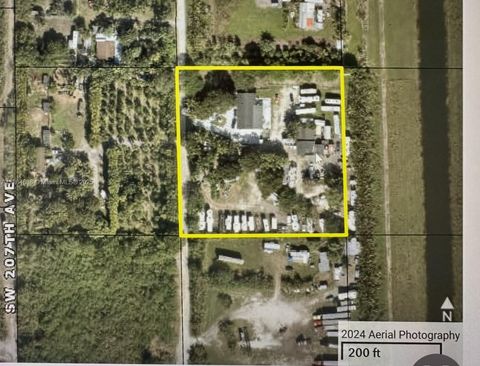
15765 SW 206th Ave, Miami, FL 33187
$-6,248
Cash flow
-19.2%
Cash-on-Cash Return
1.7%
Cap rate
0.3%
Rent to Value Ratio
Active
$930,000
4
bds
|
3
ba
|
2,416
sqft
|
built
1999
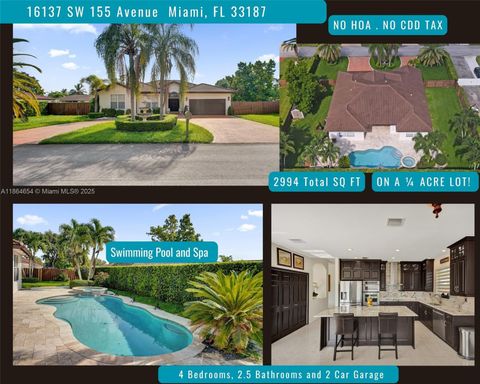
16137 SW 155th Ave, Miami, FL 33187
$-2,137
Cash flow
-12.0%
Cash-on-Cash Return
3.4%
Cap rate
0.5%
Rent to Value Ratio
Active
$625,000
1
bds
|
2
ba
|
849
sqft
|
built
2018
801 S Miami Ave, Miami, FL 33130
$-2,212
Cash flow
-18.5%
Cash-on-Cash Return
1.9%
Cap rate
0.7%
Rent to Value Ratio
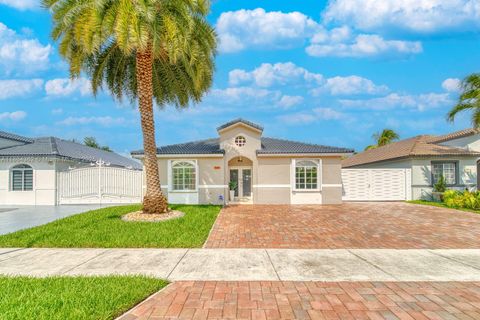
Active
$549,900
3
bds
|
3
ba
|
1,812
sqft
|
built
2004
14928 SW 23rd St, Miami, FL 33185
$-1,228
Cash flow
-11.7%
Cash-on-Cash Return
3.5%
Cap rate
0.6%
Rent to Value Ratio
Active
$605,000
2
bds
|
2
ba
|
1,331
sqft
|
built
1975
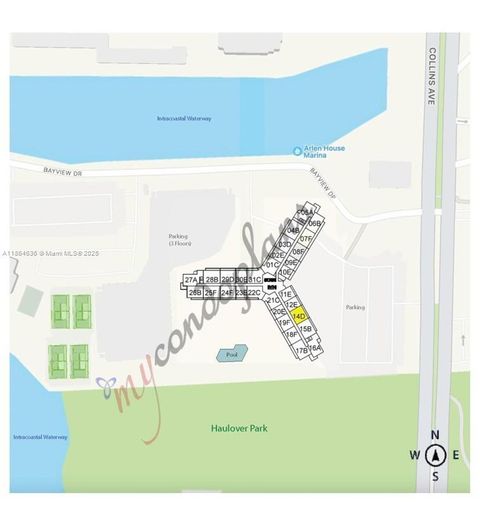
100 Bayview Dr, Sunny Isles Beach, FL 33160
$-2,622
Cash flow
-22.6%
Cash-on-Cash Return
0.9%
Cap rate
0.6%
Rent to Value Ratio
Active
$699,900
4
bds
|
3
ba
|
2,271
sqft
|
built
2002
16032 SW 63rd Ter, Miami, FL 33193
$-1,336
Cash flow
-10.0%
Cash-on-Cash Return
3.9%
Cap rate
0.6%
Rent to Value Ratio
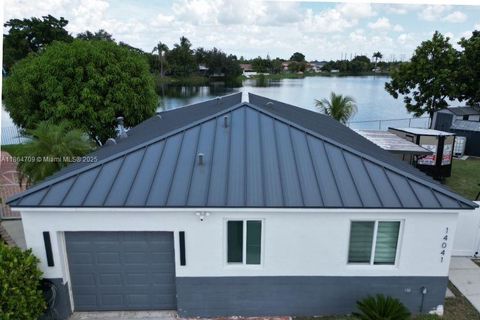
Active
$495,000
3
bds
|
2
ba
|
1,171
sqft
|
built
1995
14041 SW 172nd St, Miami, FL 33177
$-688
Cash flow
-7.3%
Cash-on-Cash Return
4.5%
Cap rate
0.6%
Rent to Value Ratio
Active
$650,000
3
bds
|
2
ba
|
1,489
sqft
|
built
1956
1220 NW 88th St, Miami, FL 33147
$-1,347
Cash flow
-10.8%
Cash-on-Cash Return
3.7%
Cap rate
0.5%
Rent to Value Ratio

Active
$251,000
1
bds
|
1
ba
|
650
sqft
|
built
1965
1150 Euclid Ave, Miami Beach, FL 33139
$-717
Cash flow
-14.9%
Cash-on-Cash Return
2.7%
Cap rate
0.9%
Rent to Value Ratio
Active
$170,000
bds
|
1
ba
|
398
sqft
|
built
1963
7904 West Dr, North Bay Village, FL 33141
$-465
Cash flow
-14.3%
Cash-on-Cash Return
2.9%
Cap rate
1.0%
Rent to Value Ratio

Active
$210,000
1
bds
|
1
ba
|
470
sqft
|
built
1940
750 Jefferson Ave, Miami Beach, FL 33139
$-469
Cash flow
-11.7%
Cash-on-Cash Return
3.5%
Cap rate
1.0%
Rent to Value Ratio
Active
$280,000
2
bds
|
2
ba
|
955
sqft
|
built
1968
10748 N Kendall Dr, Miami, FL 33176
$-643
Cash flow
-12.0%
Cash-on-Cash Return
3.4%
Cap rate
0.8%
Rent to Value Ratio
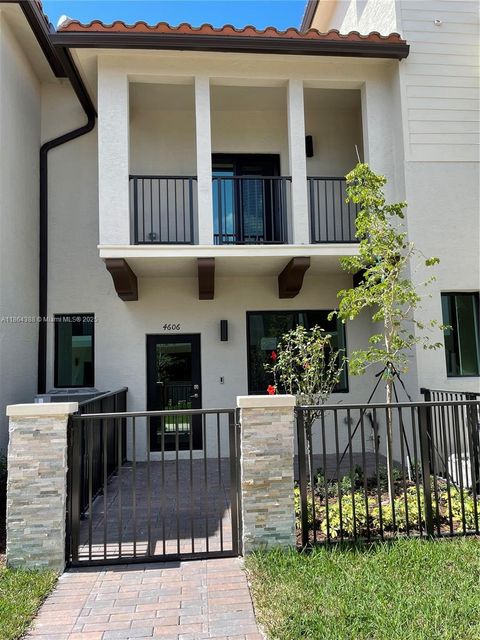
Active
$634,000
3
bds
|
3
ba
|
1,424
sqft
|
built
2022
4606 NW 83rd Path, Doral, FL 33166
$-1,767
Cash flow
-14.5%
Cash-on-Cash Return
2.8%
Cap rate
0.6%
Rent to Value Ratio
Active
$325,000
2
bds
|
2
ba
|
1,233
sqft
|
built
1976
301 174th St, Sunny Isles Beach, FL 33160
$-594
Cash flow
-9.5%
Cash-on-Cash Return
4.0%
Cap rate
0.9%
Rent to Value Ratio
Active
$710,000
3
bds
|
2
ba
|
1,539
sqft
|
built
1996
16886 SW 143rd Pl, Miami, FL 33177
$-1,164
Cash flow
-8.6%
Cash-on-Cash Return
4.2%
Cap rate
0.5%
Rent to Value Ratio
Active
$615,720
3
bds
|
2
ba
|
2,159
sqft
|
built
1956
1070 NW 149th St, Miami, FL 33168
$-965
Cash flow
-8.2%
Cash-on-Cash Return
4.3%
Cap rate
0.6%
Rent to Value Ratio
Active
$2,900,000
3
bds
|
4
ba
|
2,547
sqft
|
built
2013
9400 W Bay Harbor Dr, Bay Harbor Islands, FL 33154
$-12,422
Cash flow
-22.3%
Cash-on-Cash Return
1.0%
Cap rate
0.4%
Rent to Value Ratio
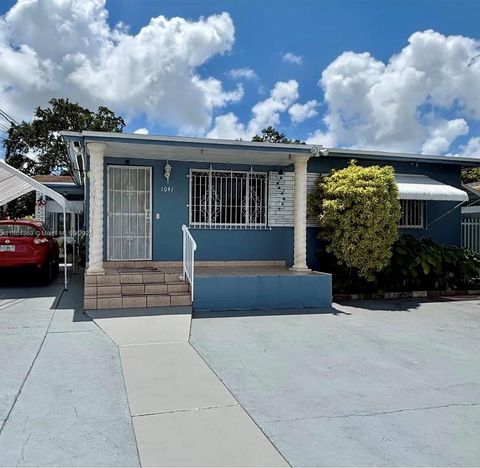
Active
$699,999
3
bds
|
0
ba
|
1,776
sqft
|
built
1962
1041 NW 33rd Ave, Miami, FL 33125
$-1,343
Cash flow
-10.0%
Cash-on-Cash Return
3.8%
Cap rate
0.5%
Rent to Value Ratio
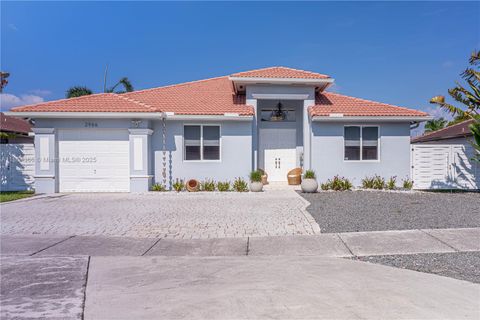
Active
$980,000
3
bds
|
3
ba
|
1,941
sqft
|
built
2003
2966 SW 145th Ave, Miami, FL 33175
$-1,206
Cash flow
-6.4%
Cash-on-Cash Return
4.7%
Cap rate
0.7%
Rent to Value Ratio

Active
$450,000
2
bds
|
2
ba
|
950
sqft
|
built
1925
1018 Meridian Ave, Miami Beach, FL 33139
$-1,231
Cash flow
-14.3%
Cash-on-Cash Return
2.9%
Cap rate
0.8%
Rent to Value Ratio

Active
$475,000
2
bds
|
2
ba
|
878
sqft
|
built
1972
1455 West Ave, Miami Beach, FL 33139
$-1,568
Cash flow
-17.2%
Cash-on-Cash Return
2.2%
Cap rate
0.7%
Rent to Value Ratio
Active
$979,000
5
bds
|
5
ba
|
4,549
sqft
|
built
1999
15051 SW 149th St, Miami, FL 33196
$-3,714
Cash flow
-19.8%
Cash-on-Cash Return
1.6%
Cap rate
0.4%
Rent to Value Ratio
Active
$899,000
3
bds
|
2
ba
|
1,767
sqft
|
built
1959
3021 SW 97th Ave, Miami, FL 33165
$-1,560
Cash flow
-9.1%
Cash-on-Cash Return
4.1%
Cap rate
0.6%
Rent to Value Ratio
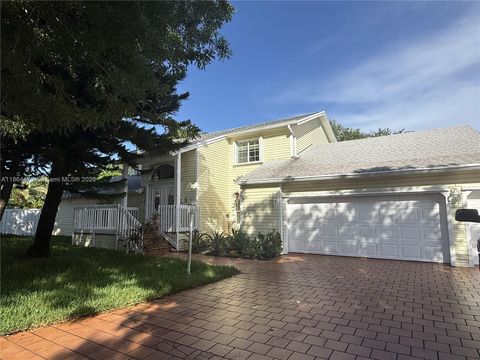
Active
$888,000
4
bds
|
2
ba
|
1,715
sqft
|
built
1959
7310 SW 31st St, Miami, FL 33155
$-2,430
Cash flow
-14.3%
Cash-on-Cash Return
2.9%
Cap rate
0.4%
Rent to Value Ratio
Active
$879,000
2
bds
|
2
ba
|
1,101
sqft
|
built
2008
950 Brickell Bay Dr, Miami, FL 33131
$-2,937
Cash flow
-17.4%
Cash-on-Cash Return
2.1%
Cap rate
0.6%
Rent to Value Ratio
Active
$385,000
2
bds
|
2
ba
|
1,130
sqft
|
built
1984
7680 SW 156th Ct, Miami, FL 33193
$-964
Cash flow
-13.1%
Cash-on-Cash Return
3.1%
Cap rate
0.6%
Rent to Value Ratio
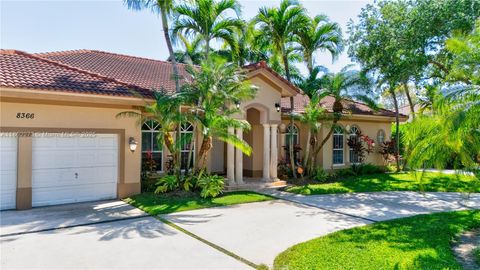
Active
$1,250,000
5
bds
|
4
ba
|
2,805
sqft
|
built
2002
8366 SW 193rd St, Cutler Bay, FL 33157
$-2,977
Cash flow
-12.4%
Cash-on-Cash Return
3.3%
Cap rate
0.5%
Rent to Value Ratio