Morgan County Investment Properties for Sale
Browse homes for sale and investment properties in Morgan County. Refine your search by price, property type, or more.
Best cash flowing properties in Morgan County
Active
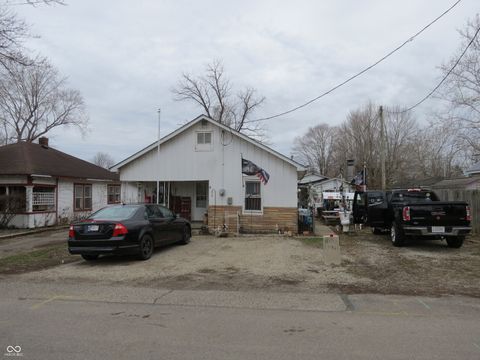
$124,000
2
bds
|
0
ba
|
0
sqft
|
built
1932
450 Hoosier St, Morgantown, IN 46160
$319
Cash flow
13.4%
Cash-on-Cash Return
9.3%
Cap rate
1.1%
Rent to Value Ratio
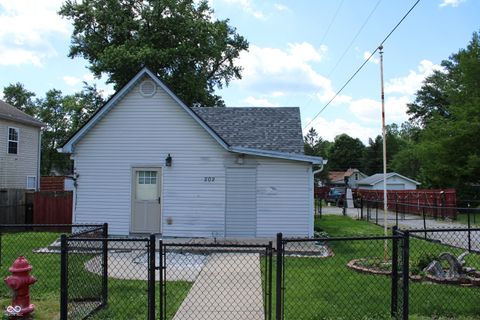
Active
$150,000
1
bds
|
1
ba
|
1,129
sqft
|
built
1908
202 S Church St, Brooklyn, IN 46111
$198
Cash flow
6.9%
Cash-on-Cash Return
7.7%
Cap rate
0.9%
Rent to Value Ratio
96 out of 119 properties for sale in Morgan County
Limited Results Shown
Create a free account, or log in to reveal all property listings and enjoy the complete experience.
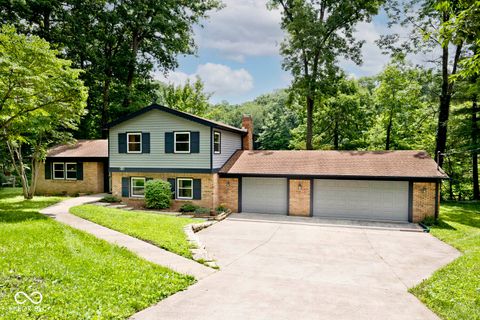
Active
$499,900
4
bds
|
4
ba
|
2,302
sqft
|
built
1964
3545 Whippoorwill Lake North Dr, Monrovia, IN 46157
$-773
Cash flow
-8.1%
Cash-on-Cash Return
4.3%
Cap rate
0.5%
Rent to Value Ratio
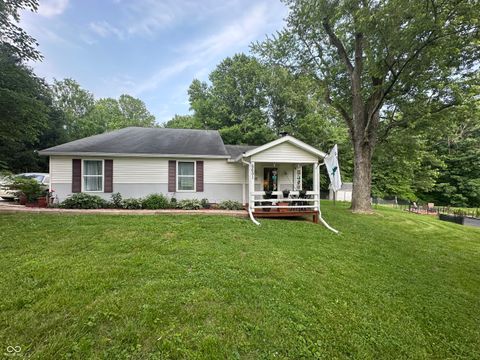
Active
$349,900
3
bds
|
2
ba
|
2,246
sqft
|
built
1956
6691 N Baltimore Rd, Monrovia, IN 46157
$-412
Cash flow
-6.1%
Cash-on-Cash Return
4.7%
Cap rate
0.6%
Rent to Value Ratio
Active
$381,900
3
bds
|
2
ba
|
1,622
sqft
|
built
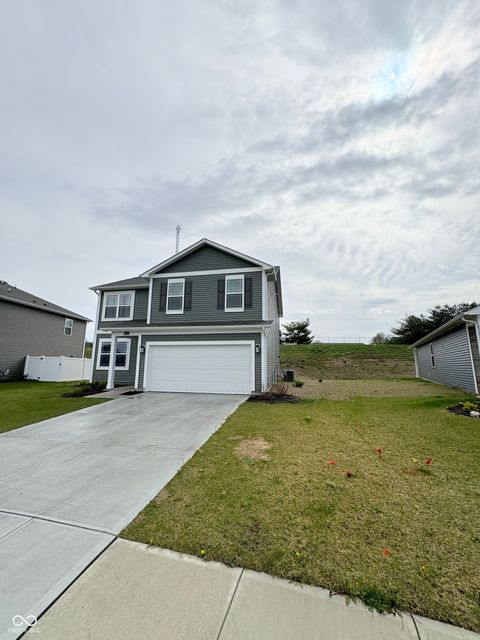
2022
217 N Liberty Blvd, Mooresville, IN 46158
$-311
Cash flow
-4.2%
Cash-on-Cash Return
5.3%
Cap rate
0.7%
Rent to Value Ratio
Active
$324,900
4
bds
|
3
ba
|
1,848
sqft
|
built
2000
101 Meadowview Dr, Mooresville, IN 46158
$-203
Cash flow
-3.3%
Cash-on-Cash Return
5.5%
Cap rate
0.7%
Rent to Value Ratio
Active
$665,000
5
bds
|
4
ba
|
4,397
sqft
|
built
2002
7221 State Road 42, Martinsville, IN 46151
$-1,057
Cash flow
-8.3%
Cash-on-Cash Return
4.4%
Cap rate
0.5%
Rent to Value Ratio
Active
$247,500
3
bds
|
2
ba
|
1,739
sqft
|
built
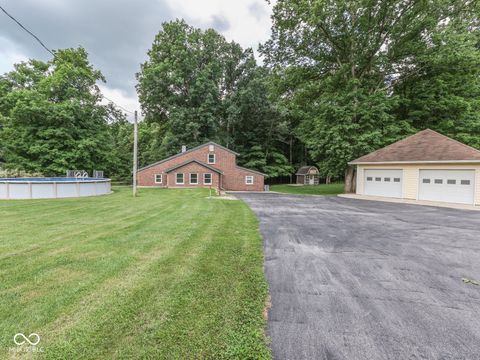
1974
6373 E Hadley Rd, Mooresville, IN 46158
$88
Cash flow
1.9%
Cash-on-Cash Return
6.7%
Cap rate
0.8%
Rent to Value Ratio
Active
$349,000
3
bds
|
3
ba
|
2,863
sqft
|
built
1976
8465 Hilltop Ln, Martinsville, IN 46151
$-442
Cash flow
-6.6%
Cash-on-Cash Return
4.7%
Cap rate
0.6%
Rent to Value Ratio
Active
$675,000
5
bds
|
2
ba
|
3,442
sqft
|
built
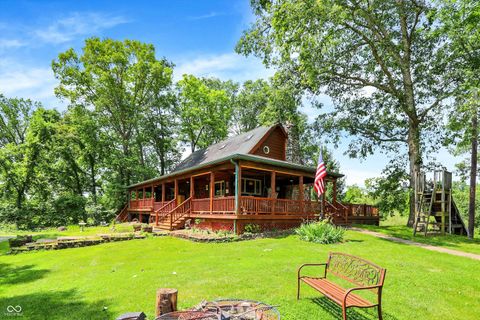
1869
1901 S Old State Road 67, Paragon, IN 46166
$-1,526
Cash flow
-11.8%
Cash-on-Cash Return
3.4%
Cap rate
0.4%
Rent to Value Ratio
Active
$799,000
4
bds
|
4
ba
|
5,766
sqft
|
built
1993
6780 E Woodland Ct, Mooresville, IN 46158
$-1,794
Cash flow
-11.7%
Cash-on-Cash Return
3.6%
Cap rate
0.4%
Rent to Value Ratio
Active
$534,900
4
bds
|
4
ba
|
4,108
sqft
|
built
1973
12166 N Bray Rd, Mooresville, IN 46158
$-309
Cash flow
-3.0%
Cash-on-Cash Return
5.6%
Cap rate
0.7%
Rent to Value Ratio
Active
$799,000
3
bds
|
4
ba
|
3,140
sqft
|
built
2001
600 Old Moore Rd, Martinsville, IN 46151
$-2,446
Cash flow
-16.0%
Cash-on-Cash Return
2.6%
Cap rate
0.3%
Rent to Value Ratio
Active
$299,501
3
bds
|
3
ba
|
1,800
sqft
|
built
1995
660 White Ash Trl, Mooresville, IN 46158
$-184
Cash flow
-3.2%
Cash-on-Cash Return
5.5%
Cap rate
0.7%
Rent to Value Ratio
Active
$975,000
5
bds
|
4
ba
|
3,713
sqft
|
built
1983
2001 E Ely Ct, Martinsville, IN 46151
$-3,030
Cash flow
-16.2%
Cash-on-Cash Return
2.5%
Cap rate
0.3%
Rent to Value Ratio
Active
$559,900
4
bds
|
4
ba
|
5,244
sqft
|
built
1997
505 Jones Pl, Martinsville, IN 46151
$-1,001
Cash flow
-9.3%
Cash-on-Cash Return
4.1%
Cap rate
0.5%
Rent to Value Ratio
Active
$323,500
4
bds
|
3
ba
|
3,294
sqft
|
built
2023
10931 N Longbranch St, Monrovia, IN 46157
$-108
Cash flow
-1.7%
Cash-on-Cash Return
5.7%
Cap rate
0.7%
Rent to Value Ratio
Active
$370,000
3
bds
|
2
ba
|
2,188
sqft
|
built
1988
6295 State Road 142, Martinsville, IN 46151
$-653
Cash flow
-9.2%
Cash-on-Cash Return
4.0%
Cap rate
0.5%
Rent to Value Ratio

Active
$975,000
5
bds
|
5
ba
|
3,871
sqft
|
built
2010
11262 N Everett Rd, Monrovia, IN 46157
$-1,889
Cash flow
-10.1%
Cash-on-Cash Return
3.8%
Cap rate
0.5%
Rent to Value Ratio

Active
$750,000
4
bds
|
3
ba
|
2,937
sqft
|
built
1990
8654 N Baltimore Rd, Monrovia, IN 46157
$-1,979
Cash flow
-13.8%
Cash-on-Cash Return
3.0%
Cap rate
0.4%
Rent to Value Ratio
Active
$314,000
3
bds
|
2
ba
|
1,362
sqft
|
built
1991
12113 N Rooker Rd, Mooresville, IN 46158
$-297
Cash flow
-4.9%
Cash-on-Cash Return
5.0%
Cap rate
0.6%
Rent to Value Ratio

Active
$215,000
5
bds
|
2
ba
|
1,638
sqft
|
built
1930
689 N Main St, Martinsville, IN 46151
$-156
Cash flow
-3.8%
Cash-on-Cash Return
5.4%
Cap rate
0.7%
Rent to Value Ratio

Active
$239,000
3
bds
|
2
ba
|
1,315
sqft
|
built
1981
8855 N Waverly Park Rd, Martinsville, IN 46151
$-144
Cash flow
-3.1%
Cash-on-Cash Return
5.5%
Cap rate
0.7%
Rent to Value Ratio
Active
$994,900
5
bds
|
2
ba
|
3,180
sqft
|
built
1979
1155 Cope Rd, Martinsville, IN 46151
$-2,503
Cash flow
-13.1%
Cash-on-Cash Return
3.2%
Cap rate
0.4%
Rent to Value Ratio
Active
$345,000
2
bds
|
2
ba
|
2,026
sqft
|
built
1967
5850 Paradise Ln, Martinsville, IN 46151
$-326
Cash flow
-4.9%
Cash-on-Cash Return
5.1%
Cap rate
0.6%
Rent to Value Ratio
Active
$650,000
3
bds
|
3
ba
|
2,585
sqft
|
built
1970
1927 E Derby Ct, Martinsville, IN 46151
$-1,958
Cash flow
-15.7%
Cash-on-Cash Return
2.5%
Cap rate
0.3%
Rent to Value Ratio
Active
$375,000
3
bds
|
2
ba
|
1,544
sqft
|
built
1975
1980 S Arthur Rd, Paragon, IN 46166
$-679
Cash flow
-9.4%
Cash-on-Cash Return
4.0%
Cap rate
0.5%
Rent to Value Ratio
Active
$445,000
4
bds
|
2
ba
|
2,789
sqft
|
built
1980
4419 Liberty Loop Rd, Martinsville, IN 46151
$-391
Cash flow
-4.6%
Cash-on-Cash Return
5.2%
Cap rate
0.6%
Rent to Value Ratio
Active
$540,000
3
bds
|
4
ba
|
3,472
sqft
|
built
2001
4590 Turkey Track Rd, Martinsville, IN 46151
$-611
Cash flow
-5.9%
Cash-on-Cash Return
4.9%
Cap rate
0.6%
Rent to Value Ratio

Active
$149,900
2
bds
|
1
ba
|
1,120
sqft
|
built
1967
210 Evergreen St, Morgantown, IN 46160
$183
Cash flow
6.4%
Cash-on-Cash Return
7.7%
Cap rate
0.9%
Rent to Value Ratio
Active
$330,000
3
bds
|
2
ba
|
2,296
sqft
|
built
1992
1165 Tewksbury Ct, Mooresville, IN 46158
$-138
Cash flow
-2.2%
Cash-on-Cash Return
5.8%
Cap rate
0.7%
Rent to Value Ratio
Active
$244,900
3
bds
|
2
ba
|
1,398
sqft
|
built
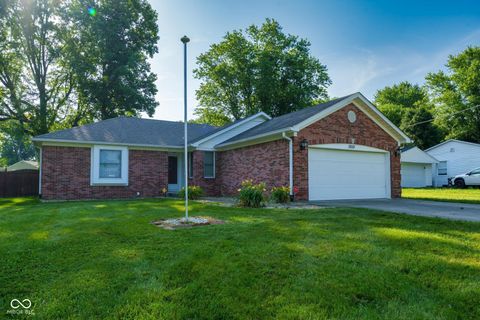
1995
741 Springmill Dr, Mooresville, IN 46158
$32
Cash flow
0.7%
Cash-on-Cash Return
6.4%
Cap rate
0.8%
Rent to Value Ratio
Active
$445,000
4
bds
|
3
ba
|
2,452
sqft
|
built
2006
911 Centennial Rd, Martinsville, IN 46151
$-805
Cash flow
-9.4%
Cash-on-Cash Return
4.1%
Cap rate
0.5%
Rent to Value Ratio
Active
$424,900
4
bds
|
4
ba
|
2,881
sqft
|
built
1987
530 Denny Dr, Mooresville, IN 46158
$-424
Cash flow
-5.2%
Cash-on-Cash Return
5.1%
Cap rate
0.6%
Rent to Value Ratio
Active
$369,900
3
bds
|
2
ba
|
1,920
sqft
|
built
2019
3072 Glacier Dr, Monrovia, IN 46157
$-408
Cash flow
-5.8%
Cash-on-Cash Return
4.8%
Cap rate
0.6%
Rent to Value Ratio
Active
$450,000
5
bds
|
2
ba
|
2,438
sqft
|
built
1910
7561 N Hall School Rd, Monrovia, IN 46157
$-718
Cash flow
-8.3%
Cash-on-Cash Return
4.2%
Cap rate
0.5%
Rent to Value Ratio
Active
$539,900
4
bds
|
3
ba
|
2,996
sqft
|
built
2004
5055 Turkey Track Rd, Martinsville, IN 46151
$-765
Cash flow
-7.4%
Cash-on-Cash Return
4.4%
Cap rate
0.5%
Rent to Value Ratio
Active
$844,000
4
bds
|
3
ba
|
3,576
sqft
|
built
1971
4126 E Rembrandt Dr, Martinsville, IN 46151
$-2,815
Cash flow
-17.4%
Cash-on-Cash Return
2.1%
Cap rate
0.3%
Rent to Value Ratio

Active
$350,000
3
bds
|
3
ba
|
2,175
sqft
|
built
1860
379 N Marion St, Morgantown, IN 46160
$-447
Cash flow
-6.7%
Cash-on-Cash Return
4.7%
Cap rate
0.6%
Rent to Value Ratio
Active
$364,900
3
bds
|
2
ba
|
2,184
sqft
|
built
1995
1135 W Wildflower Ct, Mooresville, IN 46158
$-119
Cash flow
-1.7%
Cash-on-Cash Return
5.9%
Cap rate
0.7%
Rent to Value Ratio