Minnesota Investment Properties for Sale
Browse homes for sale and investment properties in Minnesota. Refine your search by price, property type, or more.
Best cash flowing properties in Minnesota
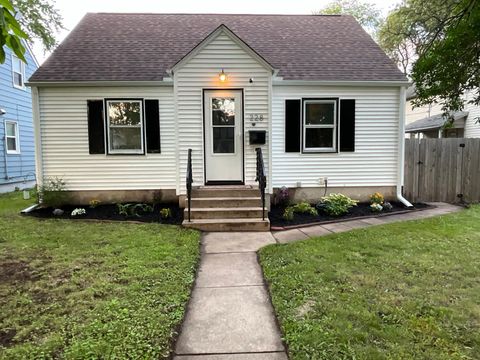
Active
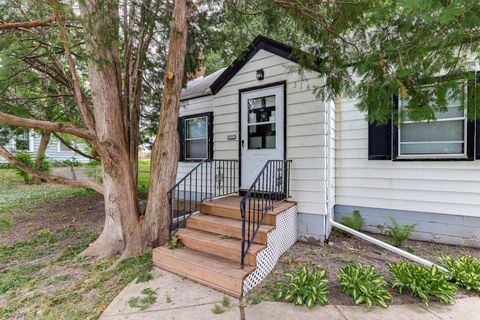
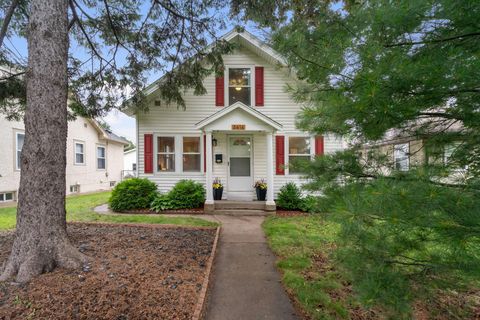
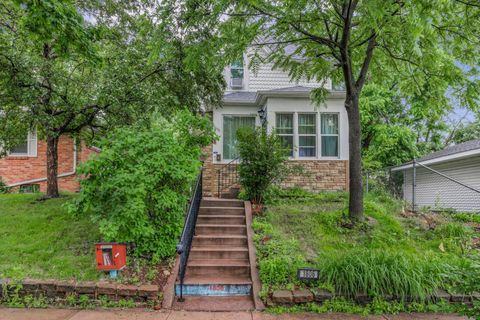
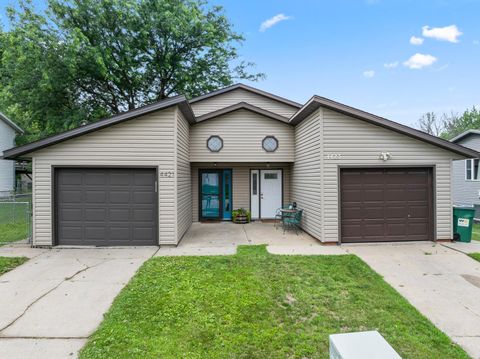
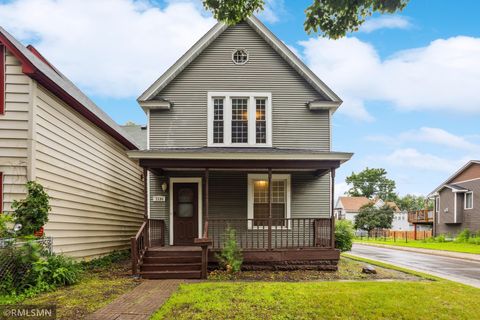
$210,000
4
bds
|
1
ba
|
1,165
sqft
|
built
1946
316 Curtice St W, Saint Paul, MN 55107
$246
Cash flow
6.1%
Cash-on-Cash Return
7.1%
Cap rate
1.0%
Rent to Value Ratio
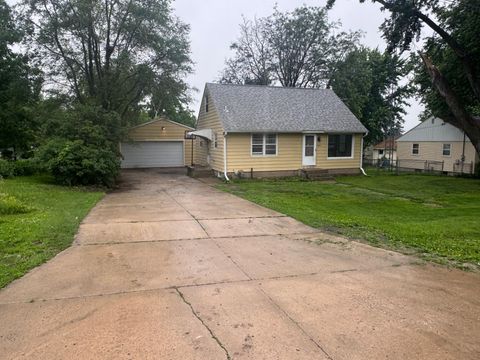
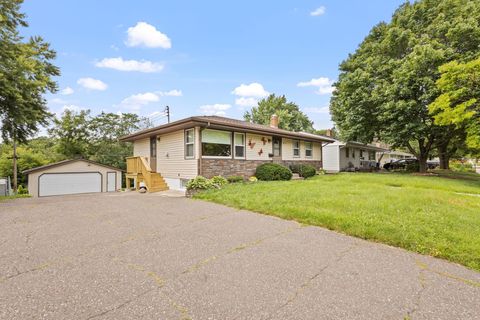
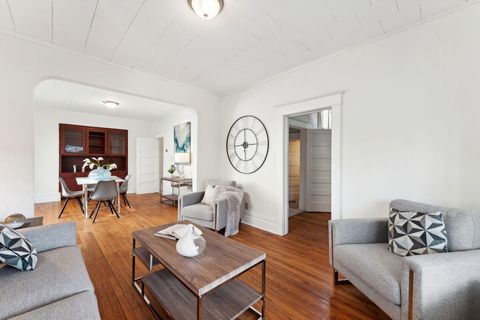
Active
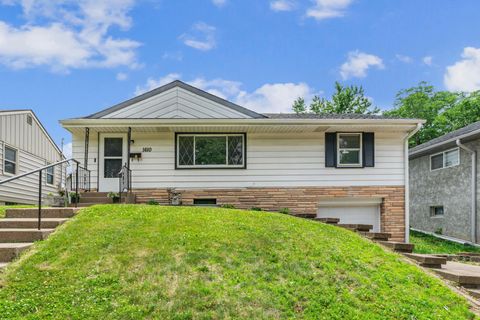
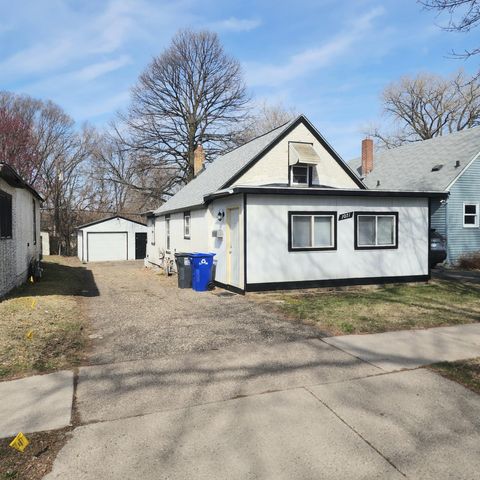
$249,900
3
bds
|
1
ba
|
1,248
sqft
|
built
1956
2100 14th St SE, Rochester, MN 55904
$181
Cash flow
3.8%
Cash-on-Cash Return
6.5%
Cap rate
0.9%
Rent to Value Ratio
5,969 out of 15,711 properties for sale in Minnesota
Limited Results Shown
Create a free account, or log in to reveal all property listings and enjoy the complete experience.
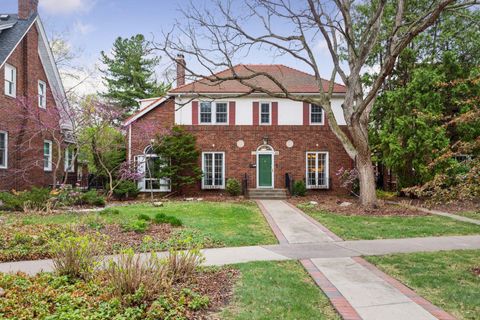
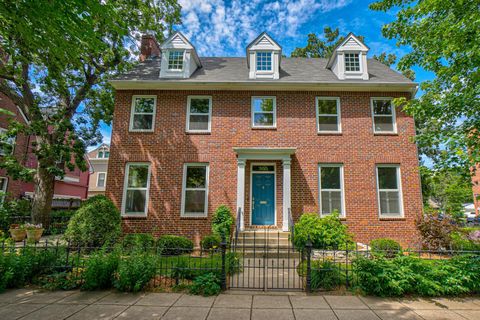
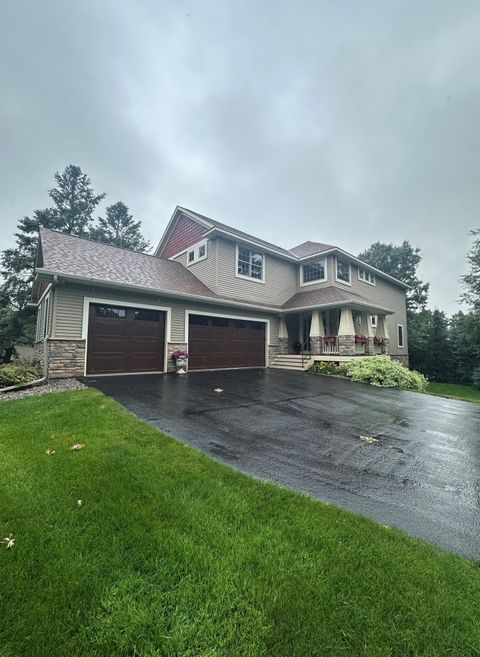
Active
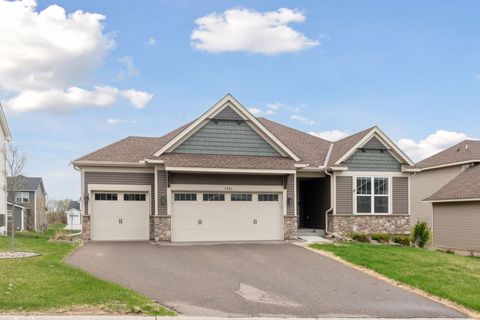
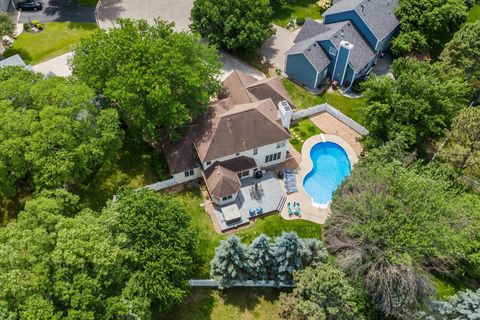
$885,000
4
bds
|
3
ba
|
3,254
sqft
|
built
1925
26 Mississippi River Blvd N, Saint Paul, MN 55104
$-2,363
Cash flow
-13.9%
Cash-on-Cash Return
2.5%
Cap rate
0.5%
Rent to Value Ratio
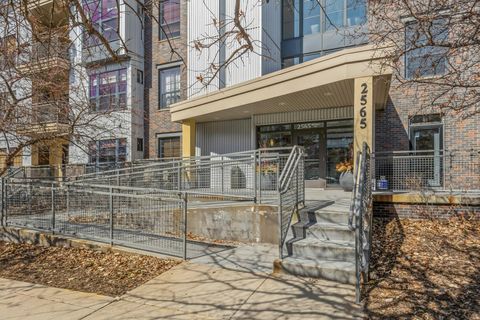
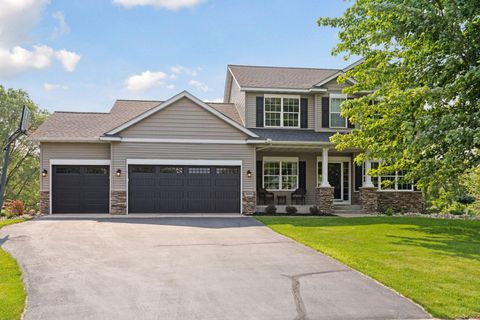
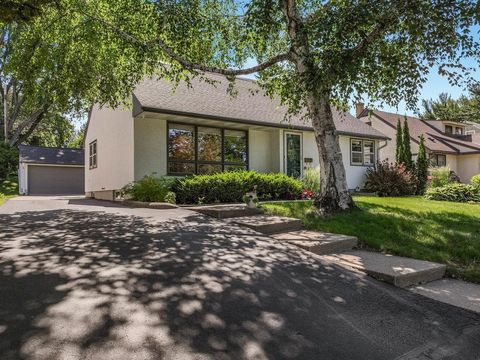
Active
$245,000
1
bds
|
2
ba
|
1,035
sqft
|
built
2005
2565 Franklin Ave, Saint Paul, MN 55114
$-565
Cash flow
-12.0%
Cash-on-Cash Return
2.9%
Cap rate
0.8%
Rent to Value Ratio
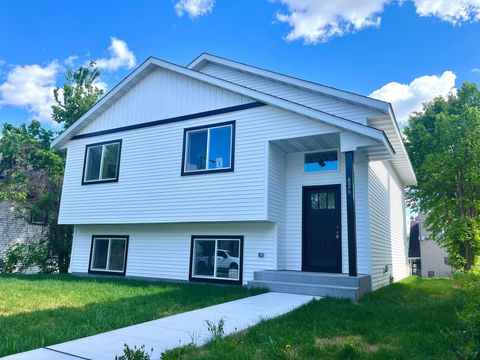
Active
$389,900
4
bds
|
2
ba
|
2,000
sqft
|
built
2025
826 Sims Ave, Saint Paul, MN 55106
$-634
Cash flow
-8.5%
Cash-on-Cash Return
3.7%
Cap rate
0.5%
Rent to Value Ratio
Active
$519,900
4
bds
|
3
ba
|
2,587
sqft
|
built
1925
6015 Clinton Ave, Minneapolis, MN 55419
$-2,029
Cash flow
-20.4%
Cash-on-Cash Return
1.6%
Cap rate
0.3%
Rent to Value Ratio
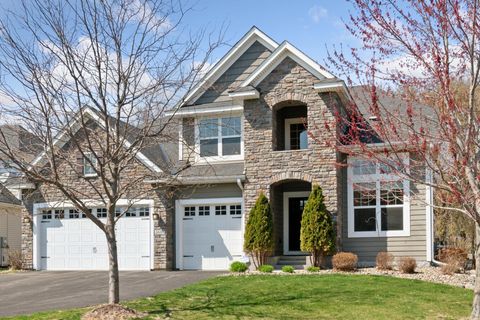
Active
$845,000
4
bds
|
4
ba
|
3,401
sqft
|
built
2015
3608 Strawberry Ln, Excelsior, MN 55331
$-1,760
Cash flow
-10.9%
Cash-on-Cash Return
3.2%
Cap rate
0.5%
Rent to Value Ratio
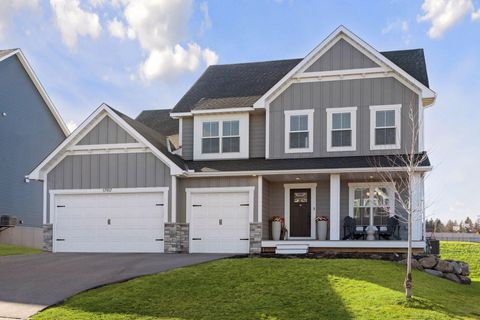
Active
$749,900
5
bds
|
4
ba
|
3,157
sqft
|
built
2021
17917 Hayes Ave, Lakeville, MN 55044
$-1,573
Cash flow
-10.9%
Cash-on-Cash Return
3.2%
Cap rate
0.5%
Rent to Value Ratio
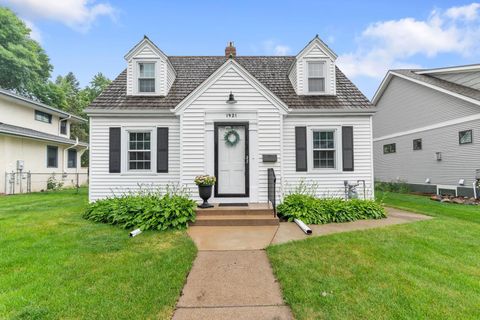
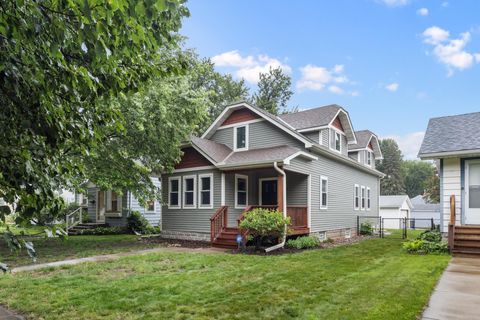
Active
$415,000
3
bds
|
2
ba
|
1,380
sqft
|
built
1939
1921 James Ave, Saint Paul, MN 55105
$-791
Cash flow
-9.9%
Cash-on-Cash Return
4.0%
Cap rate
0.7%
Rent to Value Ratio
Active
$525,000
4
bds
|
4
ba
|
2,562
sqft
|
built
2002
14004 52nd Ave N, Minneapolis, MN 55446
$-831
Cash flow
-8.3%
Cash-on-Cash Return
3.8%
Cap rate
0.6%
Rent to Value Ratio
Active
$400,000
3
bds
|
2
ba
|
1,801
sqft
|
built
1953
3518 Tyler St NE, Minneapolis, MN 55418
$-362
Cash flow
-4.7%
Cash-on-Cash Return
4.6%
Cap rate
0.7%
Rent to Value Ratio
Active
$419,900
3
bds
|
2
ba
|
1,864
sqft
|
built
1986
13838 Glendale Trl, Savage, MN 55378
$-948
Cash flow
-11.8%
Cash-on-Cash Return
3.6%
Cap rate
0.5%
Rent to Value Ratio
Active
$249,900
3
bds
|
1
ba
|
1,248
sqft
|
built
1956
2100 14th St SE, Rochester, MN 55904
$181
Cash flow
3.8%
Cash-on-Cash Return
6.5%
Cap rate
0.9%
Rent to Value Ratio
Active
$299,000
3
bds
|
1
ba
|
1,214
sqft
|
built
1923
5616 36th Ave S, Minneapolis, MN 55417
$-162
Cash flow
-2.8%
Cash-on-Cash Return
5.0%
Cap rate
0.8%
Rent to Value Ratio
Active
$299,999
4
bds
|
2
ba
|
2,088
sqft
|
built
1970
2671 4th Ave NE, Rochester, MN 55906
$-134
Cash flow
-2.3%
Cash-on-Cash Return
5.1%
Cap rate
0.7%
Rent to Value Ratio
Active
$259,900
2
bds
|
1
ba
|
1,363
sqft
|
built
1955
1610 Idaho Ave E, Saint Paul, MN 55106
$-200
Cash flow
-4.0%
Cash-on-Cash Return
4.8%
Cap rate
0.8%
Rent to Value Ratio
Active
$629,900
4
bds
|
3
ba
|
3,406
sqft
|
built
2020
5743 Meridian Way NE, Prior Lake, MN 55372
$-1,304
Cash flow
-10.8%
Cash-on-Cash Return
3.2%
Cap rate
0.6%
Rent to Value Ratio
Active
$340,000
3
bds
|
3
ba
|
1,618
sqft
|
built
1880
1806 Van Buren Ave, Saint Paul, MN 55104
$-809
Cash flow
-12.4%
Cash-on-Cash Return
3.4%
Cap rate
0.4%
Rent to Value Ratio
Active
$850,000
4
bds
|
3
ba
|
3,282
sqft
|
built
1987
355 Laurel Ave, Saint Paul, MN 55102
$-2,834
Cash flow
-17.4%
Cash-on-Cash Return
2.3%
Cap rate
0.5%
Rent to Value Ratio
Active
$335,000
3
bds
|
1
ba
|
1,414
sqft
|
built
1957
1377 Clarence St, Saint Paul, MN 55106
$-413
Cash flow
-6.4%
Cash-on-Cash Return
4.2%
Cap rate
0.7%
Rent to Value Ratio
Active
$459,900
9
bds
|
2
ba
|
3,322
sqft
|
built
1905
690 Western Ave N, Saint Paul, MN 55103
$-796
Cash flow
-9.0%
Cash-on-Cash Return
3.6%
Cap rate
0.4%
Rent to Value Ratio
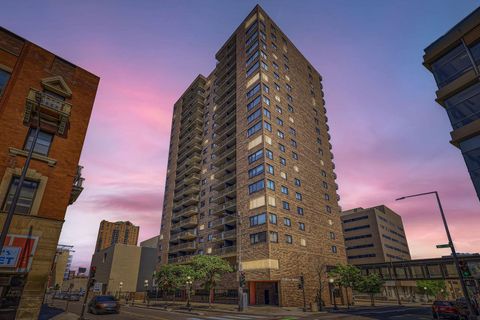
Active
$120,000
1
bds
|
1
ba
|
828
sqft
|
built
1980
26 10th St W, Saint Paul, MN 55102
$-130
Cash flow
-5.7%
Cash-on-Cash Return
4.4%
Cap rate
1.5%
Rent to Value Ratio
Active
$220,000
3
bds
|
2
ba
|
1,682
sqft
|
built
1939
228 4th Ave NE, Saint Cloud, MN 56304
$17
Cash flow
0.4%
Cash-on-Cash Return
5.8%
Cap rate
0.8%
Rent to Value Ratio
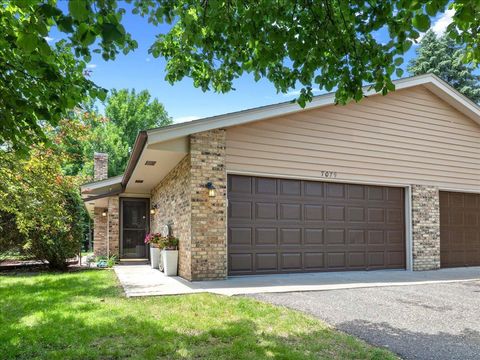
Active
$289,900
2
bds
|
1
ba
|
976
sqft
|
built
1985
7079 Robinwood Trl, Woodbury, MN 55125
$-883
Cash flow
-15.9%
Cash-on-Cash Return
2.6%
Cap rate
0.6%
Rent to Value Ratio
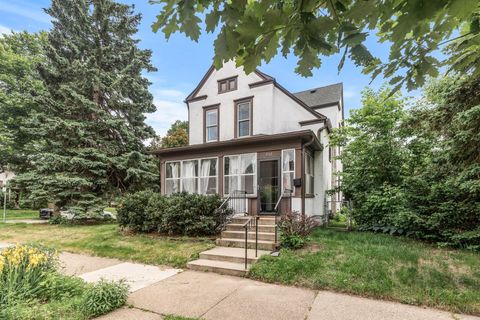
Active
$374,900
3
bds
|
3
ba
|
1,815
sqft
|
built
1906
956 23rd Ave NE, Minneapolis, MN 55418
$-290
Cash flow
-4.0%
Cash-on-Cash Return
5.3%
Cap rate
0.8%
Rent to Value Ratio
Active
$185,000
2
bds
|
1
ba
|
1,004
sqft
|
built
1979
4421 13th Ave NW, Rochester, MN 55901
$-53
Cash flow
-1.5%
Cash-on-Cash Return
5.3%
Cap rate
0.8%
Rent to Value Ratio
Active
$309,900
3
bds
|
1
ba
|
1,221
sqft
|
built
1905
786 Iglehart Ave, Saint Paul, MN 55104
$-526
Cash flow
-8.9%
Cash-on-Cash Return
4.2%
Cap rate
0.6%
Rent to Value Ratio
Active
$849,000
4
bds
|
4
ba
|
3,833
sqft
|
built
2006
2175 Acorn Rd, Roseville, MN 55113
$-1,784
Cash flow
-11.0%
Cash-on-Cash Return
3.2%
Cap rate
0.5%
Rent to Value Ratio
Active
$499,900
4
bds
|
3
ba
|
2,365
sqft
|
built
2003
14896 Brenner Ct, Rosemount, MN 55068
$-663
Cash flow
-6.9%
Cash-on-Cash Return
4.1%
Cap rate
0.6%
Rent to Value Ratio
Active
$699,000
5
bds
|
5
ba
|
4,345
sqft
|
built
2020
10914 23rd St NE, Saint Michael, MN 55376
$-1,359
Cash flow
-10.1%
Cash-on-Cash Return
3.9%
Cap rate
0.6%
Rent to Value Ratio
Active
$574,900
4
bds
|
3
ba
|
2,500
sqft
|
built
1977
11461 Pinto Cir, Lakeville, MN 55044
$-916
Cash flow
-8.3%
Cash-on-Cash Return
3.8%
Cap rate
0.6%
Rent to Value Ratio
Active
$785,000
5
bds
|
4
ba
|
3,529
sqft
|
built
2023
5120 Coronado Dr, Woodbury, MN 55129
$-512
Cash flow
-3.4%
Cash-on-Cash Return
4.9%
Cap rate
0.6%
Rent to Value Ratio
Active
$210,000
4
bds
|
1
ba
|
1,165
sqft
|
built
1946
316 Curtice St W, Saint Paul, MN 55107
$246
Cash flow
6.1%
Cash-on-Cash Return
7.1%
Cap rate
1.0%
Rent to Value Ratio
Active
$320,000
3
bds
|
2
ba
|
1,352
sqft
|
built
2015
9185 Golden Pond Ln N, Monticello, MN 55362
$-282
Cash flow
-4.6%
Cash-on-Cash Return
4.6%
Cap rate
0.7%
Rent to Value Ratio
Active
$359,000
4
bds
|
2
ba
|
1,810
sqft
|
built
1900
1134 Lincoln St NE, Minneapolis, MN 55413
$-532
Cash flow
-7.7%
Cash-on-Cash Return
3.9%
Cap rate
0.6%
Rent to Value Ratio
Active
$209,900
3
bds
|
1
ba
|
995
sqft
|
built
1908
1071 Norton St, Saint Paul, MN 55117
$34
Cash flow
0.8%
Cash-on-Cash Return
5.9%
Cap rate
0.9%
Rent to Value Ratio
Active
$600,000
4
bds
|
3
ba
|
3,311
sqft
|
built
1989
3505 Rae Ct, Woodbury, MN 55125
$-1,331
Cash flow
-11.6%
Cash-on-Cash Return
3.6%
Cap rate
0.6%
Rent to Value Ratio
Active
$400,000
4
bds
|
3
ba
|
2,654
sqft
|
built
1959
1390 Clarence St, Saint Paul, MN 55106
$-562
Cash flow
-7.3%
Cash-on-Cash Return
4.0%
Cap rate
0.6%
Rent to Value Ratio
Active
$375,000
4
bds
|
2
ba
|
2,032
sqft
|
built
2000
5949 Redbud Ln NW, Rochester, MN 55901
$-50
Cash flow
-0.7%
Cash-on-Cash Return
5.5%
Cap rate
0.7%
Rent to Value Ratio
Active
$374,900
3
bds
|
2
ba
|
1,907
sqft
|
built
1973
20395 Hughes Ave W, Lakeville, MN 55044
$-234
Cash flow
-3.3%
Cash-on-Cash Return
4.9%
Cap rate
0.7%
Rent to Value Ratio
Active
$625,000
4
bds
|
4
ba
|
3,148
sqft
|
built
2020
19145 Indora Trl, Lakeville, MN 55044
$-1,335
Cash flow
-11.1%
Cash-on-Cash Return
3.1%
Cap rate
0.5%
Rent to Value Ratio
Active
$479,900
4
bds
|
4
ba
|
2,140
sqft
|
built
1987
17248 Harrington Way, Lakeville, MN 55044
$-528
Cash flow
-5.7%
Cash-on-Cash Return
4.4%
Cap rate
0.6%
Rent to Value Ratio