Mississippi Investment Properties for Sale
Browse homes for sale and investment properties in Mississippi. Refine your search by price, property type, or more.
Best cash flowing properties in Mississippi
Active
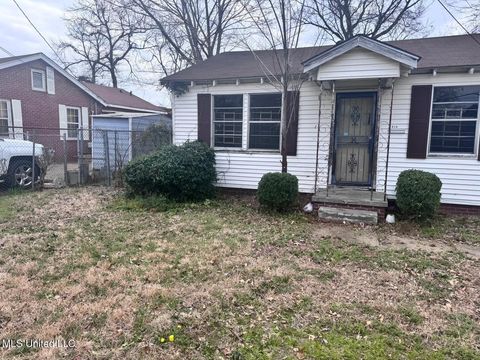
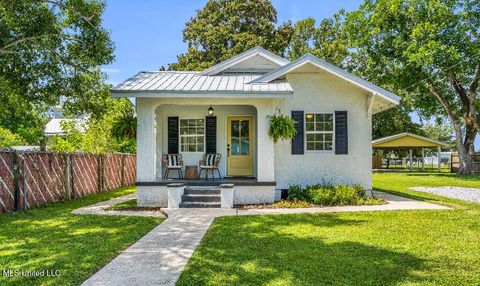
$37,500
2
bds
|
1
ba
|
0
sqft
|
built
1950
1318 Rosemont Ave, Jackson, MS 39204
$867
Cash flow
26.9%
Cash-on-Cash Return
27.7%
Cap rate
3.5%
Rent to Value Ratio
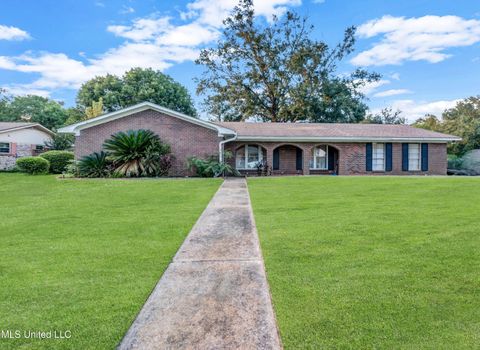
Active
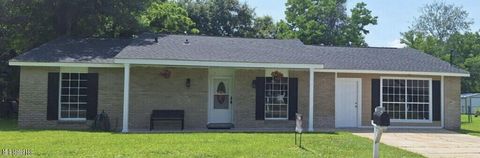
$160,000
4
bds
|
2
ba
|
0
sqft
|
built
1974
15284 Woody Dr, Gulfport, MS 39503
$723
Cash flow
23.6%
Cash-on-Cash Return
11.1%
Cap rate
1.4%
Rent to Value Ratio
2,679 out of 4,559 properties for sale in Mississippi
Limited Results Shown
Create a free account, or log in to reveal all property listings and enjoy the complete experience.

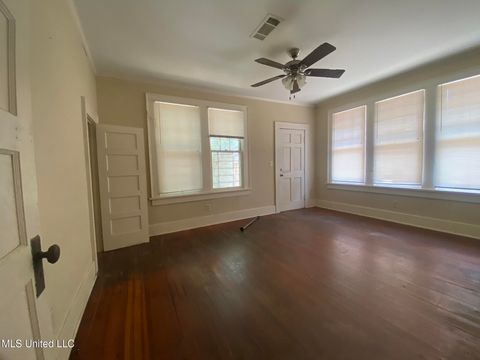
Active
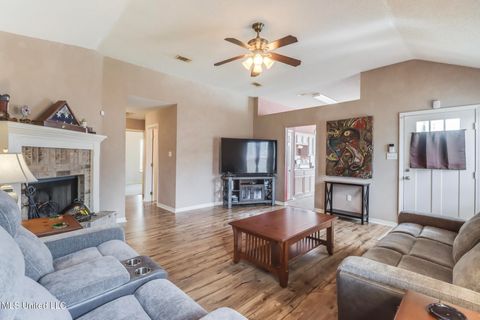
$239,000
2
bds
|
2
ba
|
0
sqft
|
built
1965
808 Mills Ave, Gulfport, MS 39501
$-106
Cash flow
-2.3%
Cash-on-Cash Return
5.7%
Cap rate
0.8%
Rent to Value Ratio
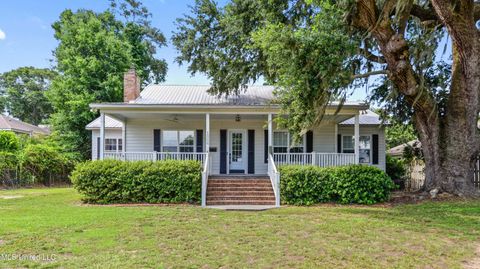
Active
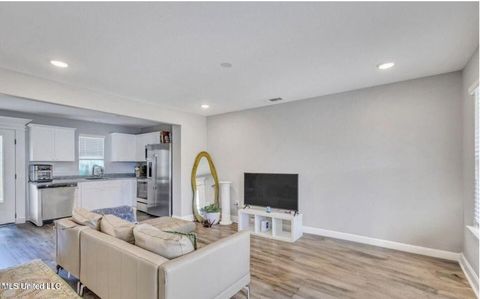
$169,900
4
bds
|
2
ba
|
0
sqft
|
built
1927
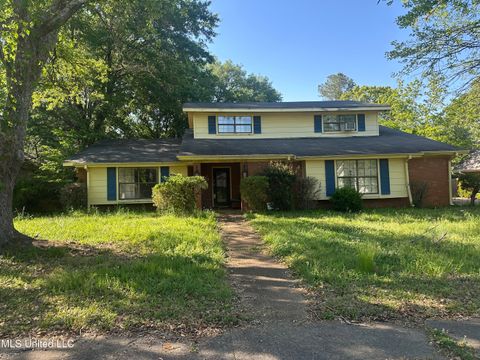
848 Fairview St, Jackson, MS 39202
$340
Cash flow
10.4%
Cash-on-Cash Return
8.1%
Cap rate
1.1%
Rent to Value Ratio
Active
$745,000
3
bds
|
3
ba
|
0
sqft
|
built
2008
1006 Beach Blvd, Biloxi, MS 39530
$-1,707
Cash flow
-12.0%
Cash-on-Cash Return
2.9%
Cap rate
0.4%
Rent to Value Ratio

Active
$535,000
4
bds
|
5
ba
|
0
sqft
|
built
1965
40 54th St, Gulfport, MS 39507
$-901
Cash flow
-8.8%
Cash-on-Cash Return
4.2%
Cap rate
0.6%
Rent to Value Ratio
Active
$258,000
3
bds
|
2
ba
|
0
sqft
|
built
1968
1172 Rockett Dr, Jackson, MS 39212
$499
Cash flow
10.1%
Cash-on-Cash Return
8.0%
Cap rate
1.0%
Rent to Value Ratio
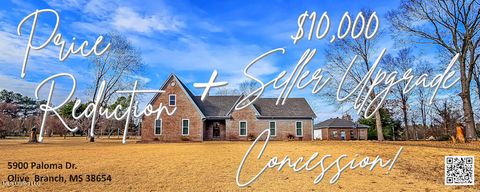
Active
$598,000
5
bds
|
3
ba
|
0
sqft
|
built
1992
5900 Paloma Dr, Olive Branch, MS 38654
$-812
Cash flow
-7.1%
Cash-on-Cash Return
4.0%
Cap rate
0.5%
Rent to Value Ratio
Active
$450,000
3
bds
|
3
ba
|
0
sqft
|
built
1993
23512 Success Rd, Saucier, MS 39574
$-426
Cash flow
-4.9%
Cash-on-Cash Return
4.5%
Cap rate
0.6%
Rent to Value Ratio
Active
$79,900
3
bds
|
1
ba
|
0
sqft
|
built
1963
3511 Bonita Dr, Gulfport, MS 39501
$409
Cash flow
26.7%
Cash-on-Cash Return
12.4%
Cap rate
1.6%
Rent to Value Ratio
Active
$83,000
3
bds
|
2
ba
|
0
sqft
|
built
1965
1412 Jo Ellen Cir, Gulfport, MS 39501
$391
Cash flow
24.6%
Cash-on-Cash Return
11.9%
Cap rate
1.6%
Rent to Value Ratio

Active
$170,000
7
bds
|
3
ba
|
0
sqft
|
built
1981
5114 Bay St, Pascagoula, MS 39567
$249
Cash flow
7.6%
Cash-on-Cash Return
7.4%
Cap rate
1.1%
Rent to Value Ratio
Active
$784,999
6
bds
|
6
ba
|
0
sqft
|
built
2000
407 Citizen St, Bay Saint Louis, MS 39520
$-3,085
Cash flow
-20.5%
Cash-on-Cash Return
1.0%
Cap rate
0.2%
Rent to Value Ratio
Active
$235,000
3
bds
|
2
ba
|
0
sqft
|
built
1995
12247 Charwood Ave, Gulfport, MS 39503
$-20
Cash flow
-0.4%
Cash-on-Cash Return
6.2%
Cap rate
0.8%
Rent to Value Ratio
Active
$385,000
3
bds
|
2
ba
|
0
sqft
|
built
2010
11541 Briarstone Pl, Gulfport, MS 39503
$-472
Cash flow
-6.4%
Cash-on-Cash Return
4.8%
Cap rate
0.6%
Rent to Value Ratio

Active
$235,000
4
bds
|
2
ba
|
0
sqft
|
built
2003
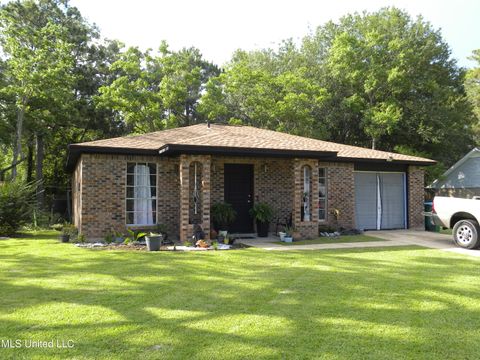
313 Espy Ave, Pass Christian, MS 39571
$121
Cash flow
2.7%
Cash-on-Cash Return
6.3%
Cap rate
0.8%
Rent to Value Ratio
Active
$419,000
2
bds
|
2
ba
|
0
sqft
|
built
1950
406 Easterbrook St, Bay Saint Louis, MS 39520
$-388
Cash flow
-4.8%
Cash-on-Cash Return
4.6%
Cap rate
0.6%
Rent to Value Ratio
Active
$229,900
3
bds
|
2
ba
|
0
sqft
|
built
1966
113 Warwick Dr, Long Beach, MS 39560
$-6
Cash flow
-0.1%
Cash-on-Cash Return
5.6%
Cap rate
0.7%
Rent to Value Ratio
Active
$207,000
3
bds
|
2
ba
|
0
sqft
|
built
1998
14189 Cypress Ct, Gulfport, MS 39503
$161
Cash flow
4.1%
Cash-on-Cash Return
7.2%
Cap rate
0.9%
Rent to Value Ratio
Active
$184,900
3
bds
|
2
ba
|
0
sqft
|
built
2023
13227 Willow Oak Cir, Gulfport, MS 39503
$207
Cash flow
5.8%
Cash-on-Cash Return
7.0%
Cap rate
1.0%
Rent to Value Ratio

Active
$179,900
2
bds
|
2
ba
|
0
sqft
|
built
1986
2 Autumn Cv, Jackson, MS 39206
$205
Cash flow
5.9%
Cash-on-Cash Return
7.0%
Cap rate
1.1%
Rent to Value Ratio
Active
$196,000
6
bds
|
4
ba
|
0
sqft
|
built
2012
12051 Highland Ave, Gulfport, MS 39503
$-253
Cash flow
-6.7%
Cash-on-Cash Return
4.7%
Cap rate
0.7%
Rent to Value Ratio
Active
$399,500
5
bds
|
3
ba
|
0
sqft
|
built
2023
13324 Hawk Pl, Gulfport, MS 39503
$-805
Cash flow
-10.5%
Cash-on-Cash Return
3.8%
Cap rate
0.6%
Rent to Value Ratio
Active
$499,000
5
bds
|
3
ba
|
0
sqft
|
built
2022
4777 Bolivar Trl N, Olive Branch, MS 38654
$-35
Cash flow
-0.4%
Cash-on-Cash Return
5.6%
Cap rate
0.7%
Rent to Value Ratio

Active
$219,000
4
bds
|
2
ba
|
0
sqft
|
built
1972
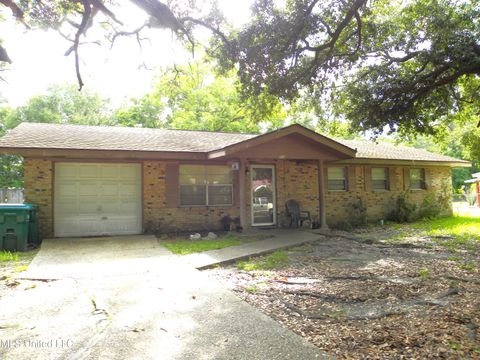
12833 Saracennia Rd, Moss Point, MS 39562
$-132
Cash flow
-3.1%
Cash-on-Cash Return
5.0%
Cap rate
0.6%
Rent to Value Ratio

Active
$194,000
3
bds
|
3
ba
|
0
sqft
|
built
1983
1 Village Green Cir, Jackson, MS 39211
$196
Cash flow
5.3%
Cash-on-Cash Return
6.9%
Cap rate
1.2%
Rent to Value Ratio

Active
$313,500
4
bds
|
2
ba
|
0
sqft
|
built
2004
2808 Rue Beaux Chenes, Ocean Springs, MS 39564
$-151
Cash flow
-2.5%
Cash-on-Cash Return
5.1%
Cap rate
0.7%
Rent to Value Ratio

Active
$1,650,000
4
bds
|
3
ba
|
0
sqft
|
built
2003
603 Sandy Hook Dr, Pass Christian, MS 39571
$-6,518
Cash flow
-20.6%
Cash-on-Cash Return
0.9%
Cap rate
0.2%
Rent to Value Ratio
Active
$365,000
4
bds
|
2
ba
|
0
sqft
|
built
1969
56 53rd St, Gulfport, MS 39507
$-341
Cash flow
-4.9%
Cash-on-Cash Return
5.1%
Cap rate
0.7%
Rent to Value Ratio

Active
$380,000
6
bds
|
3
ba
|
0
sqft
|
built
1960
3110 Dogpatch Rd, Kiln, MS 39556
$-384
Cash flow
-5.3%
Cash-on-Cash Return
4.5%
Cap rate
0.6%
Rent to Value Ratio
Active
$419,900
3
bds
|
2
ba
|
0
sqft
|
built
2022
6828 Enclave Ln, Ocean Springs, MS 39564
$-297
Cash flow
-3.7%
Cash-on-Cash Return
4.8%
Cap rate
0.7%
Rent to Value Ratio
Active
$165,900
7
bds
|
5
ba
|
0
sqft
|
built
1978
25 Oak Creek Pl, Jackson, MS 39211
$721
Cash flow
22.7%
Cash-on-Cash Return
10.9%
Cap rate
1.6%
Rent to Value Ratio

Active
$236,900
3
bds
|
2
ba
|
0
sqft
|
built
2006
602 Oakview Way, Byram, MS 39272
$126
Cash flow
2.8%
Cash-on-Cash Return
6.3%
Cap rate
0.8%
Rent to Value Ratio
Active
$119,000
3
bds
|
2
ba
|
0
sqft
|
built
1980
921 Sweetgum Dr, Gulfport, MS 39503
$234
Cash flow
10.3%
Cash-on-Cash Return
8.6%
Cap rate
1.2%
Rent to Value Ratio
Active
$119,000
3
bds
|
2
ba
|
0
sqft
|
built
1971
504 Harvey Ave, Gulfport, MS 39503
$257
Cash flow
11.3%
Cash-on-Cash Return
8.9%
Cap rate
1.2%
Rent to Value Ratio

Active
$174,900
2
bds
|
1
ba
|
0
sqft
|
built
1957
107 Lakeview Cir, Florence, MS 39073
$138
Cash flow
4.1%
Cash-on-Cash Return
6.6%
Cap rate
0.9%
Rent to Value Ratio
Active
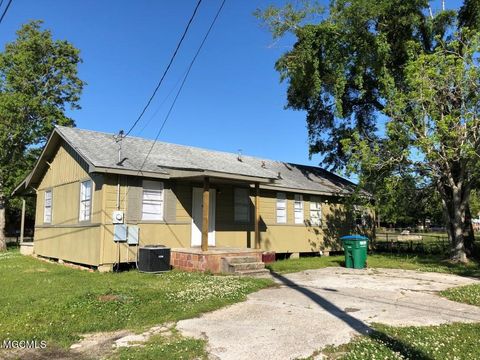
$37,500
2
bds
|
1
ba
|
0
sqft
|
built
1950
1318 Rosemont Ave, Jackson, MS 39204
$867
Cash flow
26.9%
Cash-on-Cash Return
27.7%
Cap rate
3.5%
Rent to Value Ratio
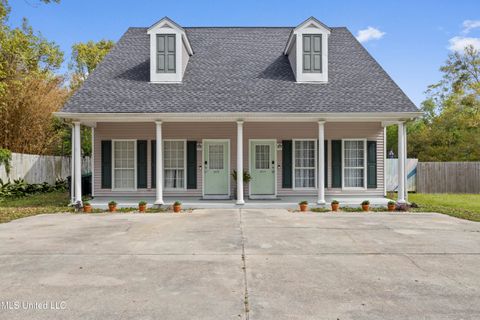
Active
$160,000
4
bds
|
2
ba
|
0
sqft
|
built
1974
15284 Woody Dr, Gulfport, MS 39503
$723
Cash flow
23.6%
Cash-on-Cash Return
11.1%
Cap rate
1.4%
Rent to Value Ratio
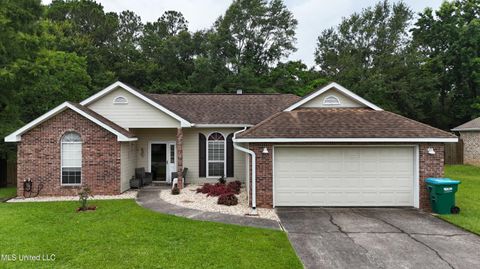
Active
$285,000
3
bds
|
2
ba
|
0
sqft
|
built
2000
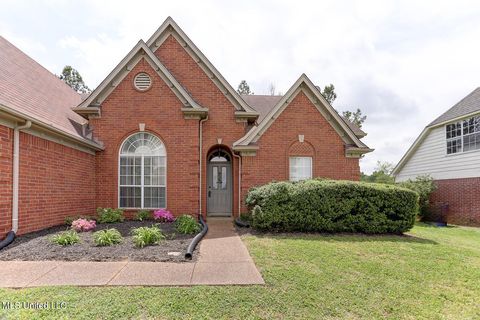
12855 Fox Ridge Ln, Olive Branch, MS 38654
$48
Cash flow
0.9%
Cash-on-Cash Return
5.9%
Cap rate
0.8%
Rent to Value Ratio

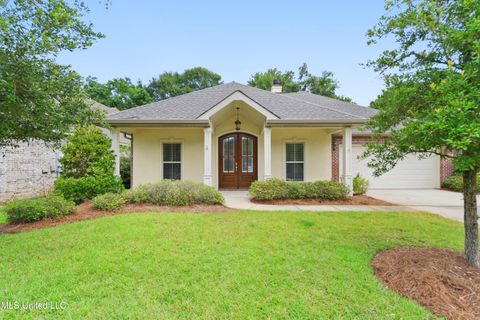
Active
$185,000
3
bds
|
2
ba
|
0
sqft
|
built
2000
14174 N Country Hills Dr, Gulfport, MS 39503
$-18
Cash flow
-0.5%
Cash-on-Cash Return
6.1%
Cap rate
0.9%
Rent to Value Ratio
Active
$375,000
5
bds
|
3
ba
|
0
sqft
|
built
1960
31 55th St, Gulfport, MS 39507
$-359
Cash flow
-5.0%
Cash-on-Cash Return
5.1%
Cap rate
0.7%
Rent to Value Ratio
Active
$329,900
3
bds
|
2
ba
|
0
sqft
|
built
2004
1602 Heather Ct, Ocean Springs, MS 39564
$-98
Cash flow
-1.5%
Cash-on-Cash Return
5.3%
Cap rate
0.7%
Rent to Value Ratio