Cache County Investment Properties for Sale
Browse homes for sale and investment properties in Cache County. Refine your search by price, property type, or more.
Best cash flowing properties in Cache County
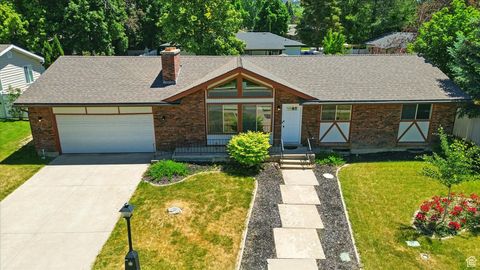
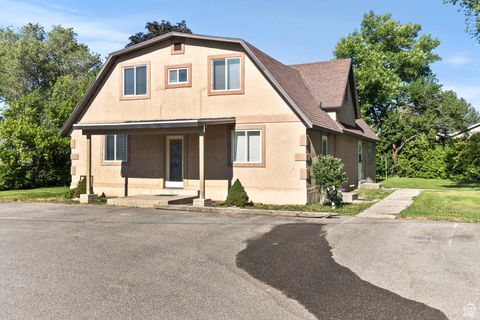
Active
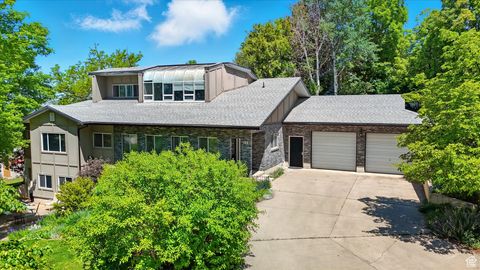
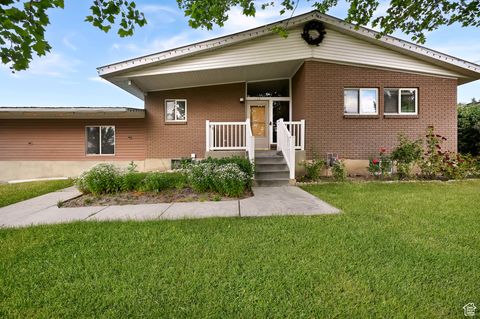
$459,999
4
bds
|
2
ba
|
3,012
sqft
|
built
1976
1520 N 1600 E, Logan, UT 84341
$-432
Cash flow
-4.9%
Cash-on-Cash Return
4.6%
Cap rate
0.6%
Rent to Value Ratio
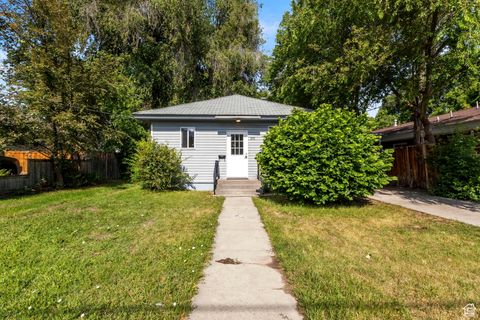
Active
$310,000
2
bds
|
1
ba
|
986
sqft
|
built
1922
355 N 300 W, Logan, UT 84321
$-468
Cash flow
-7.9%
Cash-on-Cash Return
3.9%
Cap rate
0.5%
Rent to Value Ratio
243 out of 299 properties for sale in Cache County
Limited Results Shown
Create a free account, or log in to reveal all property listings and enjoy the complete experience.
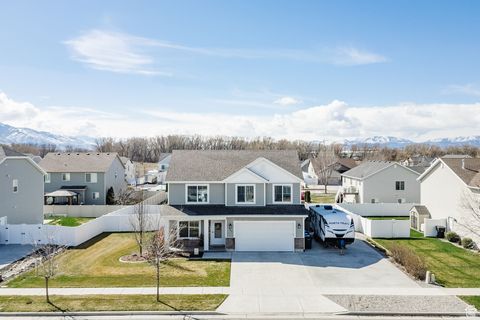
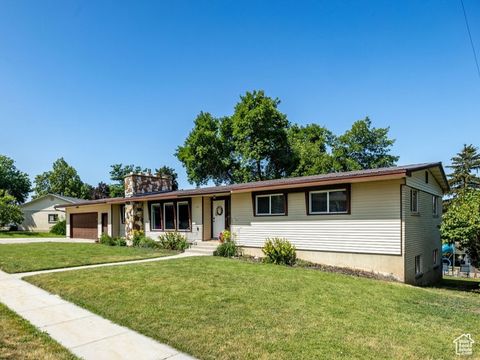
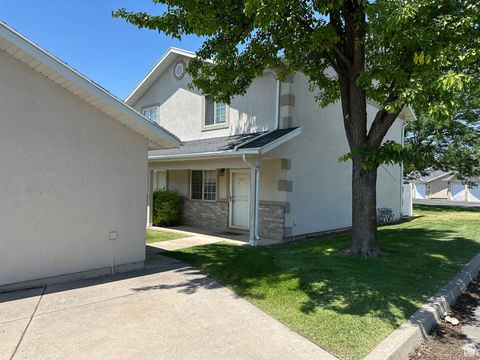
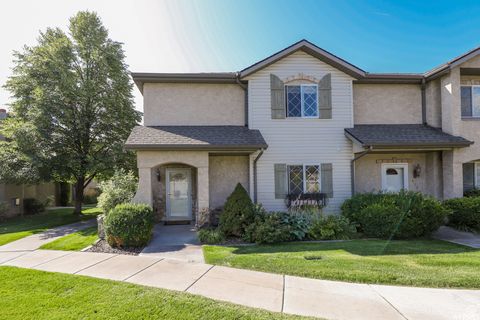
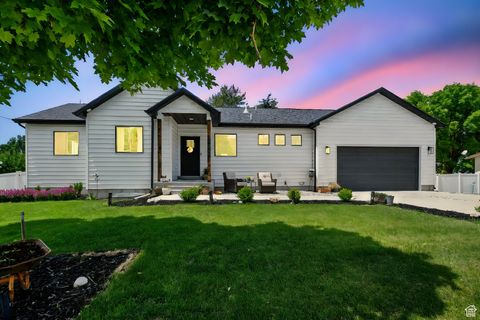
Active
$463,000
4
bds
|
3
ba
|
1,871
sqft
|
built
2017
802 W 1060 S, Logan, UT 84321
$-969
Cash flow
-10.9%
Cash-on-Cash Return
3.2%
Cap rate
0.4%
Rent to Value Ratio
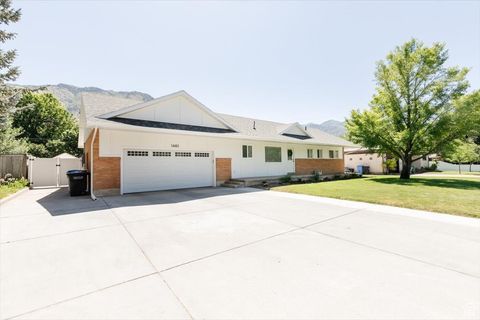
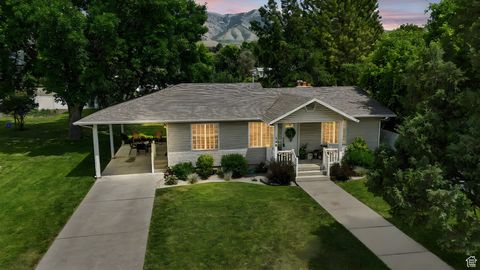
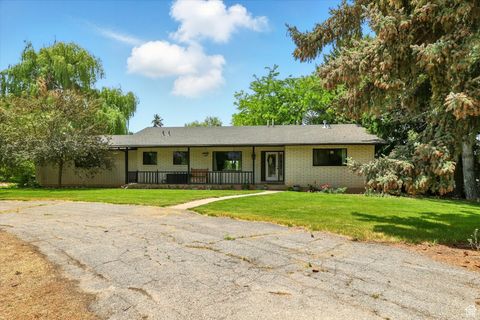
Active
$570,000
5
bds
|
3
ba
|
2,620
sqft
|
built
1963
1440 N 1600 E, Logan, UT 84341
$-1,486
Cash flow
-13.6%
Cash-on-Cash Return
3.1%
Cap rate
0.4%
Rent to Value Ratio
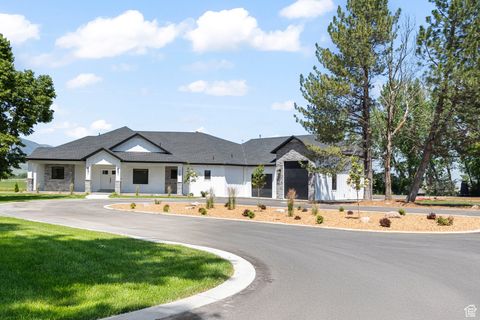
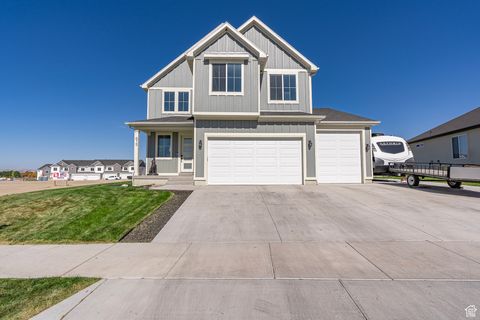
Active
$585,000
5
bds
|
4
ba
|
3,216
sqft
|
built
1986
121 Mountain View Dr, Hyde Park, UT 84318
$-1,473
Cash flow
-13.1%
Cash-on-Cash Return
2.7%
Cap rate
0.4%
Rent to Value Ratio
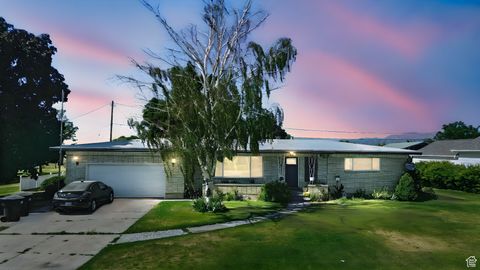
Active
$500,000
5
bds
|
4
ba
|
2,982
sqft
|
built
1971
440 S 50 W, Richmond, UT 84333
$-932
Cash flow
-9.7%
Cash-on-Cash Return
3.4%
Cap rate
0.5%
Rent to Value Ratio
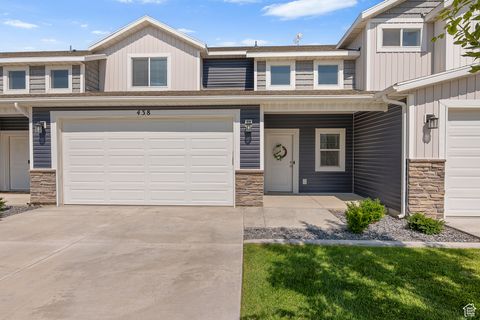
Active
$384,900
3
bds
|
3
ba
|
1,718
sqft
|
built
2019
438 S 1440 E, Hyrum, UT 84319
$-769
Cash flow
-10.4%
Cash-on-Cash Return
3.9%
Cap rate
0.6%
Rent to Value Ratio
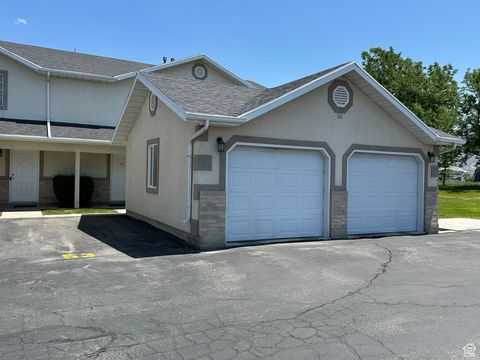
Active
$262,000
2
bds
|
2
ba
|
1,190
sqft
|
built
1995
53 W 1315 S, Logan, UT 84321
$-541
Cash flow
-10.8%
Cash-on-Cash Return
3.2%
Cap rate
0.5%
Rent to Value Ratio
Active
$264,000
2
bds
|
2
ba
|
1,190
sqft
|
built
1996
1564 Talon Dr, Logan, UT 84321
$-678
Cash flow
-13.4%
Cash-on-Cash Return
3.2%
Cap rate
0.5%
Rent to Value Ratio
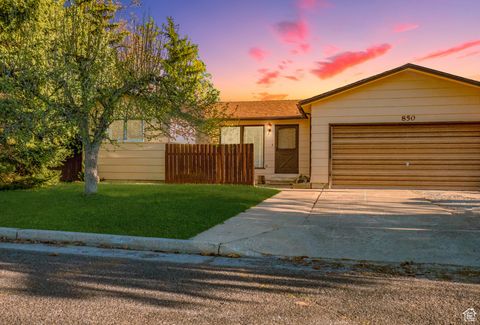
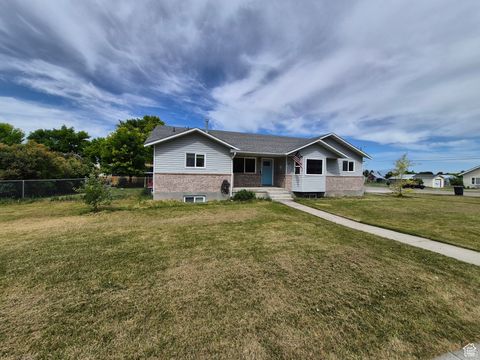
Active
$390,000
4
bds
|
2
ba
|
2,176
sqft
|
built
1979
850 W 370 S, Logan, UT 84321
$-476
Cash flow
-6.4%
Cash-on-Cash Return
4.2%
Cap rate
0.6%
Rent to Value Ratio
Active
$500,000
6
bds
|
3
ba
|
2,437
sqft
|
built
1993
783 W 430 S, Logan, UT 84321
$-1,604
Cash flow
-16.7%
Cash-on-Cash Return
2.4%
Cap rate
0.3%
Rent to Value Ratio
Active
$445,000
4
bds
|
3
ba
|
2,204
sqft
|
built
1994
345 E 2475 N, North Logan, UT 84341
$-1,126
Cash flow
-13.2%
Cash-on-Cash Return
2.6%
Cap rate
0.4%
Rent to Value Ratio
Active
$389,900
3
bds
|
3
ba
|
1,696
sqft
|
built
2001
435 Cobblestone, Providence, UT 84332
$-1,025
Cash flow
-13.7%
Cash-on-Cash Return
2.5%
Cap rate
0.5%
Rent to Value Ratio
Active
$445,000
3
bds
|
1
ba
|
2,064
sqft
|
built
2002
140 N 100 W, Hyde Park, UT 84318
$-1,227
Cash flow
-14.4%
Cash-on-Cash Return
3.0%
Cap rate
0.4%
Rent to Value Ratio
Active
$2,550,000
4
bds
|
4
ba
|
2,950
sqft
|
built
2025
3359 W 3500 S, Wellsville, UT 84339
$-9,968
Cash flow
-20.4%
Cash-on-Cash Return
1.0%
Cap rate
0.1%
Rent to Value Ratio
Active
$535,000
4
bds
|
3
ba
|
2,670
sqft
|
built
1966
572 W 300 N, Hyrum, UT 84319
$-1,113
Cash flow
-10.9%
Cash-on-Cash Return
3.2%
Cap rate
0.4%
Rent to Value Ratio
Active
$444,900
3
bds
|
3
ba
|
1,873
sqft
|
built
2022
1991 Redtail Cir, Wellsville, UT 84339
$-923
Cash flow
-10.8%
Cash-on-Cash Return
3.2%
Cap rate
0.4%
Rent to Value Ratio
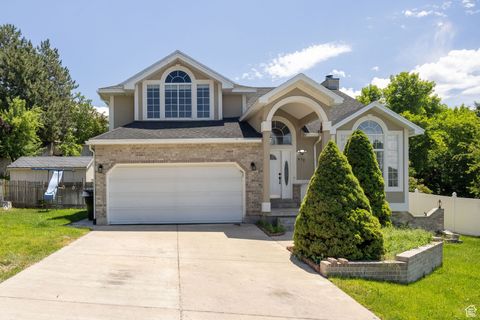
Active
$669,000
5
bds
|
3
ba
|
3,376
sqft
|
built
2000
93 S 1250 E, Logan, UT 84321
$-1,429
Cash flow
-11.1%
Cash-on-Cash Return
3.1%
Cap rate
0.4%
Rent to Value Ratio
Active
$324,900
3
bds
|
3
ba
|
1,462
sqft
|
built
2021
1183 W 1820 S, Logan, UT 84321
$-550
Cash flow
-8.8%
Cash-on-Cash Return
3.6%
Cap rate
0.6%
Rent to Value Ratio
Active
$890,000
7
bds
|
5
ba
|
5,493
sqft
|
built
1989
3923 Hillside Dr, Nibley, UT 84321
$-2,031
Cash flow
-11.9%
Cash-on-Cash Return
2.9%
Cap rate
0.4%
Rent to Value Ratio
Active
$695,000
6
bds
|
3
ba
|
3,638
sqft
|
built
2018
16 N 1000 E, Hyde Park, UT 84318
$-1,610
Cash flow
-12.1%
Cash-on-Cash Return
2.9%
Cap rate
0.4%
Rent to Value Ratio
Active
$417,000
3
bds
|
3
ba
|
1,550
sqft
|
built
2021
1469 W 2200 S, Wellsville, UT 84339
$-876
Cash flow
-11.0%
Cash-on-Cash Return
3.2%
Cap rate
0.4%
Rent to Value Ratio
Active
$365,000
3
bds
|
3
ba
|
1,537
sqft
|
built
2019
427 W 65 S, Providence, UT 84332
$-698
Cash flow
-10.0%
Cash-on-Cash Return
3.4%
Cap rate
0.5%
Rent to Value Ratio
Active
$390,000
4
bds
|
4
ba
|
2,492
sqft
|
built
2022
672 E 730 N, Hyrum, UT 84319
$-799
Cash flow
-10.7%
Cash-on-Cash Return
3.8%
Cap rate
0.5%
Rent to Value Ratio
Active
$530,000
3
bds
|
2
ba
|
3,221
sqft
|
built
2002
287 S 375 W, Providence, UT 84332
$-896
Cash flow
-8.8%
Cash-on-Cash Return
3.6%
Cap rate
0.5%
Rent to Value Ratio
Active
$469,900
4
bds
|
3
ba
|
2,130
sqft
|
built
1993
332 E 2475 N, North Logan, UT 84341
$-1,112
Cash flow
-12.3%
Cash-on-Cash Return
2.8%
Cap rate
0.4%
Rent to Value Ratio
Active
$1,789,000
6
bds
|
5
ba
|
8,214
sqft
|
built
1995
1188 N 1750 E, Logan, UT 84341
$-5,823
Cash flow
-17.0%
Cash-on-Cash Return
1.8%
Cap rate
0.3%
Rent to Value Ratio
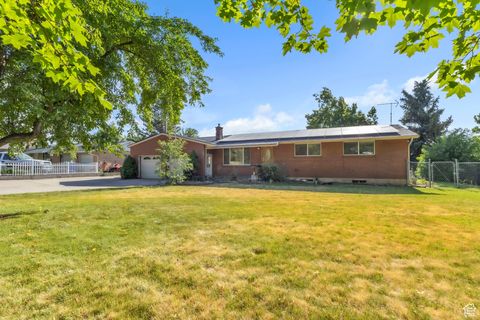
Active
$495,000
6
bds
|
3
ba
|
3,076
sqft
|
built
1976
130 Summit Dr, Smithfield, UT 84335
$-1,133
Cash flow
-11.9%
Cash-on-Cash Return
3.5%
Cap rate
0.5%
Rent to Value Ratio
Active
$440,000
4
bds
|
2
ba
|
2,316
sqft
|
built
1972
421 S 90 W, Richmond, UT 84333
$-638
Cash flow
-7.6%
Cash-on-Cash Return
3.9%
Cap rate
0.5%
Rent to Value Ratio
Active
$599,000
5
bds
|
2
ba
|
2,276
sqft
|
built
1964
185 S 200 W, Providence, UT 84332
$-1,810
Cash flow
-15.8%
Cash-on-Cash Return
2.1%
Cap rate
0.3%
Rent to Value Ratio
Active
$449,000
4
bds
|
2
ba
|
2,478
sqft
|
built
1991
95 N 200 E, Richmond, UT 84333
$-758
Cash flow
-8.8%
Cash-on-Cash Return
3.7%
Cap rate
0.5%
Rent to Value Ratio
Active
$500,000
4
bds
|
4
ba
|
2,726
sqft
|
built
1991
672 E Center St, Providence, UT 84332
$-1,299
Cash flow
-13.6%
Cash-on-Cash Return
3.1%
Cap rate
0.4%
Rent to Value Ratio
Active
$460,000
5
bds
|
5
ba
|
3,545
sqft
|
built
1903
165 N 800 E, Hyrum, UT 84319
$-633
Cash flow
-7.2%
Cash-on-Cash Return
4.0%
Cap rate
0.5%
Rent to Value Ratio
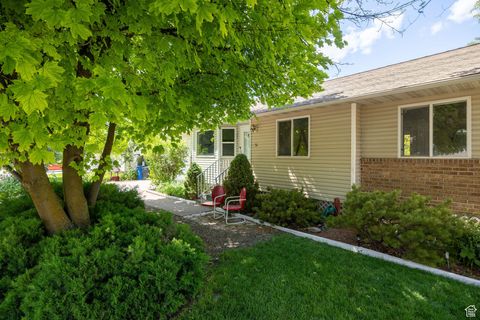
Active
$499,900
4
bds
|
3
ba
|
2,552
sqft
|
built
2020
155 N 200 E, Richmond, UT 84333
$-726
Cash flow
-7.6%
Cash-on-Cash Return
3.9%
Cap rate
0.5%
Rent to Value Ratio
Active
$969,000
4
bds
|
3
ba
|
3,608
sqft
|
built
1971
12800 N 1200 E, Cove, UT 84320
$-1,713
Cash flow
-9.2%
Cash-on-Cash Return
3.6%
Cap rate
0.5%
Rent to Value Ratio
Active
$595,000
4
bds
|
4
ba
|
2,769
sqft
|
built
2023
615 W 500 N, Smithfield, UT 84335
$-1,088
Cash flow
-9.5%
Cash-on-Cash Return
3.5%
Cap rate
0.5%
Rent to Value Ratio

Active
$650,000
5
bds
|
3
ba
|
4,935
sqft
|
built
1987
1580 E 1630 N, North Logan, UT 84341
$-1,124
Cash flow
-9.0%
Cash-on-Cash Return
3.6%
Cap rate
0.5%
Rent to Value Ratio
Active
$524,900
6
bds
|
2
ba
|
2,592
sqft
|
built
1963
2280 N 800 E, North Logan, UT 84341
$-1,438
Cash flow
-14.3%
Cash-on-Cash Return
2.4%
Cap rate
0.3%
Rent to Value Ratio
Active
$464,000
3
bds
|
2
ba
|
1,411
sqft
|
built
2020
40 S 100 W, Trenton, UT 84338
$-1,099
Cash flow
-12.4%
Cash-on-Cash Return
2.8%
Cap rate
0.4%
Rent to Value Ratio
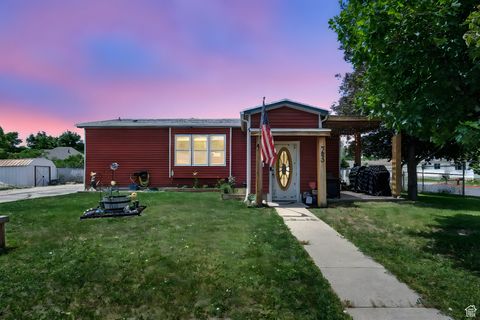
Active
$360,000
2
bds
|
2
ba
|
1,100
sqft
|
built
1936
143 S State St, Richmond, UT 84333
$-588
Cash flow
-8.5%
Cash-on-Cash Return
3.7%
Cap rate
0.5%
Rent to Value Ratio