Cache County Investment Properties for Sale
Browse homes for sale and investment properties in Cache County. Refine your search by price, property type, or more.
Best cash flowing properties in Cache County
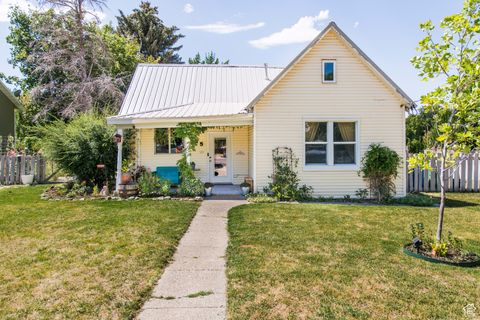
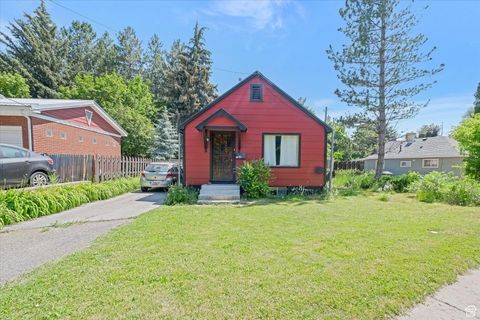
Active
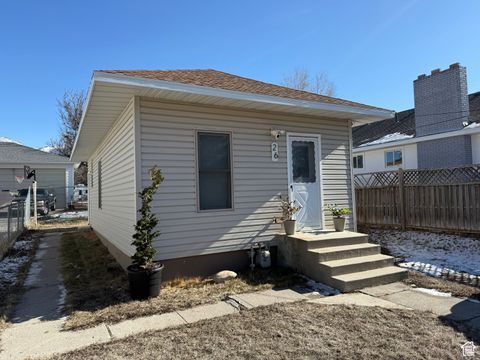
$240,000
1
bds
|
1
ba
|
520
sqft
|
built
1916
26 N 100 E, Smithfield, UT 84335
$-251
Cash flow
-5.5%
Cash-on-Cash Return
4.4%
Cap rate
0.6%
Rent to Value Ratio
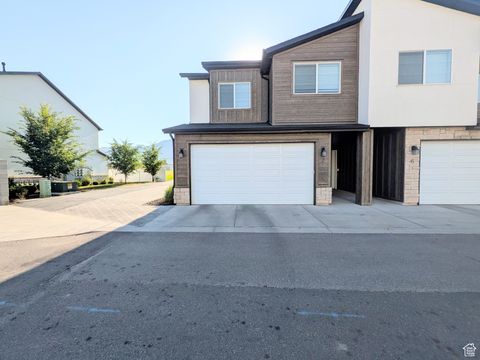
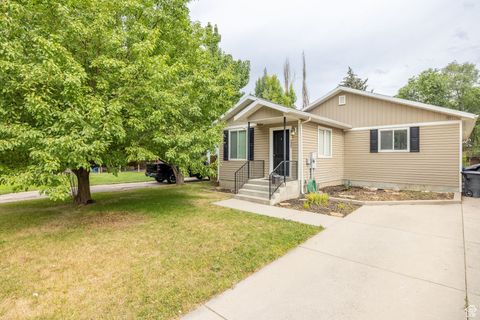
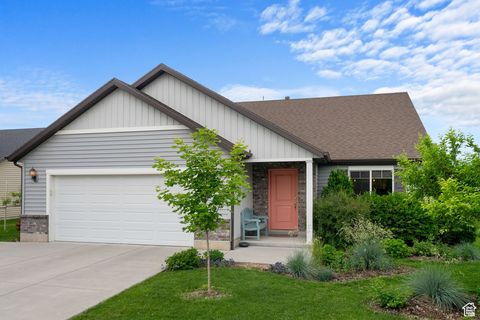
Active
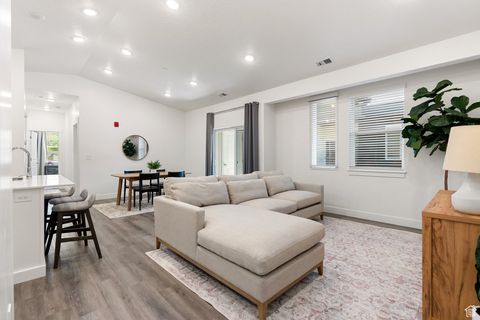
$269,900
2
bds
|
2
ba
|
1,125
sqft
|
built
2020
460 W 15 S, Providence, UT 84332
$-266
Cash flow
-5.1%
Cash-on-Cash Return
4.5%
Cap rate
0.7%
Rent to Value Ratio
223 out of 274 properties for sale in Cache County
Limited Results Shown
Create a free account, or log in to reveal all property listings and enjoy the complete experience.
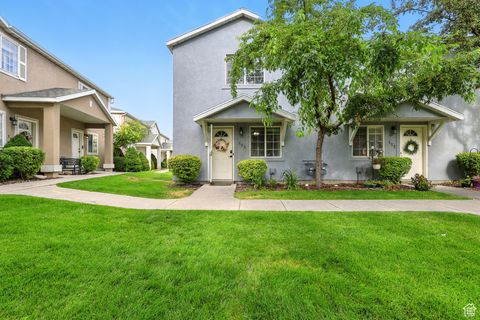
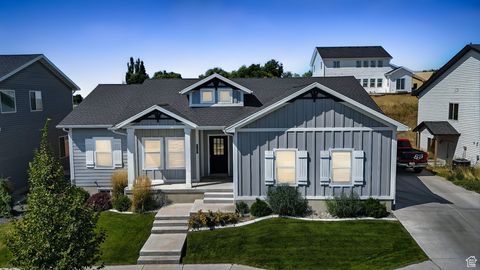
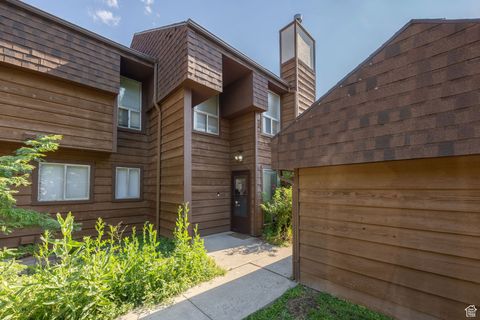
Active
$285,000
2
bds
|
2
ba
|
1,224
sqft
|
built
1999
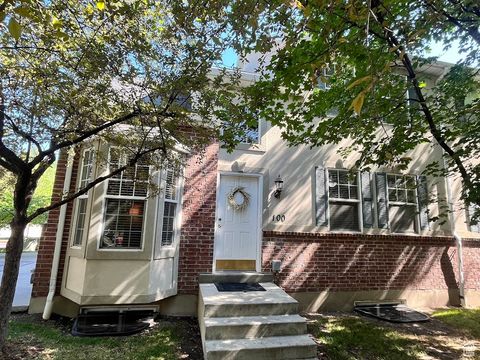
123 Penhurst Pl, Logan, UT 84341
$-643
Cash flow
-11.8%
Cash-on-Cash Return
3.0%
Cap rate
0.5%
Rent to Value Ratio
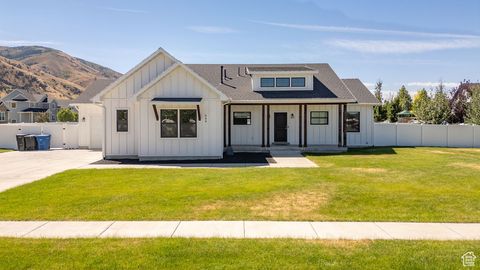
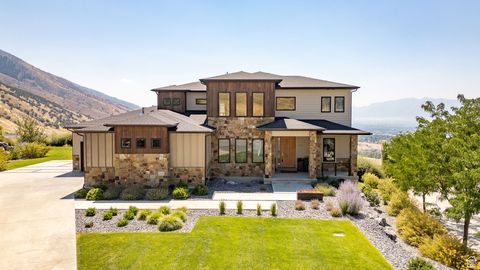
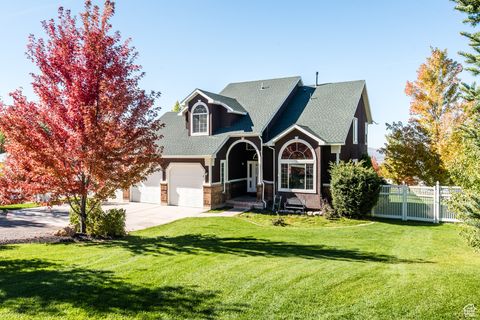
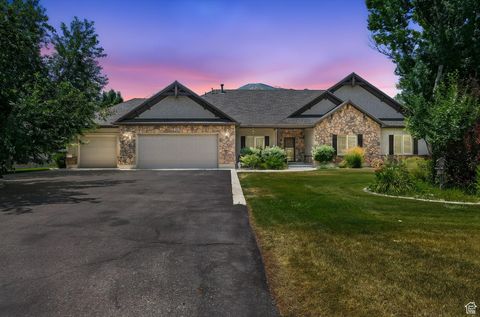
Active
$792,000
5
bds
|
4
ba
|
3,524
sqft
|
built
2017
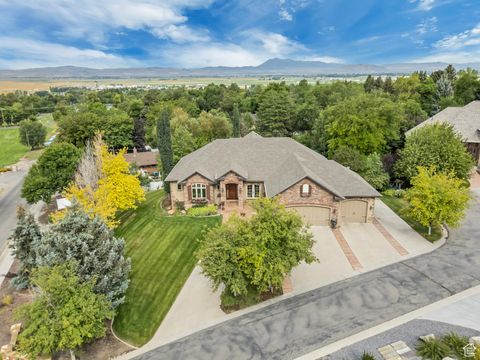
444 E 100 N, Millville, UT 84326
$-1,574
Cash flow
-10.4%
Cash-on-Cash Return
3.3%
Cap rate
0.4%
Rent to Value Ratio
Active
$1,595,000
6
bds
|
6
ba
|
5,494
sqft
|
built
2018
2835 Naomi Cir, North Logan, UT 84341
$-5,963
Cash flow
-19.5%
Cash-on-Cash Return
1.2%
Cap rate
0.2%
Rent to Value Ratio
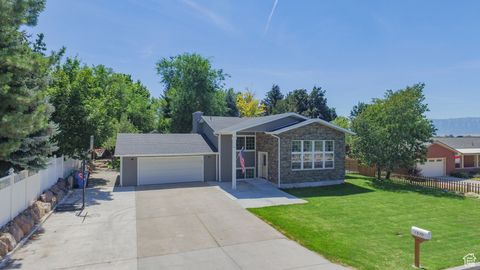
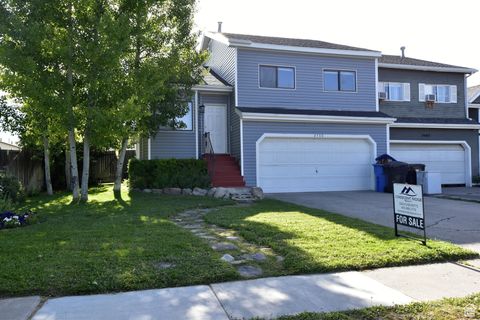
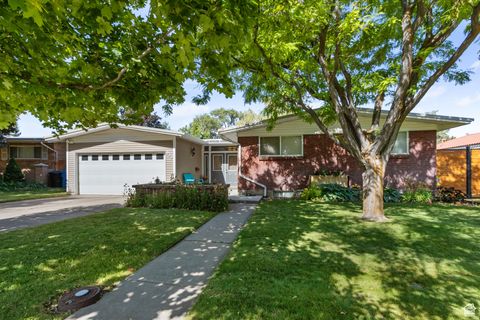
Active
$545,000
5
bds
|
3
ba
|
2,500
sqft
|
built
1974
1570 E 2100 N, Logan, UT 84341
$-1,232
Cash flow
-11.8%
Cash-on-Cash Return
3.0%
Cap rate
0.4%
Rent to Value Ratio
Active
$349,000
3
bds
|
3
ba
|
1,576
sqft
|
built
2020
2 S 410 W, Providence, UT 84332
$-897
Cash flow
-13.4%
Cash-on-Cash Return
2.6%
Cap rate
0.5%
Rent to Value Ratio
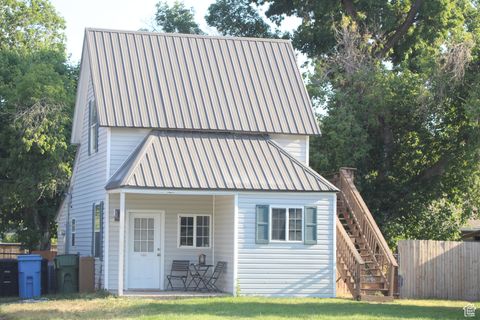
Active
$400,000
4
bds
|
2
ba
|
1,358
sqft
|
built
1918
155 S 100 W, Providence, UT 84332
$-778
Cash flow
-10.1%
Cash-on-Cash Return
3.3%
Cap rate
0.4%
Rent to Value Ratio
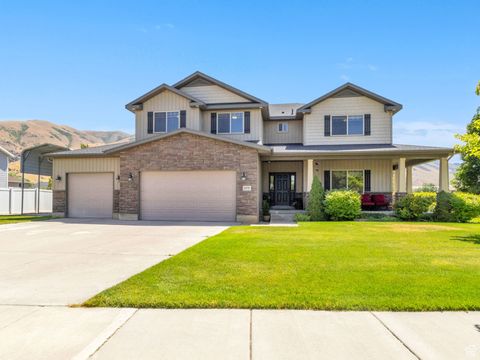
Active
$745,000
6
bds
|
4
ba
|
4,517
sqft
|
built
1985
591 Vons Way Dr, Providence, UT 84332
$-1,650
Cash flow
-11.6%
Cash-on-Cash Return
3.0%
Cap rate
0.4%
Rent to Value Ratio
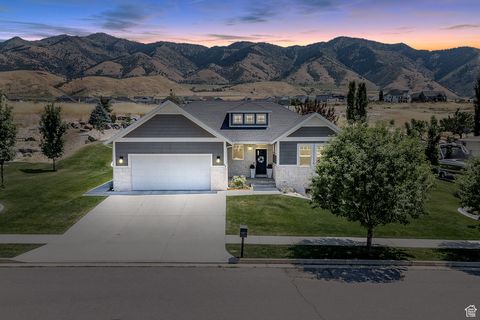
Active
$729,900
4
bds
|
4
ba
|
3,580
sqft
|
built
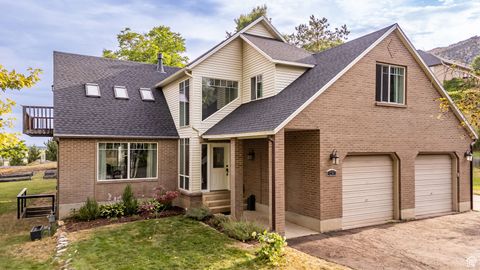
2013
84 N 820 E, Hyde Park, UT 84318
$-1,216
Cash flow
-8.7%
Cash-on-Cash Return
3.7%
Cap rate
0.5%
Rent to Value Ratio
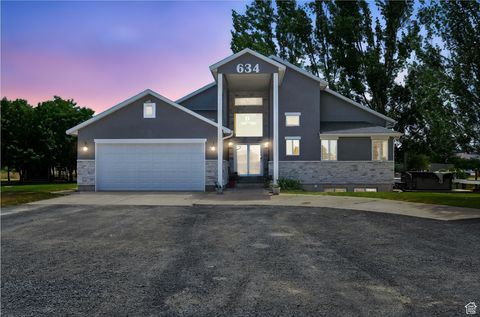
Active
$1,200,000
6
bds
|
4
ba
|
4,447
sqft
|
built
1995
634 W 8300 S, Paradise, UT 84328
$-4,034
Cash flow
-17.5%
Cash-on-Cash Return
1.6%
Cap rate
0.2%
Rent to Value Ratio
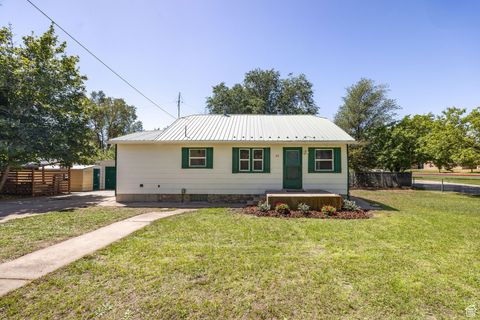
Active
$410,000
3
bds
|
1
ba
|
2,008
sqft
|
built
1942
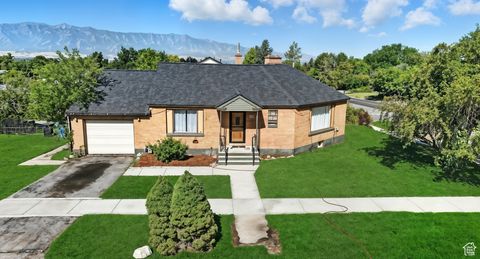
14 S 400 W, Hyrum, UT 84319
$-687
Cash flow
-8.7%
Cash-on-Cash Return
3.7%
Cap rate
0.5%
Rent to Value Ratio
Active
$480,000
4
bds
|
2
ba
|
2,960
sqft
|
built
1951
407 S 100 W, Providence, UT 84332
$-515
Cash flow
-5.6%
Cash-on-Cash Return
4.4%
Cap rate
0.6%
Rent to Value Ratio
Active
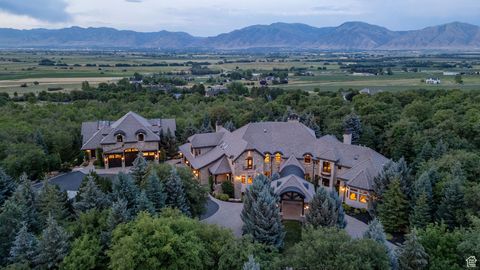
$11,600,000
6
bds
|
8
ba
|
16,617
sqft
|
built
2005
5624 W 3400 S, Wellsville, UT 84339
$-53,570
Cash flow
-24.1%
Cash-on-Cash Return
0.1%
Cap rate
0.0%
Rent to Value Ratio
Active
$397,000
2
bds
|
2
ba
|
2,312
sqft
|
built
1921
235 W 500 N, Logan, UT 84321
$-1,117
Cash flow
-14.7%
Cash-on-Cash Return
2.3%
Cap rate
0.3%
Rent to Value Ratio
Active
$309,900
1
bds
|
1
ba
|
1,240
sqft
|
built
1935
314 Canyon Rd, Logan, UT 84321
$-600
Cash flow
-10.1%
Cash-on-Cash Return
3.4%
Cap rate
0.5%
Rent to Value Ratio
Active
$885,000
5
bds
|
5
ba
|
3,811
sqft
|
built
1995
355 N 1100 E, Hyde Park, UT 84318
$-2,061
Cash flow
-12.2%
Cash-on-Cash Return
2.9%
Cap rate
0.4%
Rent to Value Ratio
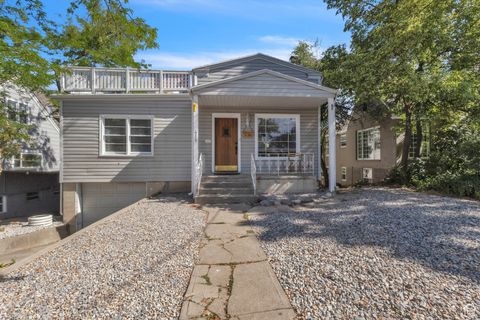
Active
$599,999
6
bds
|
2
ba
|
2,400
sqft
|
built
1939
435 E 300 N, Logan, UT 84321
$-1,466
Cash flow
-12.7%
Cash-on-Cash Return
2.7%
Cap rate
0.4%
Rent to Value Ratio
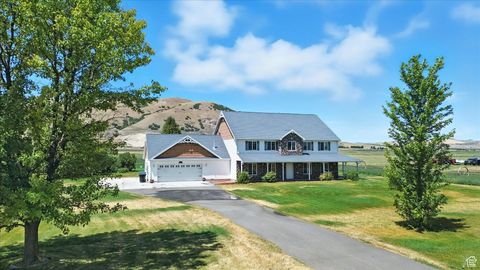
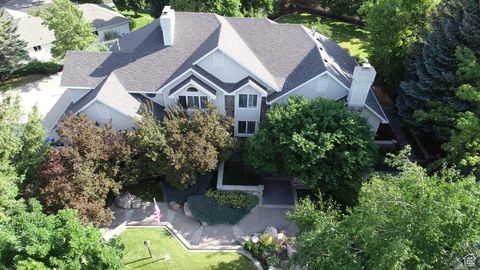
Active
$980,000
5
bds
|
4
ba
|
4,551
sqft
|
built
2007
1245 S 400 E, Trenton, UT 84338
$-3,080
Cash flow
-16.4%
Cash-on-Cash Return
1.9%
Cap rate
0.3%
Rent to Value Ratio
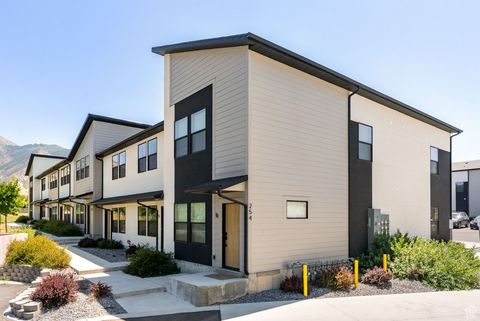
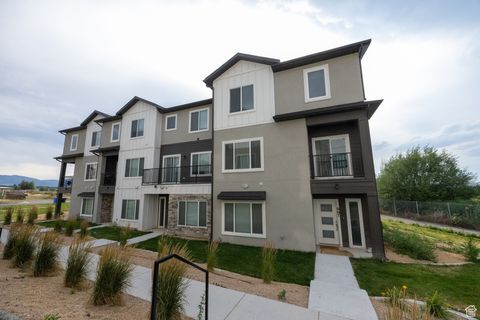
Active
$2,835,000
27
bds
|
22
ba
|
12,679
sqft
|
built
2020
254 N Spring Creek Pkwy, Providence, UT 84332
$-13,314
Cash flow
-24.5%
Cash-on-Cash Return
0.0%
Cap rate
0.1%
Rent to Value Ratio
Active
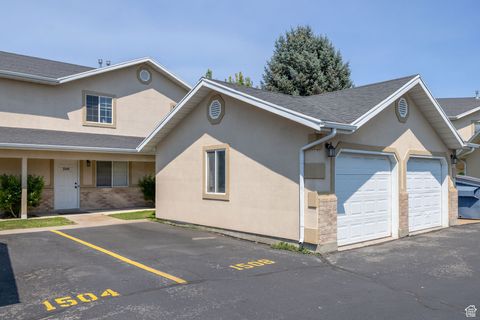
$254,900
2
bds
|
2
ba
|
1,190
sqft
|
built
1996
1506 Talon Dr, Logan, UT 84321
$-507
Cash flow
-10.4%
Cash-on-Cash Return
3.3%
Cap rate
0.5%
Rent to Value Ratio
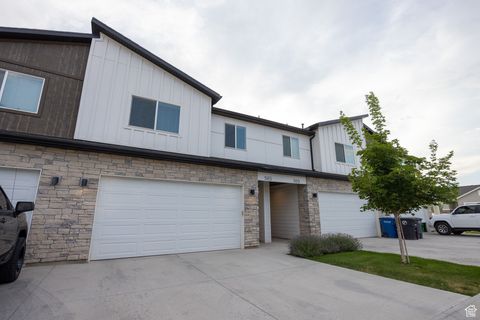
Active
$515,000
5
bds
|
4
ba
|
2,740
sqft
|
built
2019
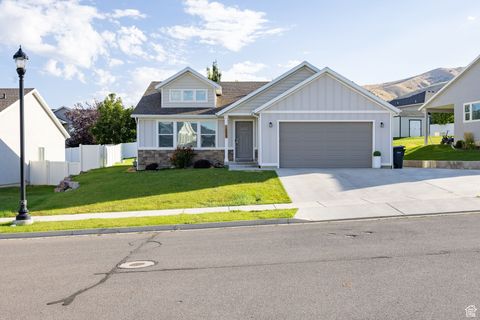
613 S 280 E, Smithfield, UT 84335
$-903
Cash flow
-9.1%
Cash-on-Cash Return
3.6%
Cap rate
0.5%
Rent to Value Ratio
Active
$549,000
4
bds
|
3
ba
|
1,782
sqft
|
built
1924
440 N 400 E, Logan, UT 84321
$-2,006
Cash flow
-19.1%
Cash-on-Cash Return
1.3%
Cap rate
0.2%
Rent to Value Ratio
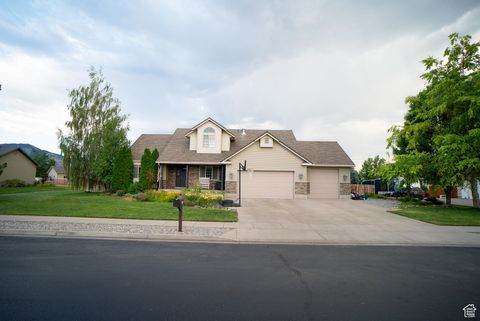
Active
$430,000
5
bds
|
2
ba
|
2,184
sqft
|
built
1980
55 W 300 N, Hyde Park, UT 84318
$-645
Cash flow
-7.8%
Cash-on-Cash Return
3.9%
Cap rate
0.5%
Rent to Value Ratio
Active
$590,000
6
bds
|
3
ba
|
2,994
sqft
|
built
2018
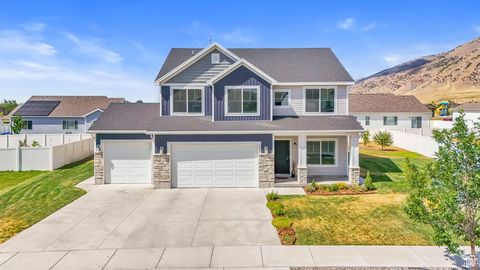
1091 E 480 S, Smithfield, UT 84335
$-1,222
Cash flow
-10.8%
Cash-on-Cash Return
3.2%
Cap rate
0.4%
Rent to Value Ratio
Active
$390,500
4
bds
|
4
ba
|
2,630
sqft
|
built
2003
1030 N 130 W, Logan, UT 84341
$-781
Cash flow
-10.4%
Cash-on-Cash Return
3.3%
Cap rate
0.5%
Rent to Value Ratio
Active
$520,000
4
bds
|
3
ba
|
2,393
sqft
|
built
2018
1345 E 340 S, Hyrum, UT 84319
$-1,167
Cash flow
-11.7%
Cash-on-Cash Return
3.0%
Cap rate
0.4%
Rent to Value Ratio
Active
$1,125,000
6
bds
|
4
ba
|
5,172
sqft
|
built
2007
531 E Center St, Hyde Park, UT 84318
$-3,481
Cash flow
-16.1%
Cash-on-Cash Return
2.0%
Cap rate
0.3%
Rent to Value Ratio
Active
$499,999
3
bds
|
2
ba
|
2,810
sqft
|
built
2019
798 W 50 N, Hyrum, UT 84319
$-831
Cash flow
-8.7%
Cash-on-Cash Return
3.7%
Cap rate
0.5%
Rent to Value Ratio
Active
$359,900
4
bds
|
2
ba
|
1,745
sqft
|
built
1986
2700 N 300 E, North Logan, UT 84341
$-853
Cash flow
-12.4%
Cash-on-Cash Return
2.8%
Cap rate
0.4%
Rent to Value Ratio
Active
$314,900
2
bds
|
1
ba
|
971
sqft
|
built
1909
279 W 300 N, Hyrum, UT 84319
$-482
Cash flow
-8.0%
Cash-on-Cash Return
3.8%
Cap rate
0.5%
Rent to Value Ratio
Active
$780,000
5
bds
|
5
ba
|
4,550
sqft
|
built
2007
177 S 1170 E, Hyrum, UT 84319
$-1,967
Cash flow
-13.2%
Cash-on-Cash Return
2.7%
Cap rate
0.4%
Rent to Value Ratio
Active
$789,000
3
bds
|
4
ba
|
2,546
sqft
|
built
2010
731 S Center St, Wellsville, UT 84339
$-2,325
Cash flow
-15.4%
Cash-on-Cash Return
2.1%
Cap rate
0.3%
Rent to Value Ratio
Active
$635,000
5
bds
|
3
ba
|
2,986
sqft
|
built
1961
825 N 1400 E, Logan, UT 84321
$-1,805
Cash flow
-14.8%
Cash-on-Cash Return
2.3%
Cap rate
0.3%
Rent to Value Ratio
Active
$235,000
2
bds
|
1
ba
|
904
sqft
|
built
1978
1085 N 375 W, Logan, UT 84341
$-458
Cash flow
-10.2%
Cash-on-Cash Return
3.3%
Cap rate
0.6%
Rent to Value Ratio
Active
$425,000
3
bds
|
2
ba
|
1,552
sqft
|
built
2011
873 N 480 W, Logan, UT 84321
$-672
Cash flow
-8.2%
Cash-on-Cash Return
3.8%
Cap rate
0.5%
Rent to Value Ratio
Active
$989,000
6
bds
|
7
ba
|
6,435
sqft
|
built
1993
240 N 1480 E, Logan, UT 84321
$-1,532
Cash flow
-8.1%
Cash-on-Cash Return
3.8%
Cap rate
0.5%
Rent to Value Ratio
Active
$384,900
4
bds
|
4
ba
|
2,366
sqft
|
built
2022
667 E 730 N, Hyrum, UT 84319
$-598
Cash flow
-8.1%
Cash-on-Cash Return
3.8%
Cap rate
0.6%
Rent to Value Ratio
Active
$344,900
3
bds
|
3
ba
|
1,574
sqft
|
built
2021
565 N 245 E, Providence, UT 84332
$-840
Cash flow
-12.7%
Cash-on-Cash Return
2.8%
Cap rate
0.5%
Rent to Value Ratio
Active
$769,000
5
bds
|
4
ba
|
3,703
sqft
|
built
2003
396 W 3650 S, Nibley, UT 84321
$-1,938
Cash flow
-13.1%
Cash-on-Cash Return
2.7%
Cap rate
0.4%
Rent to Value Ratio