Cache County Investment Properties for Sale
Browse homes for sale and investment properties in Cache County. Refine your search by price, property type, or more.
Best cash flowing properties in Cache County
Active
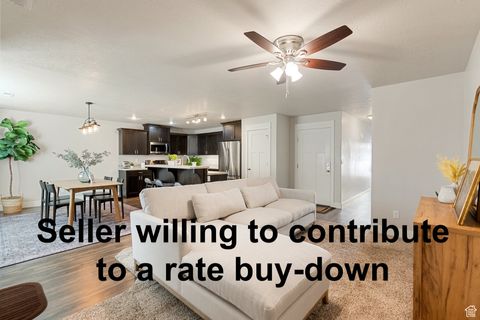
$329,900
3
bds
|
3
ba
|
1,785
sqft
|
built
2017
259 W 40 N, Hyrum, UT 84319
$-391
Cash flow
-6.2%
Cash-on-Cash Return
4.3%
Cap rate
0.6%
Rent to Value Ratio
Active
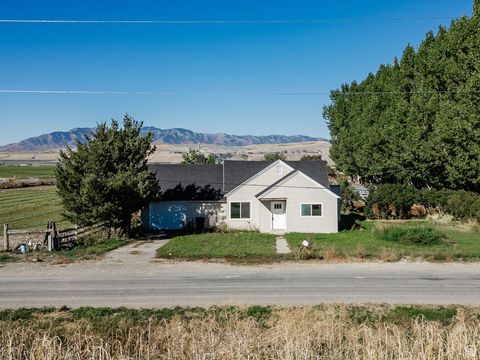
$369,900
4
bds
|
2
ba
|
1,606
sqft
|
built
1910
1090 S 2400 W, Lewiston, UT 84320
$-549
Cash flow
-7.7%
Cash-on-Cash Return
3.9%
Cap rate
0.5%
Rent to Value Ratio
221 out of 272 properties for sale in Cache County
Limited Results Shown
Create a free account, or log in to reveal all property listings and enjoy the complete experience.
Active
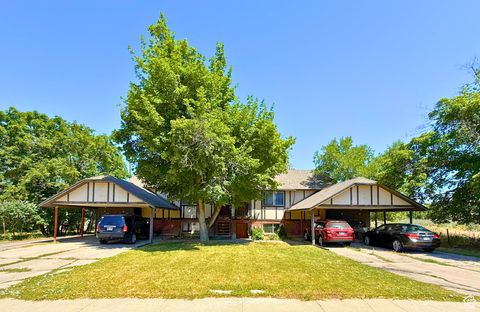
$699,900
8
bds
|
4
ba
|
3,120
sqft
|
built
1976
301 W 500 N, Logan, UT 84321
$-2,445
Cash flow
-18.2%
Cash-on-Cash Return
1.5%
Cap rate
0.2%
Rent to Value Ratio
Active
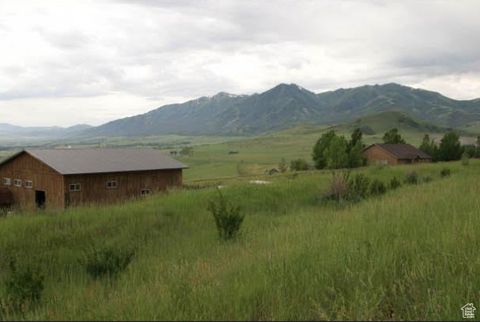
$4,850,000
2
bds
|
3
ba
|
2,151
sqft
|
built
1999
2666 Valley Vw W, Mendon, UT 84325
$-21,401
Cash flow
-23.0%
Cash-on-Cash Return
0.4%
Cap rate
0.1%
Rent to Value Ratio
Active
$649,900
5
bds
|
4
ba
|
3,905
sqft
|
built
2003
168 E 520 N, Smithfield, UT 84335
$-1,171
Cash flow
-9.4%
Cash-on-Cash Return
3.5%
Cap rate
0.5%
Rent to Value Ratio
Active
$669,000
7
bds
|
4
ba
|
4,087
sqft
|
built
1916
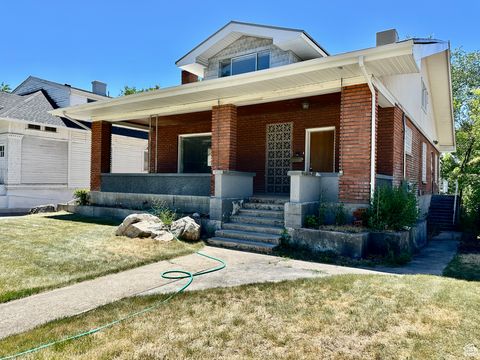
33 N 200 E, Logan, UT 84321
$-2,394
Cash flow
-18.7%
Cash-on-Cash Return
1.4%
Cap rate
0.2%
Rent to Value Ratio
Active
$799,900
5
bds
|
4
ba
|
4,277
sqft
|
built
1996
1045 Fox Farm Rd, Logan, UT 84321
$-2,098
Cash flow
-13.7%
Cash-on-Cash Return
2.5%
Cap rate
0.4%
Rent to Value Ratio
Active
$489,000
3
bds
|
2
ba
|
2,626
sqft
|
built
1916
175 W 9200 S, Paradise, UT 84328
$-1,081
Cash flow
-11.5%
Cash-on-Cash Return
3.0%
Cap rate
0.4%
Rent to Value Ratio
Active
$575,000
4
bds
|
3
ba
|
3,295
sqft
|
built
2000
338 N 1090 W, Hyrum, UT 84319
$-1,382
Cash flow
-12.5%
Cash-on-Cash Return
2.8%
Cap rate
0.4%
Rent to Value Ratio
Active
$569,990
3
bds
|
2
ba
|
3,291
sqft
|
built
2023
640 S 1030 E, Smithfield, UT 84335
$-926
Cash flow
-8.5%
Cash-on-Cash Return
3.7%
Cap rate
0.5%
Rent to Value Ratio
Active
$649,900
5
bds
|
3
ba
|
3,485
sqft
|
built
2007
160 E 600 N, Millville, UT 84326
$-1,469
Cash flow
-11.8%
Cash-on-Cash Return
3.0%
Cap rate
0.4%
Rent to Value Ratio
Active
$1,499,999
5
bds
|
5
ba
|
5,252
sqft
|
built
2020
3450 N 1930 E, North Logan, UT 84341
$-3,234
Cash flow
-11.2%
Cash-on-Cash Return
3.1%
Cap rate
0.4%
Rent to Value Ratio
Active
$649,000
4
bds
|
3
ba
|
3,807
sqft
|
built
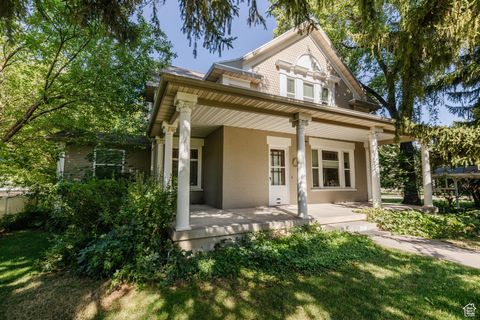
1910
291 N Main St, Hyde Park, UT 84318
$-1,144
Cash flow
-9.2%
Cash-on-Cash Return
3.6%
Cap rate
0.5%
Rent to Value Ratio
Active
$889,434
5
bds
|
4
ba
|
4,225
sqft
|
built
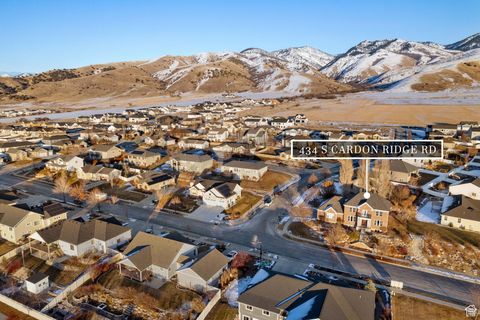
2008
434 S Cardon Ridge Dr, Smithfield, UT 84335
$-1,091
Cash flow
-6.4%
Cash-on-Cash Return
4.2%
Cap rate
0.6%
Rent to Value Ratio
Active
$380,000
4
bds
|
1
ba
|
1,510
sqft
|
built
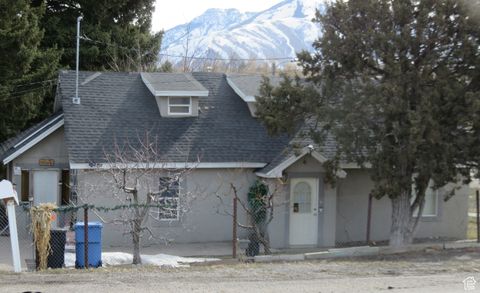
1926
6 N 400 W, Hyrum, UT 84319
$-642
Cash flow
-8.8%
Cash-on-Cash Return
3.7%
Cap rate
0.5%
Rent to Value Ratio
Active
$690,000
3
bds
|
3
ba
|
3,401
sqft
|
built
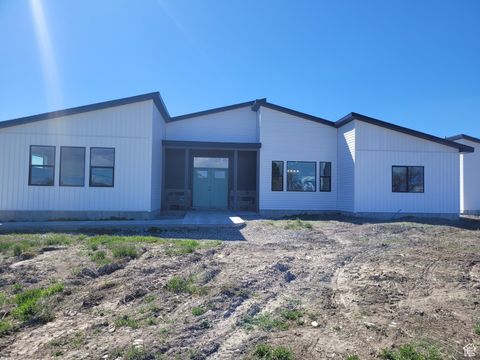
2024
15 S 400 W, Newton, UT 84327
$-850
Cash flow
-6.4%
Cash-on-Cash Return
4.2%
Cap rate
0.5%
Rent to Value Ratio
Active
$550,000
6
bds
|
4
ba
|
3,277
sqft
|
built
2000
98 W 400 S, Smithfield, UT 84335
$-793
Cash flow
-7.5%
Cash-on-Cash Return
3.9%
Cap rate
0.5%
Rent to Value Ratio
Active
$940,000
5
bds
|
3
ba
|
4,994
sqft
|
built
2021
615 N 750 E, Hyde Park, UT 84318
$-1,653
Cash flow
-9.2%
Cash-on-Cash Return
3.6%
Cap rate
0.5%
Rent to Value Ratio
Active
$1,000,000
3
bds
|
5
ba
|
6,067
sqft
|
built
1966
975 N 1600 E, Logan, UT 84321
$-2,426
Cash flow
-12.7%
Cash-on-Cash Return
2.8%
Cap rate
0.4%
Rent to Value Ratio
Active
$1,150,000
4
bds
|
5
ba
|
5,082
sqft
|
built
2004
898 E 260 N, Hyde Park, UT 84318
$-2,664
Cash flow
-12.1%
Cash-on-Cash Return
2.9%
Cap rate
0.4%
Rent to Value Ratio
Active
$1,099,900
12
bds
|
5
ba
|
3,200
sqft
|
built
1934
661 E 600 N, Logan, UT 84321
$-4,242
Cash flow
-20.1%
Cash-on-Cash Return
1.1%
Cap rate
0.2%
Rent to Value Ratio