Carbon County Investment Properties for Sale
Browse homes for sale and investment properties in Carbon County. Refine your search by price, property type, or more.
Best cash flowing properties in Carbon County
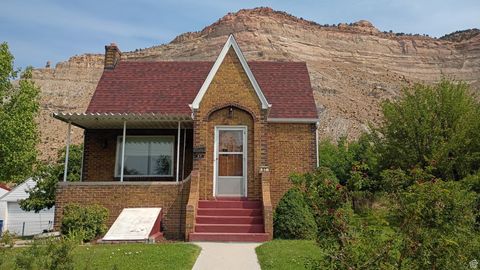
Active
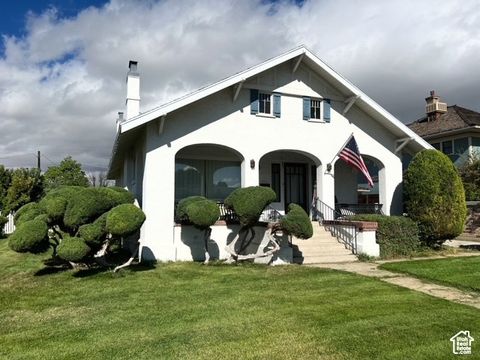
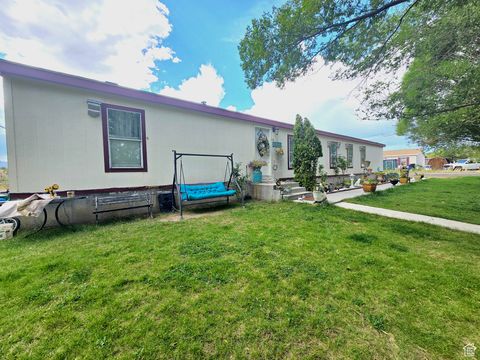
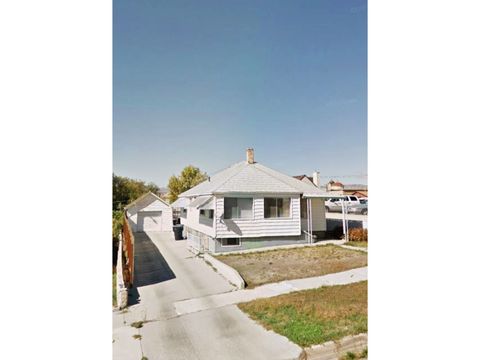
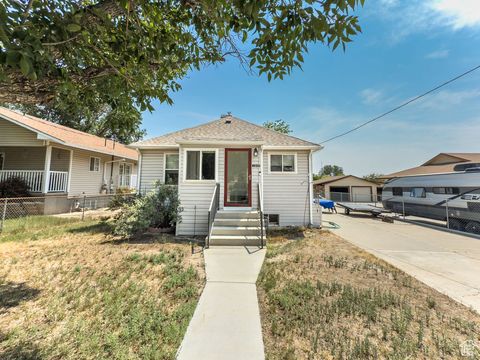
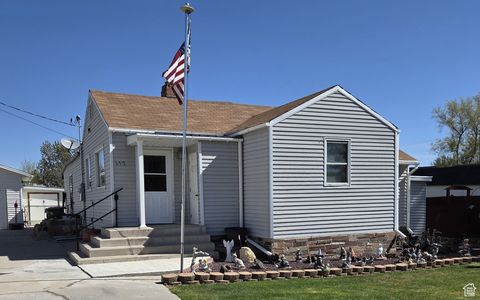
$299,900
2
bds
|
2
ba
|
2,339
sqft
|
built
1915
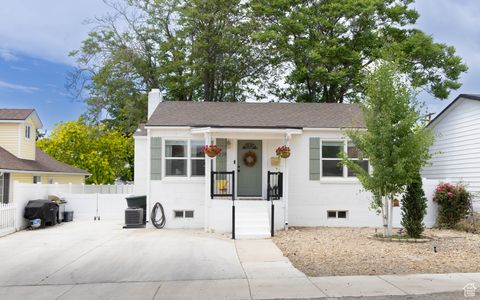
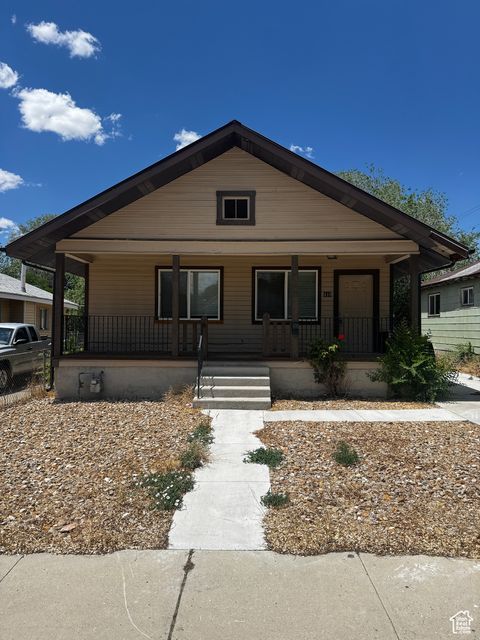
175 N 100 E, Price, UT 84501
$202
Cash flow
3.5%
Cash-on-Cash Return
6.5%
Cap rate
0.8%
Rent to Value Ratio
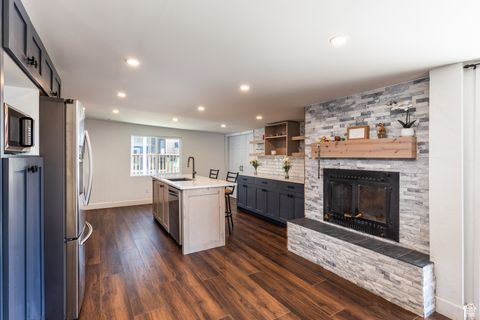
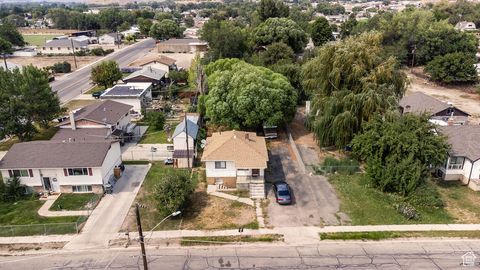
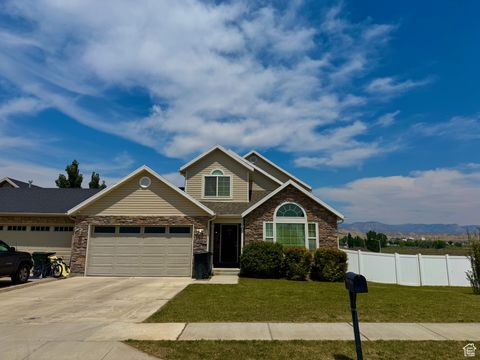
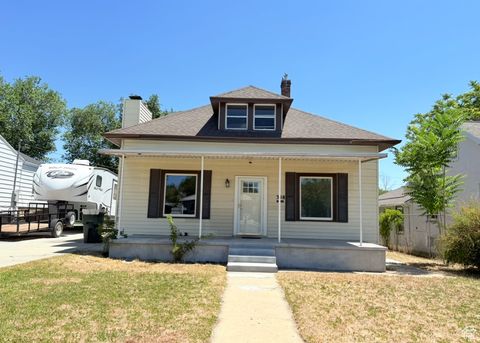
Active
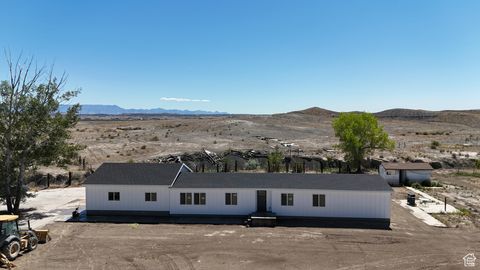
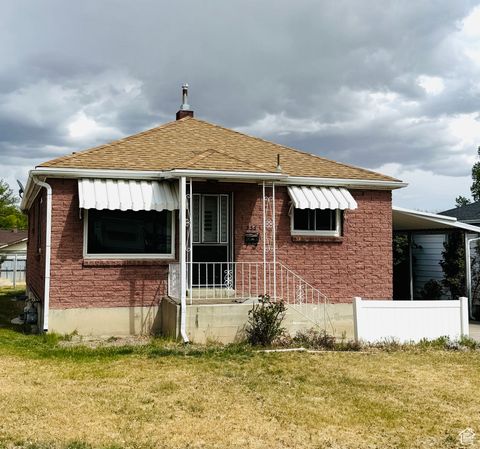
$358,000
5
bds
|
3
ba
|
3,388
sqft
|
built
1946
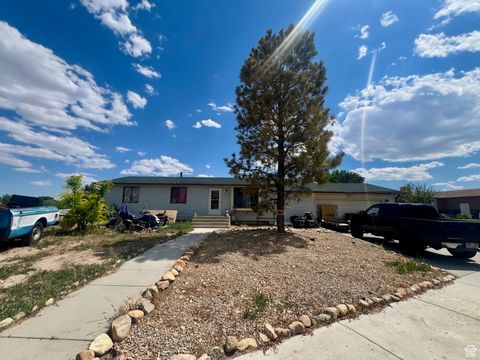
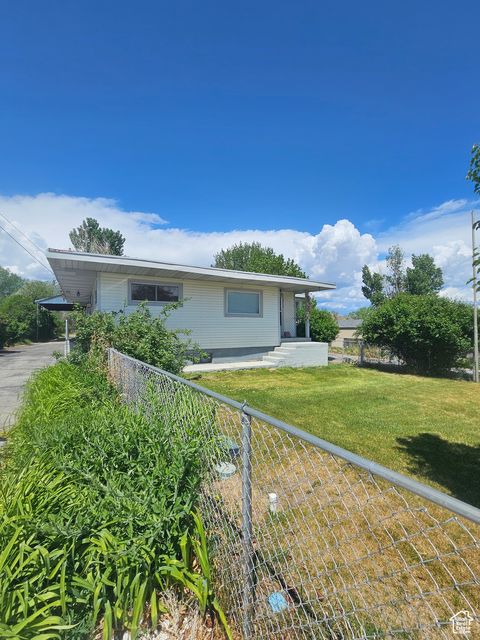
824 N 200 E, Price, UT 84501
$97
Cash flow
1.4%
Cash-on-Cash Return
6.0%
Cap rate
0.8%
Rent to Value Ratio
39 out of 56 properties for sale in Carbon County
Limited Results Shown
Create a free account, or log in to reveal all property listings and enjoy the complete experience.
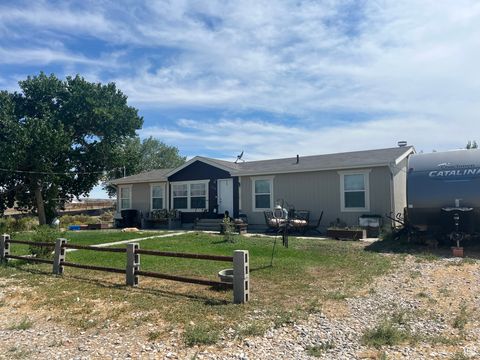
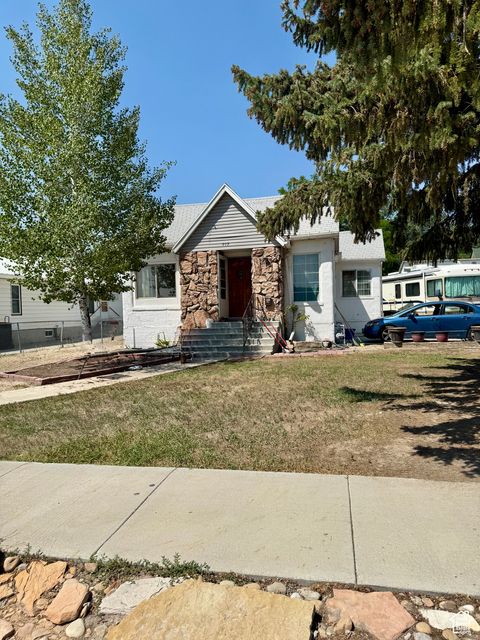
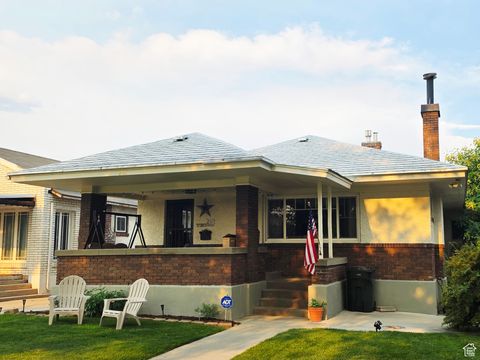
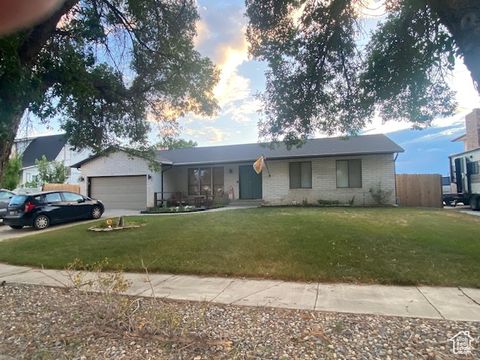
Active
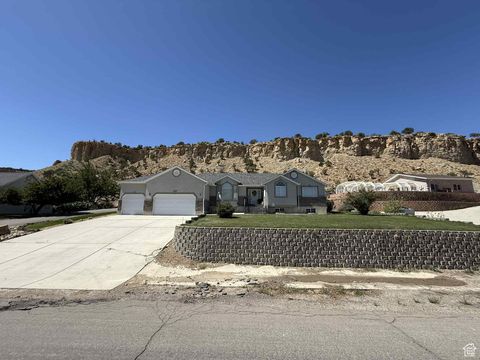
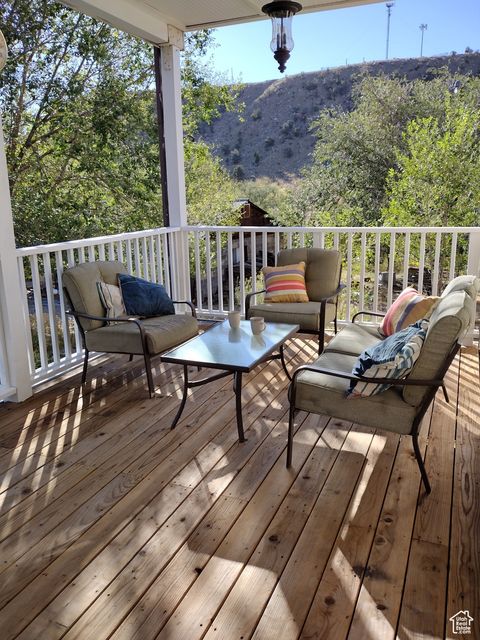
$350,000
3
bds
|
2
ba
|
1,512
sqft
|
built
2010
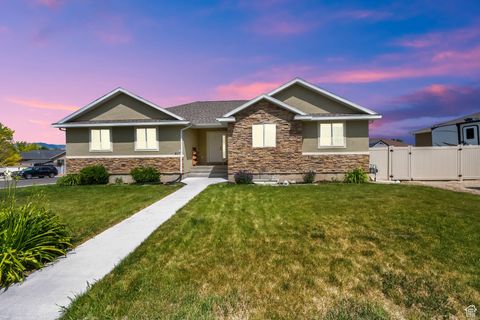
7130 E 2100 S, Price, UT 84501
$-651
Cash flow
-9.7%
Cash-on-Cash Return
3.4%
Cap rate
0.5%
Rent to Value Ratio
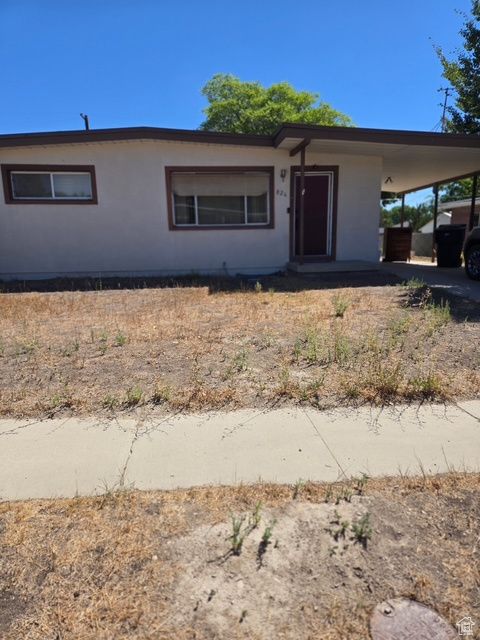
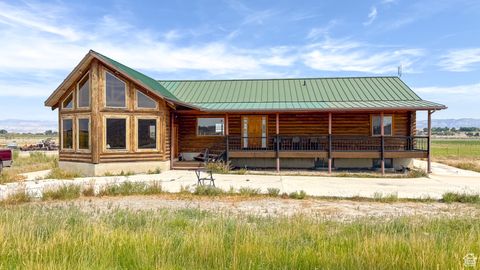
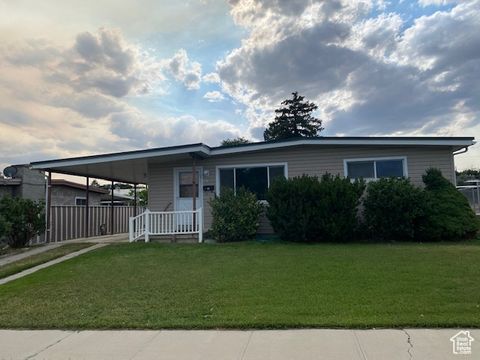
Active
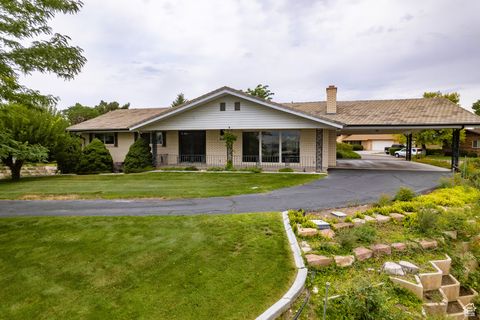
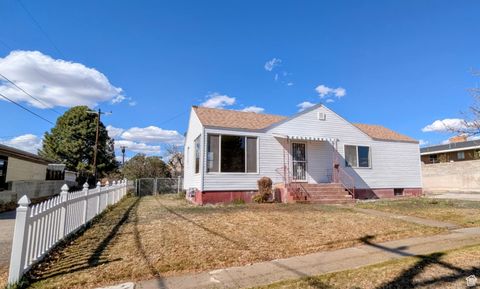
$275,000
4
bds
|
2
ba
|
1,904
sqft
|
built
1956
826 N 900 E, Price, UT 84501
$-151
Cash flow
-2.9%
Cash-on-Cash Return
5.0%
Cap rate
0.7%
Rent to Value Ratio
Active
$285,000
5
bds
|
2
ba
|
2,025
sqft
|
built
1999
806 S 300 E, Price, UT 84501
$-361
Cash flow
-6.6%
Cash-on-Cash Return
4.2%
Cap rate
0.6%
Rent to Value Ratio
Active
$379,999
4
bds
|
3
ba
|
1,925
sqft
|
built
1977
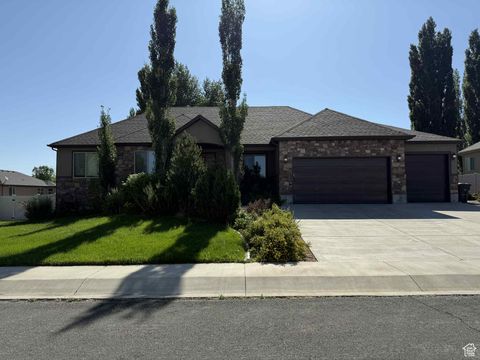
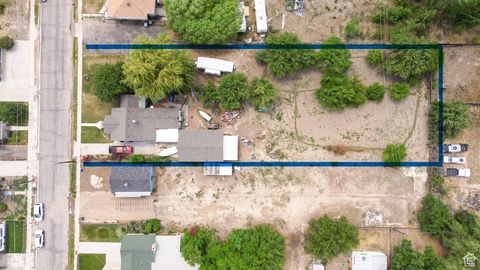
4190 E 2750 S, Price, UT 84501
$-660
Cash flow
-9.1%
Cash-on-Cash Return
3.6%
Cap rate
0.5%
Rent to Value Ratio
Active
$615,000
3
bds
|
2
ba
|
4,602
sqft
|
built
1997
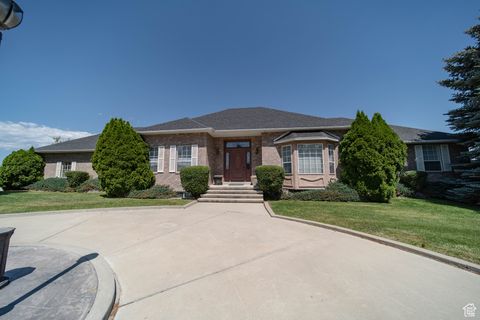
2485 N 2650 W, Helper, UT 84526
$-1,584
Cash flow
-13.4%
Cash-on-Cash Return
2.6%
Cap rate
0.4%
Rent to Value Ratio
Active
$599,000
6
bds
|
3
ba
|
3,777
sqft
|
built
1967
349 Crestview Dr, Price, UT 84501
$-1,853
Cash flow
-16.1%
Cash-on-Cash Return
2.0%
Cap rate
0.3%
Rent to Value Ratio
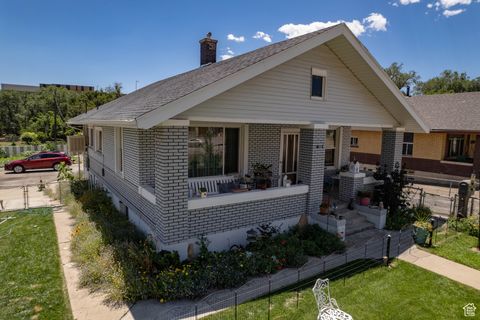
Active
$299,000
5
bds
|
2
ba
|
2,088
sqft
|
built
1926
144 S 300 E, Price, UT 84501
$-401
Cash flow
-7.0%
Cash-on-Cash Return
4.1%
Cap rate
0.5%
Rent to Value Ratio
Active
$270,000
3
bds
|
2
ba
|
1,700
sqft
|
built
1928
280 W 500 S, Price, UT 84501
$-492
Cash flow
-9.5%
Cash-on-Cash Return
3.5%
Cap rate
0.4%
Rent to Value Ratio
Active
$265,000
4
bds
|
2
ba
|
2,004
sqft
|
built
1948
449 E 300 S, Price, UT 84501
$-230
Cash flow
-4.5%
Cash-on-Cash Return
4.6%
Cap rate
0.6%
Rent to Value Ratio
Active
$995,000
4
bds
|
3
ba
|
3,707
sqft
|
built
1998
3367 E 4750 S, Wellington, UT 84542
$-3,768
Cash flow
-19.8%
Cash-on-Cash Return
1.1%
Cap rate
0.2%
Rent to Value Ratio
Active
$240,000
2
bds
|
1
ba
|
1,536
sqft
|
built
1944
1945 W 4100 N, Helper, UT 84526
$-477
Cash flow
-10.4%
Cash-on-Cash Return
3.3%
Cap rate
0.5%
Rent to Value Ratio
Active
$430,000
3
bds
|
3
ba
|
2,973
sqft
|
built
2010
1689 Eastridge Rd, Price, UT 84501
$-703
Cash flow
-8.5%
Cash-on-Cash Return
3.7%
Cap rate
0.5%
Rent to Value Ratio
Active
$325,000
4
bds
|
2
ba
|
2,482
sqft
|
built
1924
240 N Carbon Ave, Price, UT 84501
$-304
Cash flow
-4.9%
Cash-on-Cash Return
4.6%
Cap rate
0.6%
Rent to Value Ratio
Active
$300,000
3
bds
|
2
ba
|
1,904
sqft
|
built
1955
827 N 900 E, Price, UT 84501
$-681
Cash flow
-11.8%
Cash-on-Cash Return
3.0%
Cap rate
0.4%
Rent to Value Ratio
Active
$420,000
5
bds
|
3
ba
|
3,289
sqft
|
built
1978
703 Windsor Rd, Price, UT 84501
$-482
Cash flow
-6.0%
Cash-on-Cash Return
4.3%
Cap rate
0.6%
Rent to Value Ratio
Active
$415,000
5
bds
|
3
ba
|
2,434
sqft
|
built
1916
358 N 300 E, Price, UT 84501
$-526
Cash flow
-6.6%
Cash-on-Cash Return
4.2%
Cap rate
0.6%
Rent to Value Ratio
Active
$410,000
4
bds
|
2
ba
|
3,643
sqft
|
built
1927
57 C St, Helper, UT 84526
$-1,033
Cash flow
-13.1%
Cash-on-Cash Return
2.7%
Cap rate
0.4%
Rent to Value Ratio
Active
$389,900
3
bds
|
2
ba
|
2,232
sqft
|
built
1922
169 N Main St, Helper, UT 84526
$-631
Cash flow
-8.4%
Cash-on-Cash Return
3.7%
Cap rate
0.5%
Rent to Value Ratio
Active
$385,000
5
bds
|
3
ba
|
2,898
sqft
|
built
1977
631 W Main St, Wellington, UT 84542
$-450
Cash flow
-6.1%
Cash-on-Cash Return
4.3%
Cap rate
0.6%
Rent to Value Ratio
Active
$379,999
5
bds
|
2
ba
|
2,208
sqft
|
built
1976
546 Windsor Rd, Price, UT 84501
$-706
Cash flow
-9.7%
Cash-on-Cash Return
3.4%
Cap rate
0.5%
Rent to Value Ratio
Active
$449,900
5
bds
|
2
ba
|
2,596
sqft
|
built
1977
7166 S 4000 E, Price, UT 84501
$-1,072
Cash flow
-12.4%
Cash-on-Cash Return
2.8%
Cap rate
0.4%
Rent to Value Ratio
Active
$282,000
2
bds
|
2
ba
|
720
sqft
|
built
1970
1086 E Main St, Wellington, UT 84542
$-678
Cash flow
-12.5%
Cash-on-Cash Return
2.8%
Cap rate
0.4%
Rent to Value Ratio
Active
$650,000
6
bds
|
4
ba
|
3,746
sqft
|
built
2012
420 N Josephine Ln, Price, UT 84501
$-1,585
Cash flow
-12.7%
Cash-on-Cash Return
2.8%
Cap rate
0.4%
Rent to Value Ratio
Active
$299,900
3
bds
|
2
ba
|
1,290
sqft
|
built
1950
275 N 500 W, Price, UT 84501
$-459
Cash flow
-8.0%
Cash-on-Cash Return
3.8%
Cap rate
0.5%
Rent to Value Ratio
Active
$365,000
5
bds
|
2
ba
|
2,506
sqft
|
built
1983
675 W 2550 S, Price, UT 84501
$-629
Cash flow
-9.0%
Cash-on-Cash Return
3.6%
Cap rate
0.5%
Rent to Value Ratio
Active
$590,000
6
bds
|
3
ba
|
3,343
sqft
|
built
2014
126 S Balsam Way, Price, UT 84501
$-1,647
Cash flow
-14.6%
Cash-on-Cash Return
2.3%
Cap rate
0.3%
Rent to Value Ratio
Active
$289,000
5
bds
|
2
ba
|
2,112
sqft
|
built
1941
260 S 500 W, Price, UT 84501
$-573
Cash flow
-10.3%
Cash-on-Cash Return
3.3%
Cap rate
0.4%
Rent to Value Ratio
Active
$615,000
4
bds
|
3
ba
|
5,825
sqft
|
built
1991
1416 E Valley View Dr, Wellington, UT 84542
$-1,711
Cash flow
-14.5%
Cash-on-Cash Return
2.3%
Cap rate
0.4%
Rent to Value Ratio
Active
$295,000
4
bds
|
1
ba
|
3,074
sqft
|
built
1921
410 Rose Ave, Price, UT 84501
$-498
Cash flow
-8.8%
Cash-on-Cash Return
3.7%
Cap rate
0.5%
Rent to Value Ratio
Active
$369,500
4
bds
|
3
ba
|
2,667
sqft
|
built
1959
2798 S Highway 10, Price, UT 84501
$-925
Cash flow
-13.1%
Cash-on-Cash Return
2.7%
Cap rate
0.4%
Rent to Value Ratio
Active
$320,000
3
bds
|
3
ba
|
2,177
sqft
|
built
1945
157 E 100 N, Wellington, UT 84542
$-665
Cash flow
-10.8%
Cash-on-Cash Return
3.2%
Cap rate
0.4%
Rent to Value Ratio
Active
$259,000
4
bds
|
2
ba
|
1,950
sqft
|
built
1958
836 N 300 E, Price, UT 84501
$-505
Cash flow
-10.2%
Cash-on-Cash Return
3.3%
Cap rate
0.5%
Rent to Value Ratio
Active
$560,000
4
bds
|
3
ba
|
3,732
sqft
|
built
1930
653 Spring Canyon Rd, Helper, UT 84526
$-1,456
Cash flow
-13.6%
Cash-on-Cash Return
2.6%
Cap rate
0.4%
Rent to Value Ratio
Active
$259,000
3
bds
|
2
ba
|
1,944
sqft
|
built
1946
461 E 600 N, Price, UT 84501
$-508
Cash flow
-10.2%
Cash-on-Cash Return
3.3%
Cap rate
0.5%
Rent to Value Ratio

Active
$375,000
3
bds
|
2
ba
|
2,225
sqft
|
built
1923
5931 N 550 E, Kenilworth, UT 84529
$-448
Cash flow
-6.2%
Cash-on-Cash Return
4.2%
Cap rate
0.6%
Rent to Value Ratio
Active
$875,000
3
bds
|
2
ba
|
2,119
sqft
|
built
1930
276 E 3000 S, Price, UT 84501
$-2,396
Cash flow
-14.3%
Cash-on-Cash Return
2.4%
Cap rate
0.3%
Rent to Value Ratio
Active
$359,000
5
bds
|
3
ba
|
3,264
sqft
|
built
1966
885 N 600 E, Price, UT 84501
$-122
Cash flow
-1.8%
Cash-on-Cash Return
5.3%
Cap rate
0.7%
Rent to Value Ratio