Davis County Investment Properties for Sale
Browse homes for sale and investment properties in Davis County. Refine your search by price, property type, or more.
Best cash flowing properties in Davis County
Active
$305,000
2
bds
|
2
ba
|
963
sqft
|
built
2019
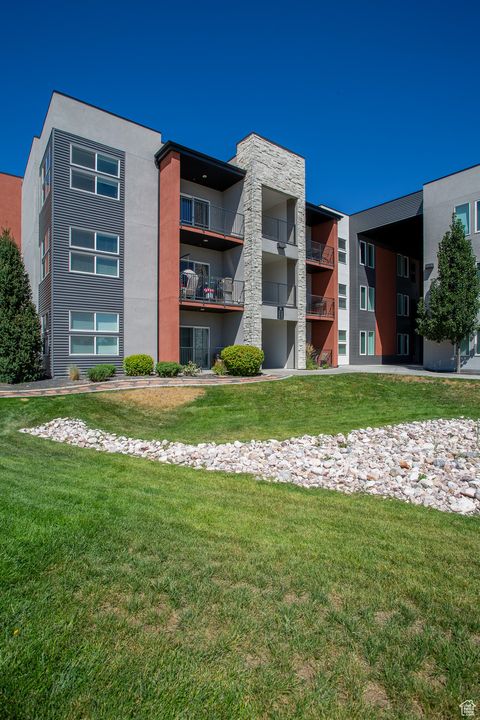
875 S Depot St, Clearfield, UT 84015
$-553
Cash flow
-9.5%
Cash-on-Cash Return
3.5%
Cap rate
0.6%
Rent to Value Ratio
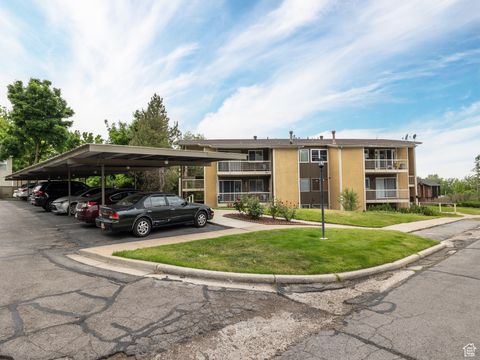
Active
$325,000
2
bds
|
2
ba
|
1,139
sqft
|
built
1973
288 Peach Ln, Bountiful, UT 84010
$-606
Cash flow
-9.7%
Cash-on-Cash Return
3.4%
Cap rate
0.6%
Rent to Value Ratio
271 out of 326 properties for sale in Davis County
Limited Results Shown
Create a free account, or log in to reveal all property listings and enjoy the complete experience.
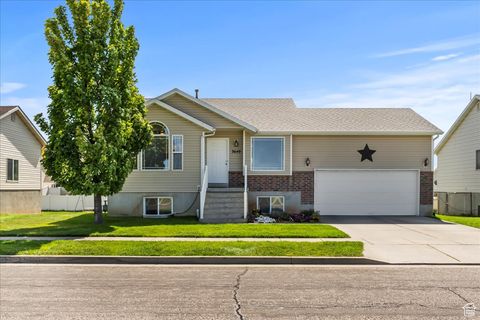
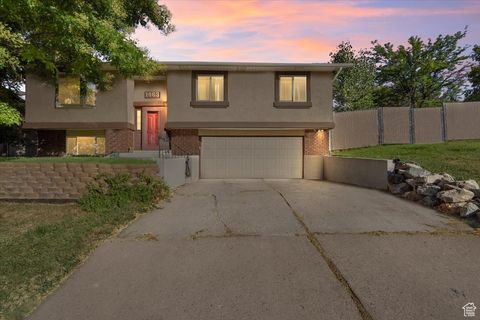
Active
$500,000
5
bds
|
3
ba
|
2,207
sqft
|
built
2003
3649 W 800 S, Syracuse, UT 84075
$-837
Cash flow
-8.7%
Cash-on-Cash Return
3.7%
Cap rate
0.5%
Rent to Value Ratio
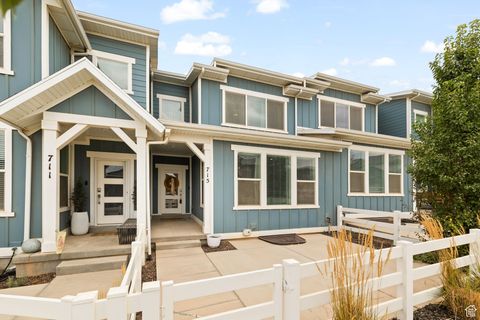
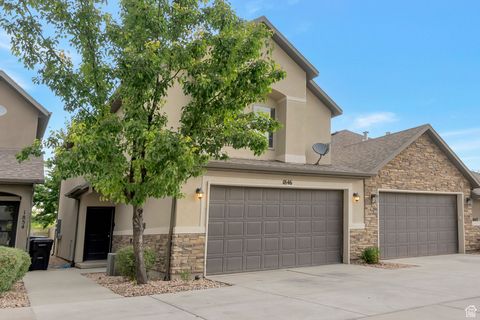
Active
$539,000
3
bds
|
3
ba
|
2,354
sqft
|
built
2021
715 S Miller Ave, North Salt Lake, UT 84054
$-1,359
Cash flow
-13.2%
Cash-on-Cash Return
2.7%
Cap rate
0.4%
Rent to Value Ratio
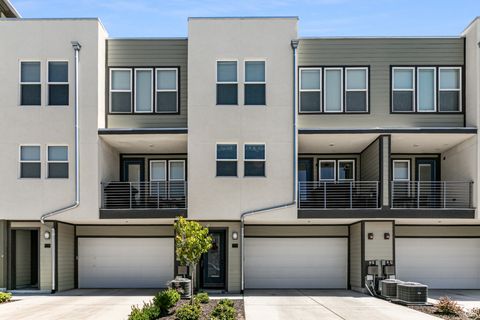
Active
$565,000
4
bds
|
3
ba
|
2,800
sqft
|
built
2008
2318 S 3450 W, Syracuse, UT 84075
$-993
Cash flow
-9.2%
Cash-on-Cash Return
3.6%
Cap rate
0.5%
Rent to Value Ratio
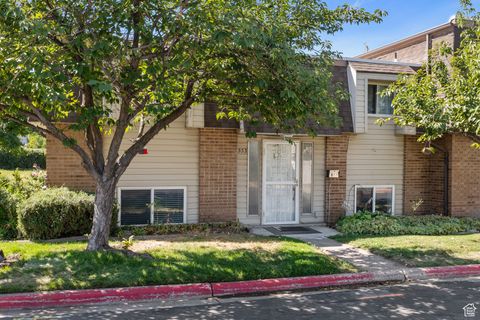
Active
$399,900
3
bds
|
3
ba
|
1,445
sqft
|
built
2010
2887 N 1175 W, Layton, UT 84041
$-784
Cash flow
-10.2%
Cash-on-Cash Return
3.3%
Cap rate
0.5%
Rent to Value Ratio
Active
$495,000
5
bds
|
3
ba
|
2,080
sqft
|
built
1977
2687 N 1450 E, Layton, UT 84040
$-800
Cash flow
-8.4%
Cash-on-Cash Return
3.7%
Cap rate
0.5%
Rent to Value Ratio
Active
$870,000
3
bds
|
2
ba
|
1,872
sqft
|
built
1949
414 E 2625 N, Layton, UT 84041
$-3,084
Cash flow
-18.5%
Cash-on-Cash Return
1.4%
Cap rate
0.2%
Rent to Value Ratio
Active
$515,000
4
bds
|
3
ba
|
2,257
sqft
|
built
1979
1463 Kays Creek Dr, Layton, UT 84040
$-1,051
Cash flow
-10.6%
Cash-on-Cash Return
3.2%
Cap rate
0.4%
Rent to Value Ratio
Active
$449,000
3
bds
|
3
ba
|
1,548
sqft
|
built
2014
1846 W 2280 S, Woods Cross, UT 84087
$-1,037
Cash flow
-12.0%
Cash-on-Cash Return
2.9%
Cap rate
0.5%
Rent to Value Ratio
Active
$420,000
2
bds
|
3
ba
|
1,342
sqft
|
built
2024
604 N Sego Way, Farmington, UT 84025
$-694
Cash flow
-8.6%
Cash-on-Cash Return
3.7%
Cap rate
0.5%
Rent to Value Ratio
Active
$400,000
4
bds
|
2
ba
|
1,888
sqft
|
built
1974
553 N 200 W, Bountiful, UT 84010
$-852
Cash flow
-11.1%
Cash-on-Cash Return
3.1%
Cap rate
0.6%
Rent to Value Ratio
Active
$600,000
3
bds
|
3
ba
|
2,056
sqft
|
built
2023
2735 S Shoreline Dr, Syracuse, UT 84075
$-1,399
Cash flow
-12.2%
Cash-on-Cash Return
2.9%
Cap rate
0.4%
Rent to Value Ratio
Active
$420,000
3
bds
|
3
ba
|
1,497
sqft
|
built
2012
293 W 710 N, Centerville, UT 84014
$-816
Cash flow
-10.1%
Cash-on-Cash Return
3.3%
Cap rate
0.5%
Rent to Value Ratio
Active
$724,000
6
bds
|
3
ba
|
3,236
sqft
|
built
1976
1940 S Main St, Clearfield, UT 84015
$-1,795
Cash flow
-12.9%
Cash-on-Cash Return
2.7%
Cap rate
0.4%
Rent to Value Ratio
Active
$595,000
5
bds
|
4
ba
|
2,886
sqft
|
built
1998
6378 Raymond Dr, South Weber, UT 84405
$-1,260
Cash flow
-11.0%
Cash-on-Cash Return
3.1%
Cap rate
0.4%
Rent to Value Ratio
Active
$725,000
5
bds
|
4
ba
|
4,350
sqft
|
built
2006
2816 W 960 N, Clinton, UT 84015
$-1,920
Cash flow
-13.8%
Cash-on-Cash Return
2.5%
Cap rate
0.4%
Rent to Value Ratio
Active
$675,000
4
bds
|
3
ba
|
2,849
sqft
|
built
1966
1399 E Millbrook Way, Bountiful, UT 84010
$-1,747
Cash flow
-13.5%
Cash-on-Cash Return
2.6%
Cap rate
0.4%
Rent to Value Ratio
Active
$479,990
5
bds
|
3
ba
|
2,352
sqft
|
built
1975
1665 W 1960 N, Layton, UT 84041
$-871
Cash flow
-9.5%
Cash-on-Cash Return
3.5%
Cap rate
0.5%
Rent to Value Ratio
Active
$1,349,900
7
bds
|
5
ba
|
7,666
sqft
|
built
2010
2368 E 8300 S, South Weber, UT 84405
$-4,389
Cash flow
-17.0%
Cash-on-Cash Return
1.8%
Cap rate
0.3%
Rent to Value Ratio
Active
$439,000
4
bds
|
2
ba
|
1,804
sqft
|
built
1974
2177 N 450 W, Sunset, UT 84015
$-936
Cash flow
-11.1%
Cash-on-Cash Return
3.1%
Cap rate
0.4%
Rent to Value Ratio
Active
$365,000
2
bds
|
2
ba
|
1,074
sqft
|
built
2005
448 Kent Dr, North Salt Lake, UT 84054
$-818
Cash flow
-11.7%
Cash-on-Cash Return
3.0%
Cap rate
0.5%
Rent to Value Ratio
Active
$415,000
3
bds
|
3
ba
|
1,475
sqft
|
built
2009
1074 Allington Dr, North Salt Lake, UT 84054
$-950
Cash flow
-11.9%
Cash-on-Cash Return
2.9%
Cap rate
0.5%
Rent to Value Ratio
Active
$659,000
5
bds
|
4
ba
|
3,585
sqft
|
built
1994
1225 N 900 E, Bountiful, UT 84010
$-1,000
Cash flow
-7.9%
Cash-on-Cash Return
3.9%
Cap rate
0.5%
Rent to Value Ratio
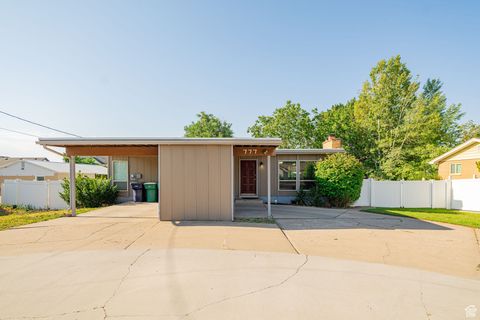
Active
$424,999
3
bds
|
2
ba
|
2,340
sqft
|
built
1970
777 W 300 N, Clearfield, UT 84015
$-614
Cash flow
-7.5%
Cash-on-Cash Return
3.9%
Cap rate
0.5%
Rent to Value Ratio

Active
$645,000
5
bds
|
3
ba
|
3,100
sqft
|
built
2019
1913 S 525 W, Syracuse, UT 84075
$-1,585
Cash flow
-12.8%
Cash-on-Cash Return
2.7%
Cap rate
0.4%
Rent to Value Ratio
Active
$998,900
6
bds
|
3
ba
|
4,418
sqft
|
built
1990
614 S 850 E, Centerville, UT 84014
$-3,113
Cash flow
-16.3%
Cash-on-Cash Return
1.9%
Cap rate
0.3%
Rent to Value Ratio
Active
$449,990
3
bds
|
2
ba
|
1,404
sqft
|
built
1961
203 W 350 S, Kaysville, UT 84037
$-709
Cash flow
-8.2%
Cash-on-Cash Return
3.8%
Cap rate
0.5%
Rent to Value Ratio
Active
$435,000
3
bds
|
1
ba
|
1,070
sqft
|
built
1954
360 W 800 S, Bountiful, UT 84010
$-856
Cash flow
-10.3%
Cash-on-Cash Return
3.3%
Cap rate
0.5%
Rent to Value Ratio
Active
$667,000
4
bds
|
4
ba
|
2,728
sqft
|
built
1993
3033 S 400 E, Bountiful, UT 84010
$-1,613
Cash flow
-12.6%
Cash-on-Cash Return
2.8%
Cap rate
0.4%
Rent to Value Ratio

Active
$529,500
3
bds
|
2
ba
|
1,974
sqft
|
built
2005
1984 S 1500 W, Woods Cross, UT 84087
$-1,215
Cash flow
-12.0%
Cash-on-Cash Return
2.9%
Cap rate
0.4%
Rent to Value Ratio
Active
$794,000
6
bds
|
4
ba
|
3,845
sqft
|
built
2018
1947 E 7470 S, South Weber, UT 84405
$-1,617
Cash flow
-10.6%
Cash-on-Cash Return
3.2%
Cap rate
0.5%
Rent to Value Ratio
Active
$1,150,000
5
bds
|
4
ba
|
5,824
sqft
|
built
2007
872 Wellington Dr, Kaysville, UT 84037
$-2,783
Cash flow
-12.6%
Cash-on-Cash Return
2.8%
Cap rate
0.4%
Rent to Value Ratio
Active
$614,900
5
bds
|
3
ba
|
3,750
sqft
|
built
1996
1774 W 400 N, West Point, UT 84015
$-1,187
Cash flow
-10.1%
Cash-on-Cash Return
3.4%
Cap rate
0.5%
Rent to Value Ratio
Active
$1,300,000
4
bds
|
4
ba
|
5,145
sqft
|
built
2011
69 W Grove Creek Ln, Farmington, UT 84025
$-4,743
Cash flow
-19.0%
Cash-on-Cash Return
1.3%
Cap rate
0.2%
Rent to Value Ratio
Active
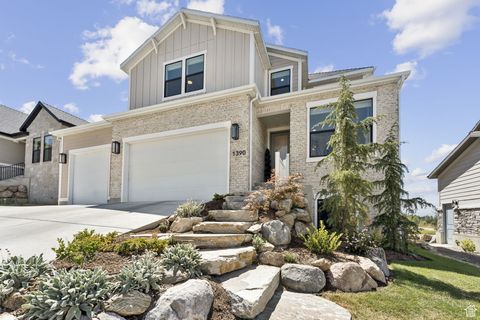
$988,500
4
bds
|
3
ba
|
4,362
sqft
|
built
2024
1390 E Orchard Ridge Ln, Kaysville, UT 84037
$-3,538
Cash flow
-18.7%
Cash-on-Cash Return
1.4%
Cap rate
0.2%
Rent to Value Ratio
Active
$545,000
4
bds
|
3
ba
|
2,004
sqft
|
built
1976
1086 Oakridge Dr, Layton, UT 84040
$-925
Cash flow
-8.9%
Cash-on-Cash Return
3.6%
Cap rate
0.5%
Rent to Value Ratio
Active
$535,000
6
bds
|
3
ba
|
2,784
sqft
|
built
1968
1093 N Bedford Dr, Kaysville, UT 84037
$-1,233
Cash flow
-12.0%
Cash-on-Cash Return
2.9%
Cap rate
0.4%
Rent to Value Ratio
Active
$539,999
4
bds
|
2
ba
|
1,700
sqft
|
built
1942
16 W 700 N, Bountiful, UT 84010
$-1,511
Cash flow
-14.6%
Cash-on-Cash Return
2.3%
Cap rate
0.3%
Rent to Value Ratio
Active
$725,000
6
bds
|
3
ba
|
3,489
sqft
|
built
2004
2136 W 2200 S, Syracuse, UT 84075
$-1,706
Cash flow
-12.3%
Cash-on-Cash Return
2.9%
Cap rate
0.3%
Rent to Value Ratio