Davis County Investment Properties for Sale
Browse homes for sale and investment properties in Davis County. Refine your search by price, property type, or more.
Best cash flowing properties in Davis County
Active
$220,000
1
bds
|
1
ba
|
672
sqft
|
built
1971
88 W 50 S, Centerville, UT 84014
$-331
Cash flow
-7.8%
Cash-on-Cash Return
3.9%
Cap rate
0.6%
Rent to Value Ratio
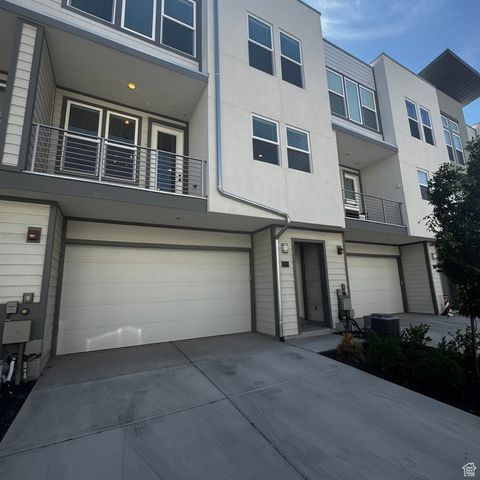
Active
$419,999
2
bds
|
3
ba
|
1,370
sqft
|
built
2023
597 N Nichole Ln, Farmington, UT 84025
$-501
Cash flow
-6.2%
Cash-on-Cash Return
4.2%
Cap rate
0.5%
Rent to Value Ratio
517 out of 597 properties for sale in Davis County
Limited Results Shown
Create a free account, or log in to reveal all property listings and enjoy the complete experience.
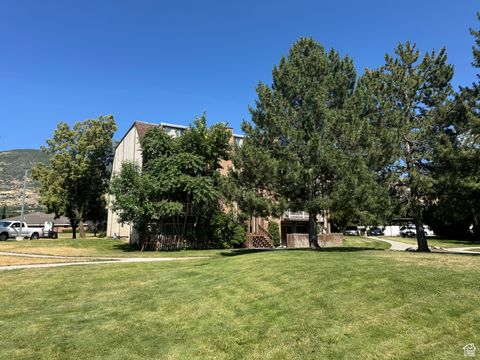
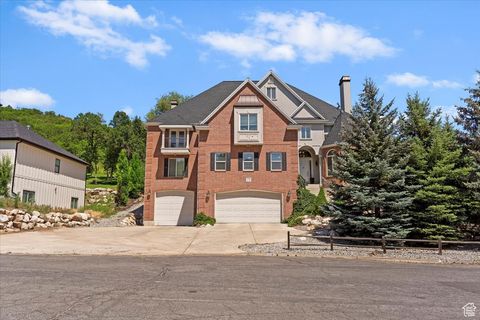
Active
$569,900
5
bds
|
3
ba
|
2,640
sqft
|
built
1965
952 N Kingswood Rd, Kaysville, UT 84037
$-1,137
Cash flow
-10.4%
Cash-on-Cash Return
3.3%
Cap rate
0.5%
Rent to Value Ratio
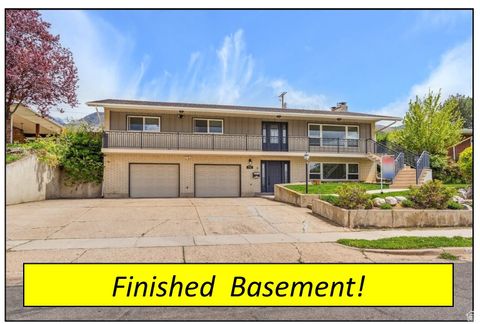
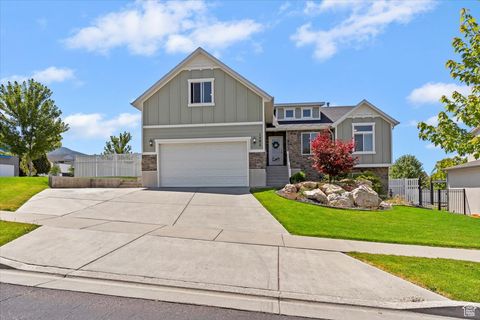
Active
$439,900
5
bds
|
2
ba
|
1,850
sqft
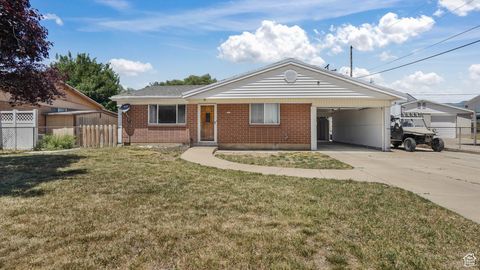
|
built
1970
594 W 2200 N, Clinton, UT 84015
$-1,072
Cash flow
-12.7%
Cash-on-Cash Return
3.3%
Cap rate
0.5%
Rent to Value Ratio
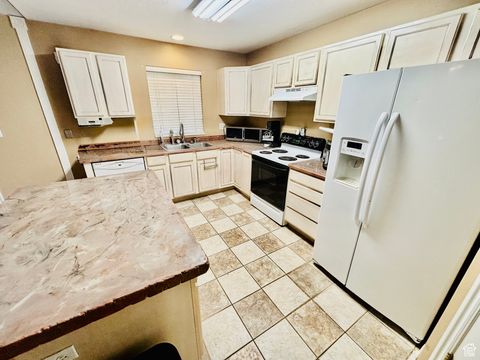
Active
$946,000
5
bds
|
4
ba
|
4,345
sqft
|
built
2006
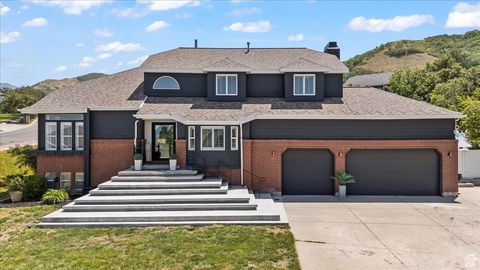
1053 Sage Ln, Fruit Heights, UT 84037
$-2,940
Cash flow
-16.2%
Cash-on-Cash Return
1.9%
Cap rate
0.3%
Rent to Value Ratio
Active
$949,900
3
bds
|
3
ba
|
3,658
sqft
|
built
2023
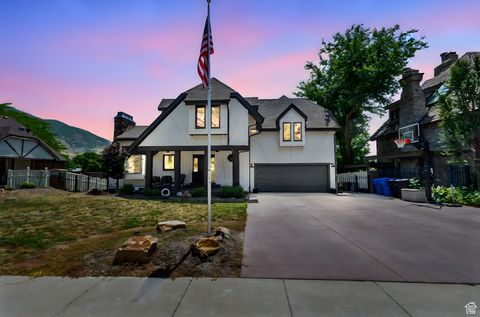
1378 E Orchard Ridge Ln, Kaysville, UT 84037
$-3,127
Cash flow
-17.2%
Cash-on-Cash Return
1.7%
Cap rate
0.3%
Rent to Value Ratio
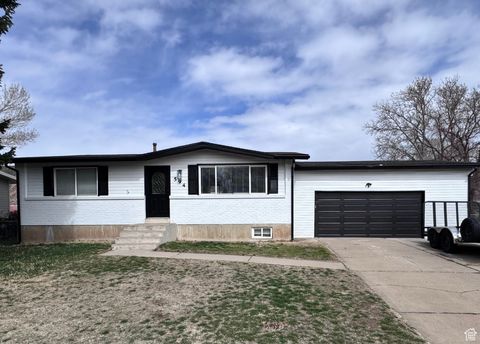
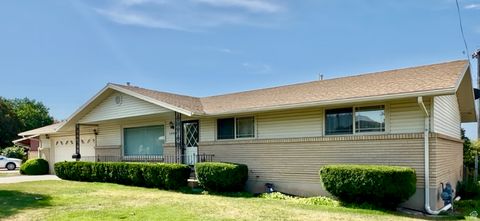
Active
$499,900
4
bds
|
2
ba
|
1,850
sqft
|
built
1973
2753 W 1700 N, Clinton, UT 84015
$-1,301
Cash flow
-13.6%
Cash-on-Cash Return
2.6%
Cap rate
0.4%
Rent to Value Ratio
Active
$750,000
5
bds
|
4
ba
|
4,070
sqft
|
built
2015
1308 E Canyon Dr, South Weber, UT 84405
$-1,723
Cash flow
-12.0%
Cash-on-Cash Return
2.9%
Cap rate
0.4%
Rent to Value Ratio
Active
$2,500,000
6
bds
|
5
ba
|
10,159
sqft
|
built
2000
2718 N 2125 E, Layton, UT 84040
$-10,437
Cash flow
-21.8%
Cash-on-Cash Return
0.7%
Cap rate
0.1%
Rent to Value Ratio
Active
$729,900
5
bds
|
3
ba
|
3,275
sqft
|
built
2015
1592 E Maple Way, Layton, UT 84040
$-1,261
Cash flow
-9.0%
Cash-on-Cash Return
3.6%
Cap rate
0.5%
Rent to Value Ratio
Active
$589,000
6
bds
|
3
ba
|
3,396
sqft
|
built
2000
1048 S 925 W, Woods Cross, UT 84087
$-1,142
Cash flow
-10.1%
Cash-on-Cash Return
3.4%
Cap rate
0.5%
Rent to Value Ratio
Active
$488,000
5
bds
|
3
ba
|
2,350
sqft
|
built
1972
1208 Valhalla Dr, Clearfield, UT 84015
$-1,483
Cash flow
-15.9%
Cash-on-Cash Return
2.6%
Cap rate
0.4%
Rent to Value Ratio
Active
$1,199,999
5
bds
|
4
ba
|
4,000
sqft
|
built
2019
1668 N 400 W, Farmington, UT 84025
$-4,171
Cash flow
-18.1%
Cash-on-Cash Return
1.5%
Cap rate
0.2%
Rent to Value Ratio
Active
$615,000
5
bds
|
3
ba
|
2,808
sqft
|
built
2017
1464 W 650 S, Syracuse, UT 84075
$-1,593
Cash flow
-13.5%
Cash-on-Cash Return
3.2%
Cap rate
0.5%
Rent to Value Ratio
Active
$549,900
5
bds
|
3
ba
|
2,760
sqft
|
built
2001
1209 N 1120 W, Clearfield, UT 84015
$-1,164
Cash flow
-11.0%
Cash-on-Cash Return
3.7%
Cap rate
0.5%
Rent to Value Ratio
Active
$285,000
2
bds
|
2
ba
|
817
sqft
|
built
1985
2095 S Main St, Bountiful, UT 84010
$-638
Cash flow
-11.7%
Cash-on-Cash Return
3.0%
Cap rate
0.6%
Rent to Value Ratio
Active
$495,000
6
bds
|
3
ba
|
2,326
sqft
|
built
1979
9 W Park Dr, Kaysville, UT 84037
$-757
Cash flow
-8.0%
Cash-on-Cash Return
3.8%
Cap rate
0.5%
Rent to Value Ratio
Active
$750,000
6
bds
|
3
ba
|
3,079
sqft
|
built
2006
1898 Silver Spur Way, Farmington, UT 84025
$-2,156
Cash flow
-15.0%
Cash-on-Cash Return
2.2%
Cap rate
0.3%
Rent to Value Ratio
Active
$920,000
4
bds
|
3
ba
|
4,682
sqft
|
built
1983
144 W 1600 N, Centerville, UT 84014
$-2,057
Cash flow
-11.7%
Cash-on-Cash Return
3.0%
Cap rate
0.4%
Rent to Value Ratio
Active
$899,900
6
bds
|
3
ba
|
4,560
sqft
|
built
1995
154 W 1100 N, Farmington, UT 84025
$-3,107
Cash flow
-18.0%
Cash-on-Cash Return
2.1%
Cap rate
0.3%
Rent to Value Ratio
Active
$875,000
3
bds
|
4
ba
|
2,406
sqft
|
built
2001
3931 Huntington Cir, Bountiful, UT 84010
$-2,312
Cash flow
-13.8%
Cash-on-Cash Return
2.5%
Cap rate
0.4%
Rent to Value Ratio
Active
$499,900
3
bds
|
3
ba
|
1,682
sqft
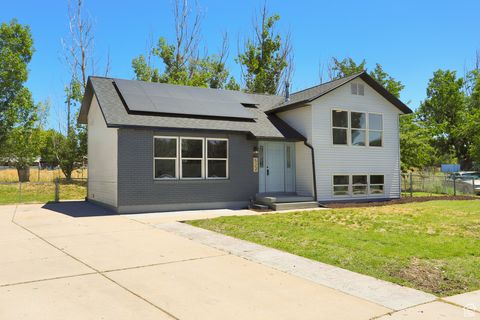
|
built
2021
79 N Orchard Dr, North Salt Lake, UT 84054
$-1,340
Cash flow
-14.0%
Cash-on-Cash Return
2.5%
Cap rate
0.4%
Rent to Value Ratio
Active
$475,000
3
bds
|
1
ba
|
1,154
sqft
|
built
1953
1795 S 50 W, Bountiful, UT 84010
$-1,068
Cash flow
-11.7%
Cash-on-Cash Return
3.0%
Cap rate
0.4%
Rent to Value Ratio
Active
$759,900
6
bds
|
4
ba
|
3,483
sqft
|
built
1999
1698 St Andrews Dr, Farmington, UT 84025
$-1,736
Cash flow
-11.9%
Cash-on-Cash Return
2.9%
Cap rate
0.4%
Rent to Value Ratio
Active
$769,000
4
bds
|
3
ba
|
3,430
sqft
|
built
1998
1309 W 1200 S, Woods Cross, UT 84087
$-1,772
Cash flow
-12.0%
Cash-on-Cash Return
2.9%
Cap rate
0.4%
Rent to Value Ratio
Active
$530,000
3
bds
|
3
ba
|
1,656
sqft
|
built
1999
637 W Chase Ln, Centerville, UT 84014
$-1,144
Cash flow
-11.3%
Cash-on-Cash Return
3.1%
Cap rate
0.4%
Rent to Value Ratio
Active
$450,000
4
bds
|
2
ba
|
1,535
sqft
|
built
2001
1666 N 160 W, Layton, UT 84041
$-909
Cash flow
-10.5%
Cash-on-Cash Return
3.3%
Cap rate
0.4%
Rent to Value Ratio
Active
$664,900
5
bds
|
3
ba
|
2,935
sqft
|
built
2016
2433 N 1445 W, Clinton, UT 84015
$-1,790
Cash flow
-14.0%
Cash-on-Cash Return
3.0%
Cap rate
0.4%
Rent to Value Ratio
Active
$700,000
3
bds
|
2
ba
|
3,470
sqft
|
built
2008
3535 W Overlook Dr, Layton, UT 84041
$-1,806
Cash flow
-13.5%
Cash-on-Cash Return
3.2%
Cap rate
0.4%
Rent to Value Ratio
Active
$949,900
8
bds
|
5
ba
|
4,951
sqft
|
built
2006
986 S View Crest Ln, Kaysville, UT 84037
$-2,746
Cash flow
-15.1%
Cash-on-Cash Return
2.2%
Cap rate
0.3%
Rent to Value Ratio
Active
$430,000
5
bds
|
3
ba
|
2,025
sqft
|
built
1995
1213 W 1640 N, Clinton, UT 84015
$-790
Cash flow
-9.6%
Cash-on-Cash Return
4.0%
Cap rate
0.5%
Rent to Value Ratio
Active
$497,000
2
bds
|
3
ba
|
1,707
sqft
|
built
2022
507 W 620 N, Centerville, UT 84014
$-941
Cash flow
-9.9%
Cash-on-Cash Return
3.4%
Cap rate
0.5%
Rent to Value Ratio
Active
$440,000
4
bds
|
2
ba
|
1,764
sqft
|
built
1971
604 W 1750 N, Clearfield, UT 84015
$-1,014
Cash flow
-12.0%
Cash-on-Cash Return
2.9%
Cap rate
0.4%
Rent to Value Ratio
Active
$1,175,000
6
bds
|
4
ba
|
4,533
sqft
|
built
1987
4104 Bridlewood Dr, Bountiful, UT 84010
$-2,542
Cash flow
-11.3%
Cash-on-Cash Return
3.1%
Cap rate
0.4%
Rent to Value Ratio
Active
$799,950
3
bds
|
3
ba
|
4,223
sqft
|
built
2018
1381 W 425 S, Layton, UT 84041
$-2,672
Cash flow
-17.4%
Cash-on-Cash Return
2.3%
Cap rate
0.3%
Rent to Value Ratio
Active
$555,000
4
bds
|
3
ba
|
2,208
sqft
|
built
2007
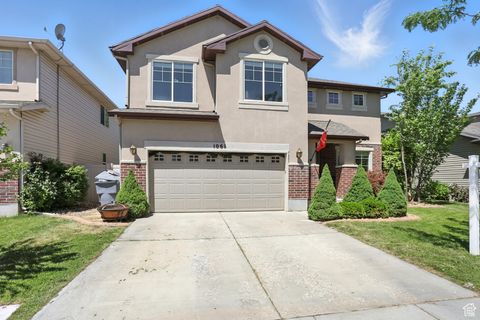
1061 Bellingham Ct, North Salt Lake, UT 84054
$-1,266
Cash flow
-11.9%
Cash-on-Cash Return
3.5%
Cap rate
0.5%
Rent to Value Ratio
Active
$959,000
5
bds
|
4
ba
|
4,462
sqft
|
built
1979
1371 Swinton Ln, Farmington, UT 84025
$-2,916
Cash flow
-15.9%
Cash-on-Cash Return
2.0%
Cap rate
0.3%
Rent to Value Ratio
Active
$400,000
3
bds
|
2
ba
|
1,054
sqft
|
built
1957
1254 Marilyn Dr, Layton, UT 84041
$-657
Cash flow
-8.6%
Cash-on-Cash Return
3.7%
Cap rate
0.5%
Rent to Value Ratio
Active
$429,900
4
bds
|
2
ba
|
1,782
sqft
|
built
1984
522 W 1060 N, Clinton, UT 84015
$-965
Cash flow
-11.7%
Cash-on-Cash Return
3.6%
Cap rate
0.5%
Rent to Value Ratio
Active
$429,500
3
bds
|
3
ba
|
1,510
sqft
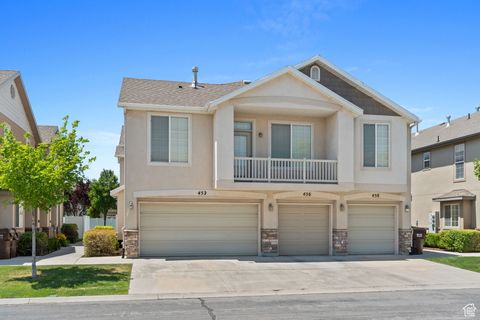
|
built
2005
452 Kent Dr, North Salt Lake, UT 84054
$-937
Cash flow
-11.4%
Cash-on-Cash Return
3.1%
Cap rate
0.5%
Rent to Value Ratio