Venice, FL Investment Properties for Sale
Browse homes for sale and investment properties in Venice, FL. Refine your search by price, property type, or more.
Best cash flowing properties in Venice, FL
Active
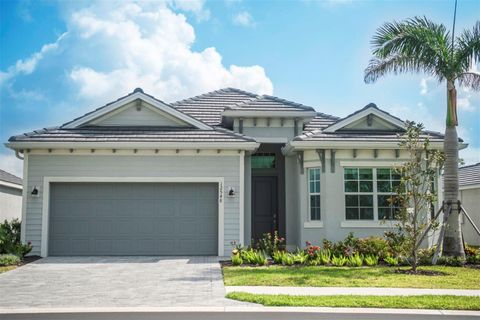
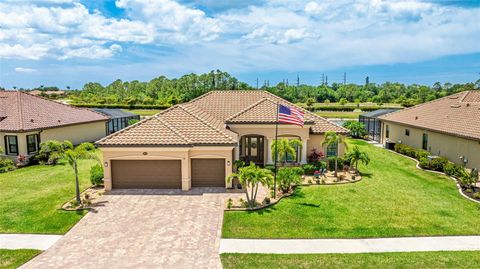
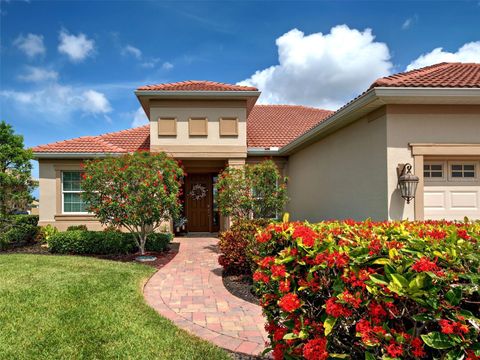
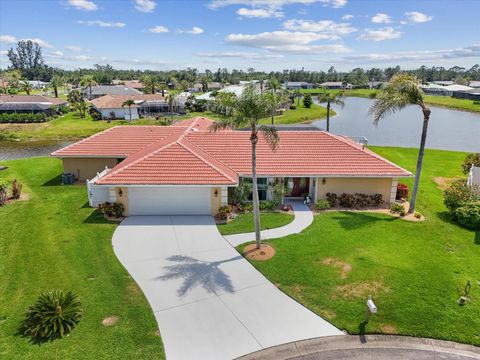
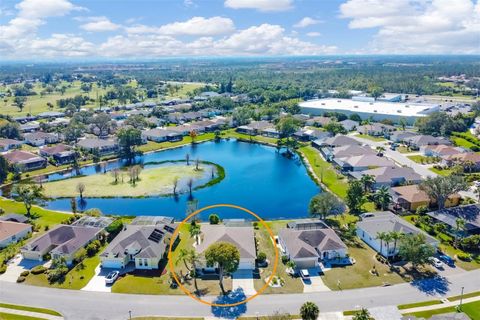
$749,000
3
bds
|
2
ba
|
2,078
sqft
|
built
2024
12548 Wellen Golf St, Venice, FL 34293
$2,791
Cash flow
19.4%
Cash-on-Cash Return
10.6%
Cap rate
1.5%
Rent to Value Ratio
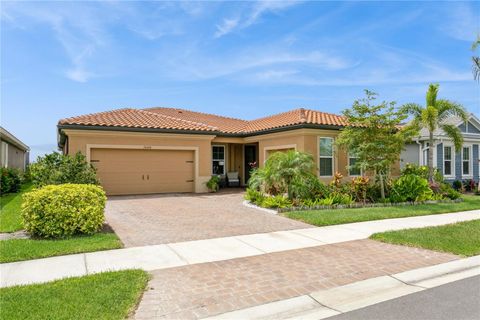
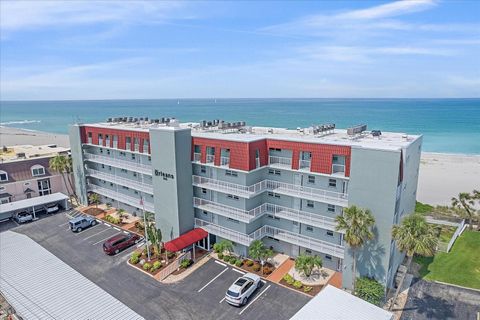
Active
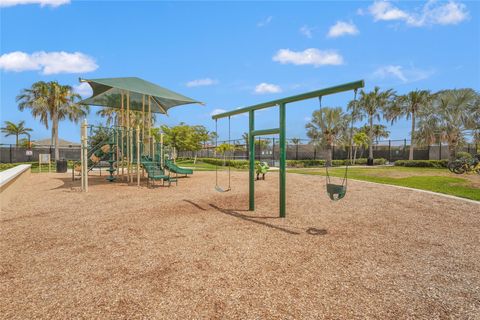
$214,900
3
bds
|
2
ba
|
1,223
sqft
|
built
1984
3002 Sail Pointe Cir, Venice, FL 34293
$193
Cash flow
4.7%
Cash-on-Cash Return
7.2%
Cap rate
1.0%
Rent to Value Ratio
785 out of 835 properties for sale in Venice, FL
Limited Results Shown
Create a free account, or log in to reveal all property listings and enjoy the complete experience.

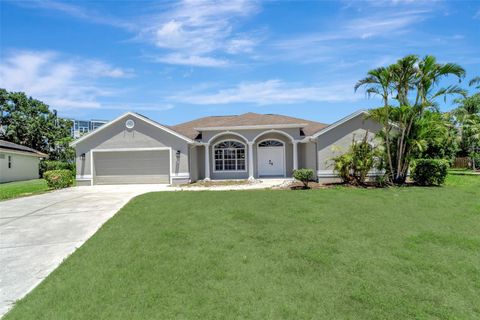
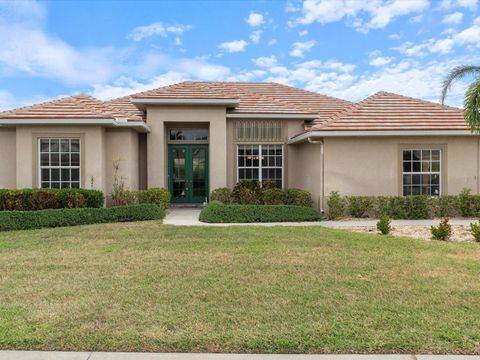
Active
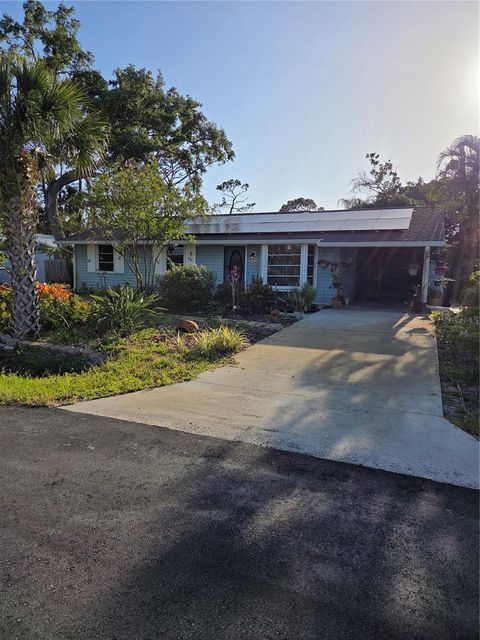
$350,000
3
bds
|
2
ba
|
1,718
sqft
|
built
2002
5331 Citadel Rd, Venice, FL 34293
$-27
Cash flow
-0.4%
Cash-on-Cash Return
6.1%
Cap rate
0.8%
Rent to Value Ratio
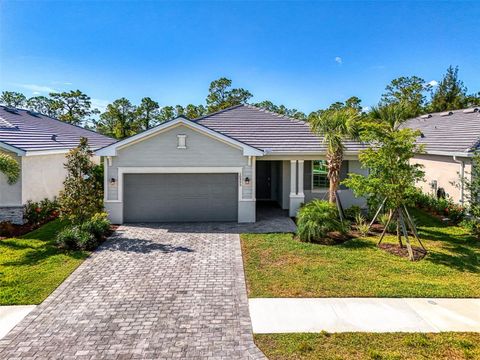
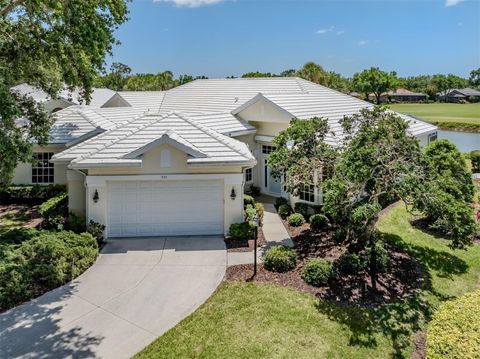
Active
$246,000
2
bds
|
2
ba
|
1,002
sqft
|
built
1982
433 Cerromar Ln, Venice, FL 34293
$-524
Cash flow
-11.1%
Cash-on-Cash Return
3.6%
Cap rate
0.9%
Rent to Value Ratio
Active
$799,000
3
bds
|
3
ba
|
2,294
sqft
|
built
2022
20660 Ovid Ln, Venice, FL 34293
$-2,547
Cash flow
-16.6%
Cash-on-Cash Return
2.3%
Cap rate
0.5%
Rent to Value Ratio
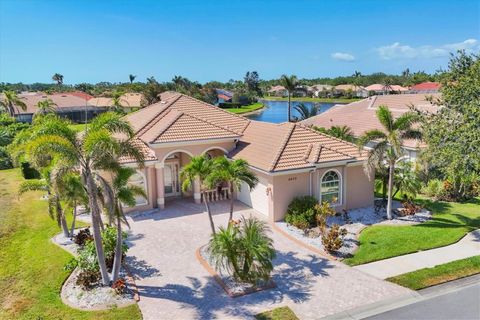
Active
$534,000
3
bds
|
2
ba
|
2,087
sqft
|
built
2004
168 Wading Bird Dr, Venice, FL 34292
$-1,572
Cash flow
-15.4%
Cash-on-Cash Return
2.6%
Cap rate
0.5%
Rent to Value Ratio
Active
$630,000
2
bds
|
2
ba
|
2,188
sqft
|
built
2004
4403 Via Del Villetti Dr, Venice, FL 34293
$-1,683
Cash flow
-13.9%
Cash-on-Cash Return
2.9%
Cap rate
0.5%
Rent to Value Ratio
Active
$548,000
2
bds
|
3
ba
|
1,388
sqft
|
built
1979
5879 Venisota Rd, Venice, FL 34293
$-1,248
Cash flow
-11.9%
Cash-on-Cash Return
3.4%
Cap rate
0.5%
Rent to Value Ratio
Active
$530,000
2
bds
|
2
ba
|
1,702
sqft
|
built
1979
1234 Paradise Way, Venice, FL 34285
$-1,034
Cash flow
-10.2%
Cash-on-Cash Return
3.8%
Cap rate
0.6%
Rent to Value Ratio
Active
$799,500
4
bds
|
3
ba
|
2,365
sqft
|
built
2020
20359 Cristoforo Pl, Venice, FL 34293
$-1,276
Cash flow
-8.3%
Cash-on-Cash Return
4.2%
Cap rate
0.6%
Rent to Value Ratio
Active
$825,000
3
bds
|
3
ba
|
2,567
sqft
|
built
2013
515 Sawgrass Bridge Rd, Venice, FL 34292
$-1,826
Cash flow
-11.5%
Cash-on-Cash Return
3.5%
Cap rate
0.6%
Rent to Value Ratio
Active
$699,900
4
bds
|
4
ba
|
2,537
sqft
|
built
2007
13167 Fernando St, Venice, FL 34293
$-1,810
Cash flow
-13.5%
Cash-on-Cash Return
3.0%
Cap rate
0.6%
Rent to Value Ratio
Active
$375,000
2
bds
|
2
ba
|
1,265
sqft
|
built
2002
1892 San Silvestro Dr, Venice, FL 34285
$-1,249
Cash flow
-17.4%
Cash-on-Cash Return
2.2%
Cap rate
0.6%
Rent to Value Ratio
Active
$780,000
4
bds
|
3
ba
|
3,043
sqft
|
built
1981
1836 Ironwood Ct, Venice, FL 34293
$-1,653
Cash flow
-11.1%
Cash-on-Cash Return
3.6%
Cap rate
0.5%
Rent to Value Ratio
Active
$525,000
2
bds
|
2
ba
|
872
sqft
|
built
1969
950 Tarpon Center Dr, Venice, FL 34285
$-2,268
Cash flow
-22.5%
Cash-on-Cash Return
1.0%
Cap rate
0.5%
Rent to Value Ratio
Active
$599,900
3
bds
|
2
ba
|
2,150
sqft
|
built
2001
857 Macaw Cir, Venice, FL 34285
$-1,625
Cash flow
-14.1%
Cash-on-Cash Return
2.9%
Cap rate
0.5%
Rent to Value Ratio

Active
$220,000
2
bds
|
2
ba
|
1,062
sqft
|
built
1986
770 Village Cir, Venice, FL 34292
$25
Cash flow
0.6%
Cash-on-Cash Return
6.3%
Cap rate
0.8%
Rent to Value Ratio
Active
$414,000
3
bds
|
3
ba
|
1,855
sqft
|
built
2024
10995 Pinot Dr, Venice, FL 34293
$-660
Cash flow
-8.3%
Cash-on-Cash Return
4.2%
Cap rate
0.7%
Rent to Value Ratio

Active
$425,000
3
bds
|
2
ba
|
1,737
sqft
|
built
2020
10805 Tarflower Dr, Venice, FL 34293
$-1,146
Cash flow
-14.1%
Cash-on-Cash Return
2.9%
Cap rate
0.8%
Rent to Value Ratio
Active
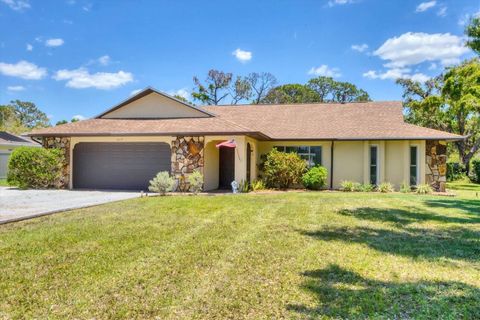
$355,000
3
bds
|
2
ba
|
1,541
sqft
|
built
1989
816 Wabash Rd, Venice, FL 34293
$-386
Cash flow
-5.7%
Cash-on-Cash Return
4.8%
Cap rate
0.7%
Rent to Value Ratio
Active
$950,000
3
bds
|
3
ba
|
2,142
sqft
|
built
2006
4717 Lemon Bay Dr, Venice, FL 34293
$-2,737
Cash flow
-15.0%
Cash-on-Cash Return
2.7%
Cap rate
0.4%
Rent to Value Ratio
Active
$339,000
2
bds
|
2
ba
|
1,377
sqft
|
built
1972
959 Cumberland Rd, Venice, FL 34293
$-201
Cash flow
-3.1%
Cash-on-Cash Return
5.4%
Cap rate
0.7%
Rent to Value Ratio
Active
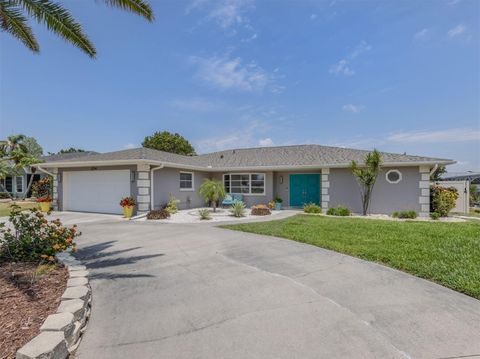
$799,000
3
bds
|
2
ba
|
1,824
sqft
|
built
2004
429 Riviera St, Venice, FL 34285
$-1,449
Cash flow
-9.5%
Cash-on-Cash Return
4.0%
Cap rate
0.6%
Rent to Value Ratio
Active
$657,000
3
bds
|
3
ba
|
2,194
sqft
|
built
2017
19337 Cruise Dr, Venice, FL 34292
$-1,405
Cash flow
-11.2%
Cash-on-Cash Return
3.6%
Cap rate
0.6%
Rent to Value Ratio

Active
$214,000
1
bds
|
1
ba
|
763
sqft
|
built
1979
1190 Bird Bay Way, Venice, FL 34285
$-519
Cash flow
-12.7%
Cash-on-Cash Return
3.2%
Cap rate
1.0%
Rent to Value Ratio
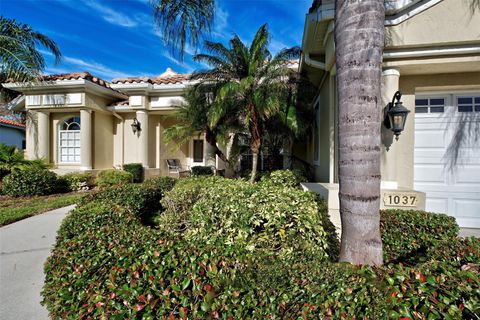
Active
$599,000
4
bds
|
3
ba
|
2,416
sqft
|
built
1994
1037 Beckley Cir, Venice, FL 34292
$-960
Cash flow
-8.4%
Cash-on-Cash Return
4.2%
Cap rate
0.7%
Rent to Value Ratio
Active
$409,900
3
bds
|
2
ba
|
1,511
sqft
|
built
2013
12478 Sagewood Dr, Venice, FL 34293
$-718
Cash flow
-9.1%
Cash-on-Cash Return
4.0%
Cap rate
0.7%
Rent to Value Ratio
Active
$439,900
3
bds
|
2
ba
|
1,687
sqft
|
built
2006
2416 Caraway Dr, Venice, FL 34292
$-550
Cash flow
-6.5%
Cash-on-Cash Return
4.6%
Cap rate
0.7%
Rent to Value Ratio
Active
$583,000
4
bds
|
3
ba
|
2,209
sqft
|
built
1995
4115 Hemingway Dr, Venice, FL 34293
$-1,051
Cash flow
-9.4%
Cash-on-Cash Return
4.0%
Cap rate
0.5%
Rent to Value Ratio
Active
$399,000
2
bds
|
2
ba
|
1,687
sqft
|
built
2017
11959 Tapestry Ln, Venice, FL 34293
$-998
Cash flow
-13.1%
Cash-on-Cash Return
3.1%
Cap rate
0.6%
Rent to Value Ratio

Active
$285,000
2
bds
|
2
ba
|
1,280
sqft
|
built
1998
819 Montrose Dr, Venice, FL 34293
$-174
Cash flow
-3.2%
Cash-on-Cash Return
5.4%
Cap rate
0.8%
Rent to Value Ratio

Active
$359,900
2
bds
|
2
ba
|
1,241
sqft
|
built
1989
710 Ironwood Dr, Venice, FL 34292
$-505
Cash flow
-7.3%
Cash-on-Cash Return
4.5%
Cap rate
0.6%
Rent to Value Ratio
Active
$324,900
3
bds
|
2
ba
|
1,101
sqft
|
built
1973
4700 Neptune Rd, Venice, FL 34293
$-185
Cash flow
-3.0%
Cash-on-Cash Return
5.5%
Cap rate
0.7%
Rent to Value Ratio
Active
$399,000
2
bds
|
2
ba
|
1,798
sqft
|
built
1991
553 Fallbrook Dr, Venice, FL 34292
$-1,212
Cash flow
-15.8%
Cash-on-Cash Return
2.5%
Cap rate
0.6%
Rent to Value Ratio

Active
$430,000
3
bds
|
3
ba
|
1,690
sqft
|
built
1968
1220 Lakeside Dr, Venice, FL 34293
$-570
Cash flow
-6.9%
Cash-on-Cash Return
4.6%
Cap rate
0.6%
Rent to Value Ratio

Active
$209,900
2
bds
|
1
ba
|
814
sqft
|
built
1972
340 Base Ave E, Venice, FL 34285
$-207
Cash flow
-5.1%
Cash-on-Cash Return
5.0%
Cap rate
1.0%
Rent to Value Ratio

Active
$600,000
3
bds
|
2
ba
|
2,370
sqft
|
built
1990
1447 Gleneagles Dr, Venice, FL 34292
$-1,334
Cash flow
-11.6%
Cash-on-Cash Return
3.5%
Cap rate
0.5%
Rent to Value Ratio

Active
$297,000
3
bds
|
3
ba
|
1,949
sqft
|
built
2021
20390 Lagente Cir, Venice, FL 34293
$-1,047
Cash flow
-18.4%
Cash-on-Cash Return
1.9%
Cap rate
0.7%
Rent to Value Ratio

Active
$129,000
2
bds
|
2
ba
|
940
sqft
|
built
1976
618 Bird Bay Dr S, Venice, FL 34285
$-276
Cash flow
-11.2%
Cash-on-Cash Return
3.6%
Cap rate
1.4%
Rent to Value Ratio
Active
$309,900
3
bds
|
2
ba
|
1,383
sqft
|
built
2004
4213 Vicenza Dr, Venice, FL 34293
$-488
Cash flow
-8.2%
Cash-on-Cash Return
4.3%
Cap rate
0.7%
Rent to Value Ratio