Vineyard, UT Investment Properties for Sale
Browse homes for sale and investment properties in Vineyard, UT. Refine your search by price, property type, or more.
Best cash flowing properties in Vineyard, UT
Active
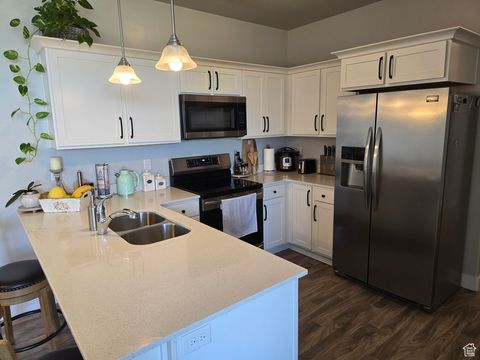
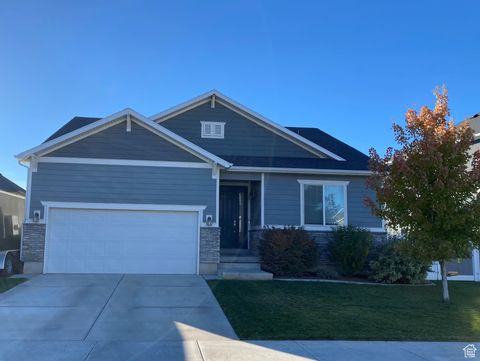
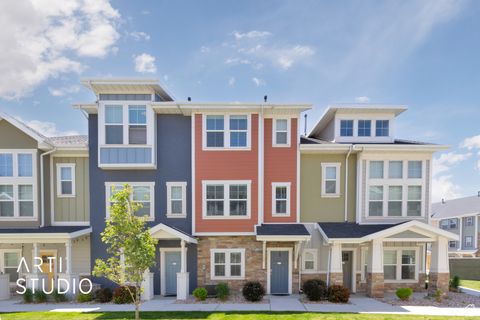
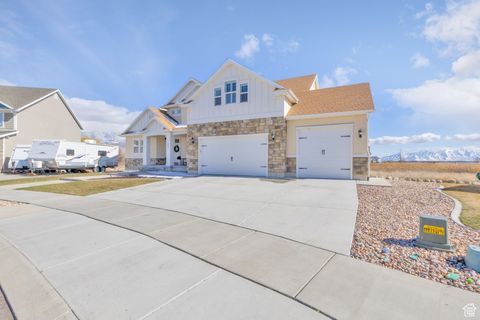
$370,000
3
bds
|
2
ba
|
1,272
sqft
|
built
2017
15 W Seasons Dr, Vineyard, UT 84059
$-776
Cash flow
-10.9%
Cash-on-Cash Return
3.2%
Cap rate
0.5%
Rent to Value Ratio
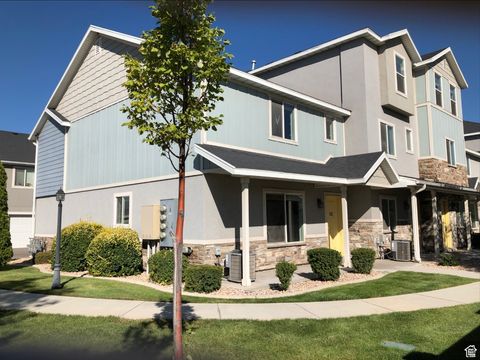
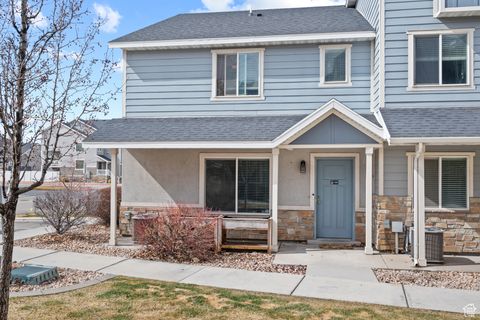
Active
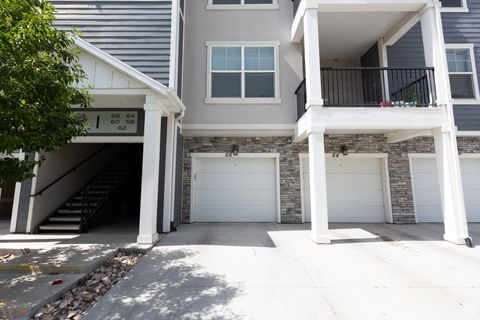
$360,000
3
bds
|
2
ba
|
1,265
sqft
|
built
2017
66 W Silver Springs Dr, Vineyard, UT 84059
$-867
Cash flow
-12.6%
Cash-on-Cash Return
2.8%
Cap rate
0.5%
Rent to Value Ratio
17 out of 35 properties for sale in Vineyard, UT
Limited Results Shown
Create a free account, or log in to reveal all property listings and enjoy the complete experience.
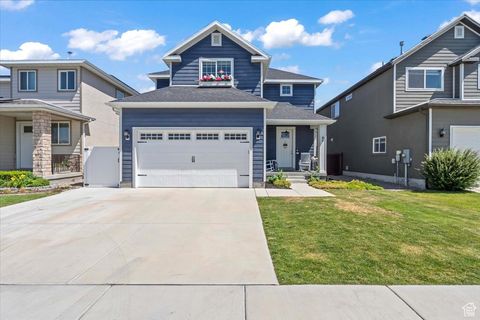
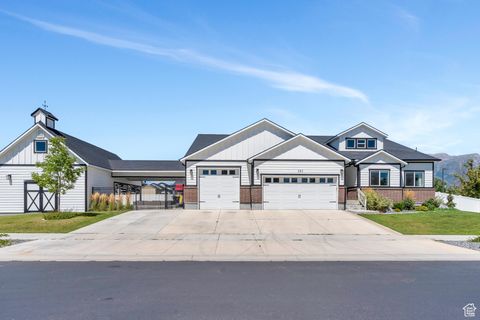
Active
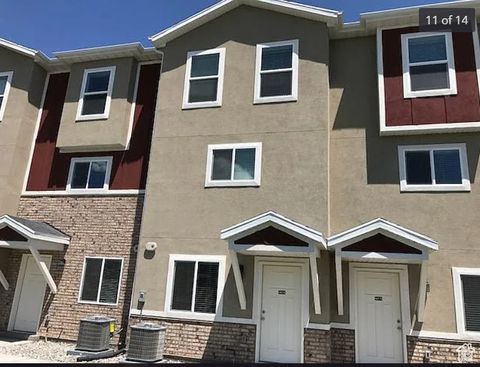
$374,000
3
bds
|
3
ba
|
1,845
sqft
|
built
2017
643 N 30 E, Vineyard, UT 84059
$-901
Cash flow
-12.6%
Cash-on-Cash Return
2.8%
Cap rate
0.5%
Rent to Value Ratio
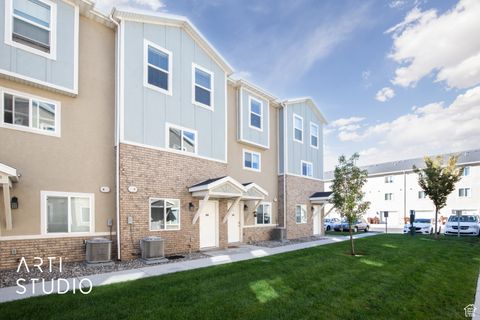
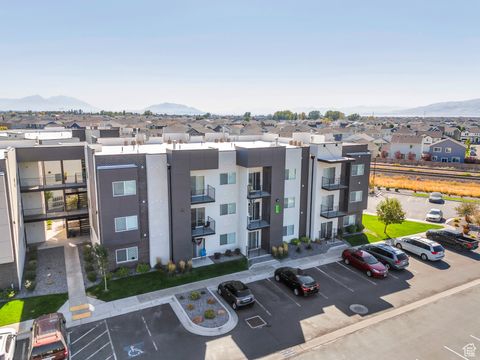
Active
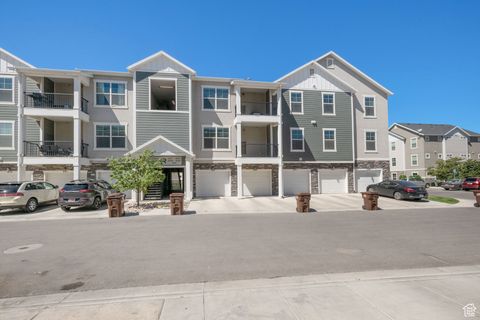
$365,000
3
bds
|
2
ba
|
1,272
sqft
|
built
2017
633 N Sun Peak Dr, Vineyard, UT 84059
$-890
Cash flow
-12.7%
Cash-on-Cash Return
2.8%
Cap rate
0.5%
Rent to Value Ratio
Active
$594,000
3
bds
|
2
ba
|
2,980
sqft
|
built
2016
63 N Canyon Maple Rd, Vineyard, UT 84059
$-1,267
Cash flow
-11.1%
Cash-on-Cash Return
3.1%
Cap rate
0.4%
Rent to Value Ratio
Active
$359,900
3
bds
|
3
ba
|
1,655
sqft
|
built
2014
206 N 750 E, Vineyard, UT 84059
$-909
Cash flow
-13.2%
Cash-on-Cash Return
2.6%
Cap rate
0.5%
Rent to Value Ratio
Active
$645,000
5
bds
|
4
ba
|
2,737
sqft
|
built
2017
64 W 470 N, Vineyard, UT 84059
$-1,742
Cash flow
-14.1%
Cash-on-Cash Return
2.4%
Cap rate
0.4%
Rent to Value Ratio
Active
$395,000
3
bds
|
3
ba
|
1,747
sqft
|
built
2017
43 E 670 N, Vineyard, UT 84059
$-1,043
Cash flow
-13.8%
Cash-on-Cash Return
2.5%
Cap rate
0.5%
Rent to Value Ratio
Active
$409,900
3
bds
|
3
ba
|
1,768
sqft
|
built
2017
671 E 330 N, Vineyard, UT 84059
$-1,175
Cash flow
-15.0%
Cash-on-Cash Return
2.2%
Cap rate
0.4%
Rent to Value Ratio
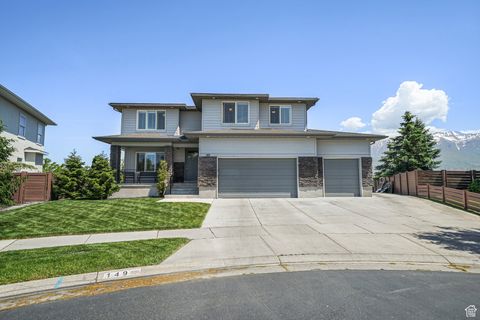
Active
$1,150,000
7
bds
|
4
ba
|
4,628
sqft
|
built
2016
149 E 230 N, Vineyard, UT 84059
$-3,738
Cash flow
-17.0%
Cash-on-Cash Return
1.8%
Cap rate
0.3%
Rent to Value Ratio
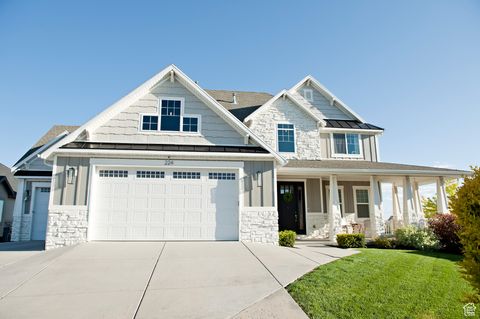
Active
$469,999
4
bds
|
3
ba
|
2,265
sqft
|
built
2018
353 N 750 E, Vineyard, UT 84059
$-997
Cash flow
-11.1%
Cash-on-Cash Return
3.1%
Cap rate
0.5%
Rent to Value Ratio
Active
$1,125,000
6
bds
|
4
ba
|
5,427
sqft
|
built
2015
224 S Dry Creek Ln, Vineyard, UT 84059
$-3,566
Cash flow
-16.5%
Cash-on-Cash Return
1.9%
Cap rate
0.3%
Rent to Value Ratio
Active
$1,175,000
4
bds
|
3
ba
|
5,196
sqft
|
built
2014
777 S Lake View Dr, Vineyard, UT 84059
$-3,936
Cash flow
-17.5%
Cash-on-Cash Return
1.7%
Cap rate
0.2%
Rent to Value Ratio
Active
$1,250,000
12
bds
|
10
ba
|
5,896
sqft
|
built
2014
198 N 725 E, Vineyard, UT 84059
$-5,066
Cash flow
-21.1%
Cash-on-Cash Return
0.8%
Cap rate
0.2%
Rent to Value Ratio
Active
$1,289,000
7
bds
|
5
ba
|
6,041
sqft
|
built
2016
583 E Parker Pl, Vineyard, UT 84059
$-3,148
Cash flow
-12.7%
Cash-on-Cash Return
2.7%
Cap rate
0.4%
Rent to Value Ratio

Active
$5,250,000
33
bds
|
30
ba
|
17,967
sqft
|
built
2017
265 N 670 E, Vineyard, UT 84059
$-28,386
Cash flow
-28.2%
Cash-on-Cash Return
-0.8%
Cap rate
0.0%
Rent to Value Ratio
Active
$5,250,000
33
bds
|
30
ba
|
17,967
sqft
|
built
2017
548 E 300 N, Vineyard, UT 84059
$-27,213
Cash flow
-27.0%
Cash-on-Cash Return
-0.5%
Cap rate
0.1%
Rent to Value Ratio