Waukegan, IL Investment Properties for Sale
Browse homes for sale and investment properties in Waukegan, IL. Refine your search by price, property type, or more.
Best cash flowing properties in Waukegan, IL
Active
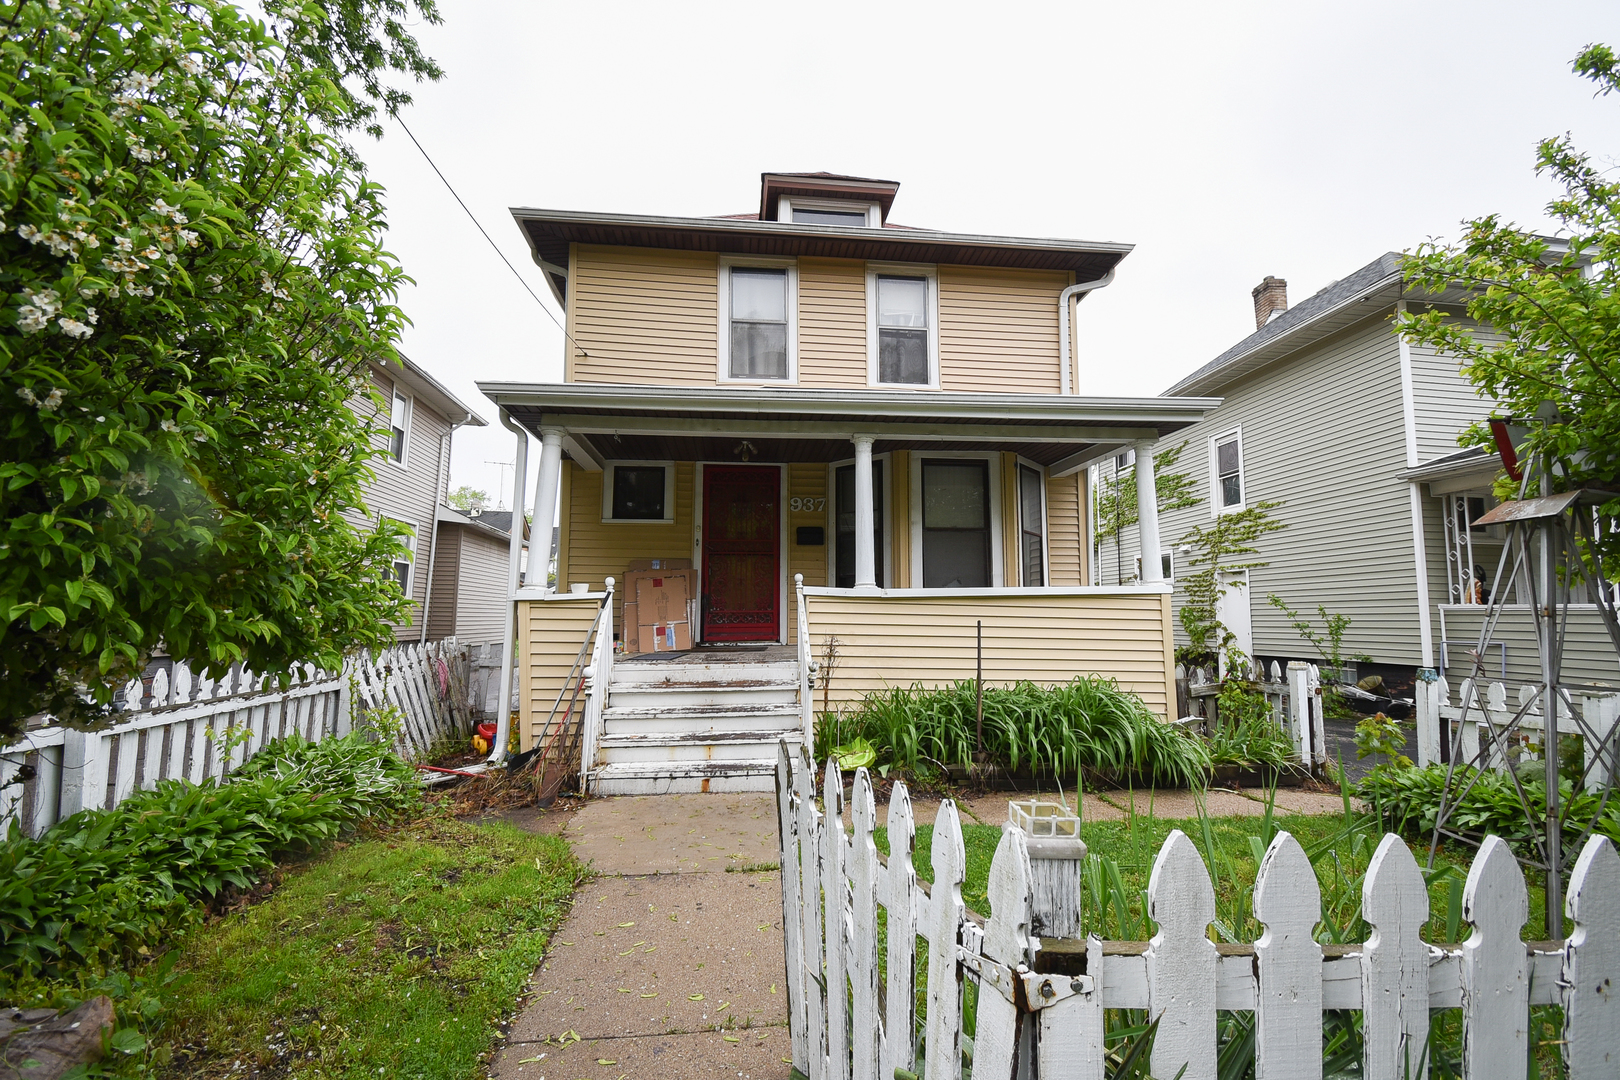
$148,000
4
bds
|
2
ba
|
1,624
sqft
|
built
1910
937 N County St, Waukegan, IL 60085
$361
Cash flow
12.7%
Cash-on-Cash Return
9.2%
Cap rate
1.6%
Rent to Value Ratio
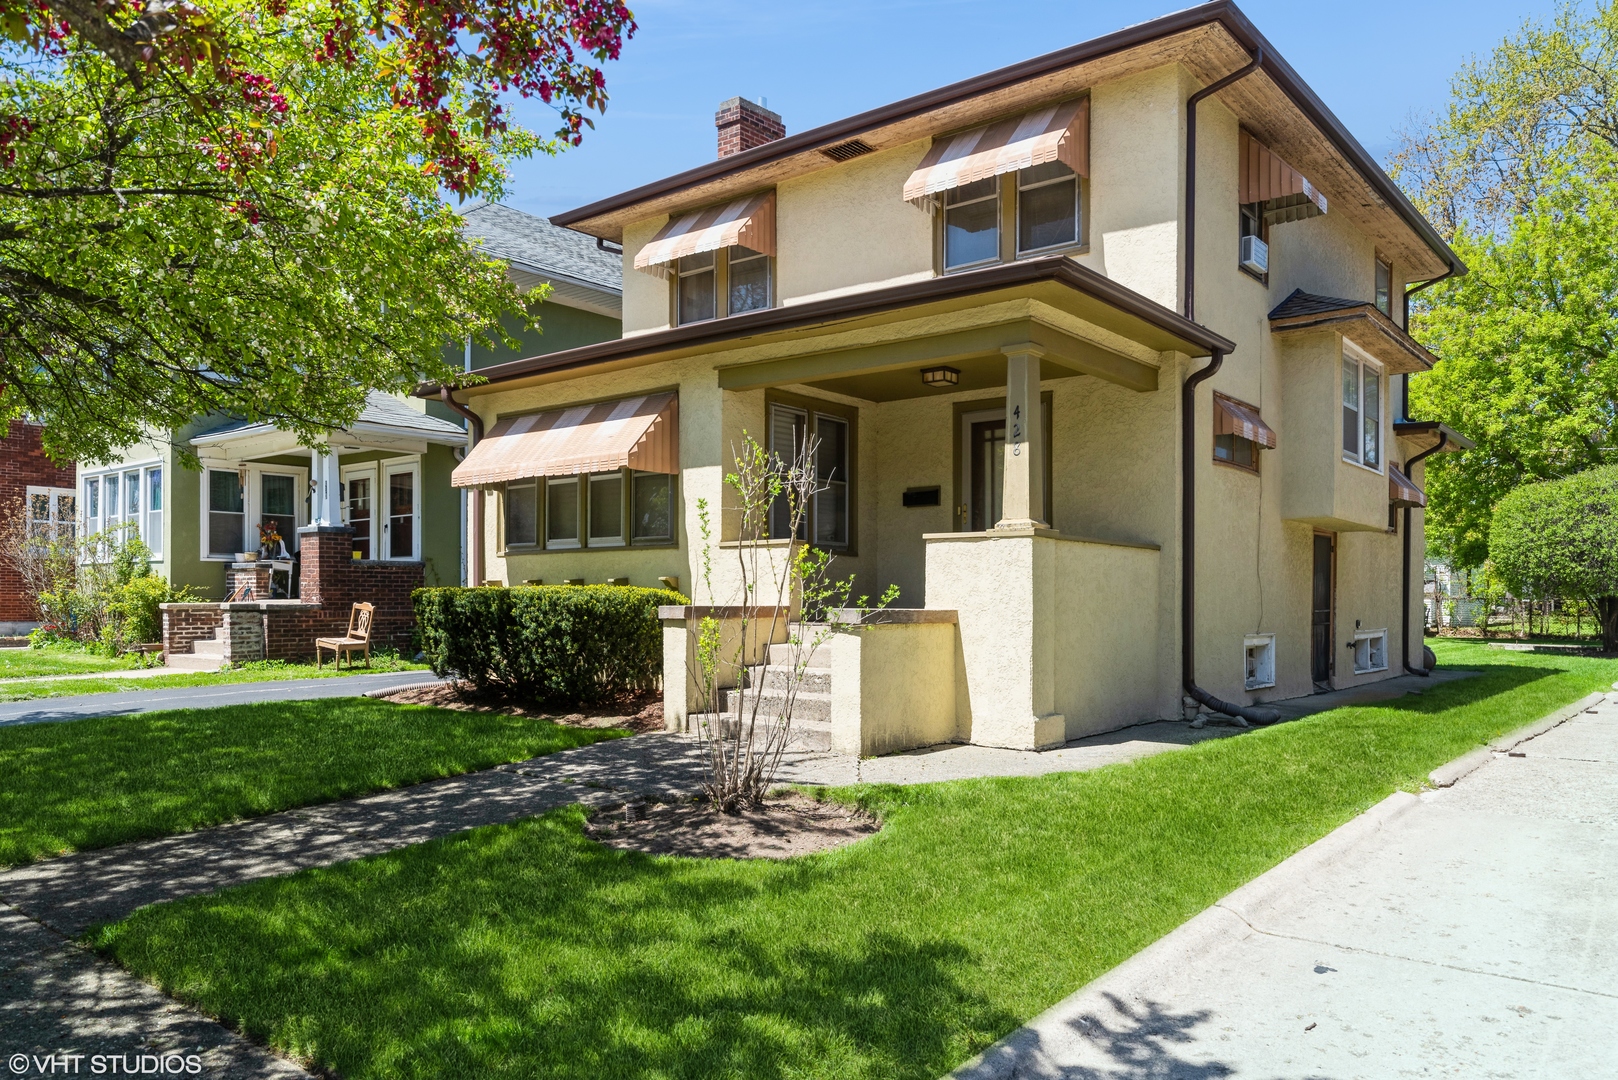
Active
$185,000
3
bds
|
1
ba
|
0
sqft
|
built
1925
428 Hull Ct, Waukegan, IL 60085
$332
Cash flow
9.4%
Cash-on-Cash Return
8.5%
Cap rate
1.4%
Rent to Value Ratio
26 out of 28 properties for sale in Waukegan, IL
Limited Results Shown
Create a free account, or log in to reveal all property listings and enjoy the complete experience.
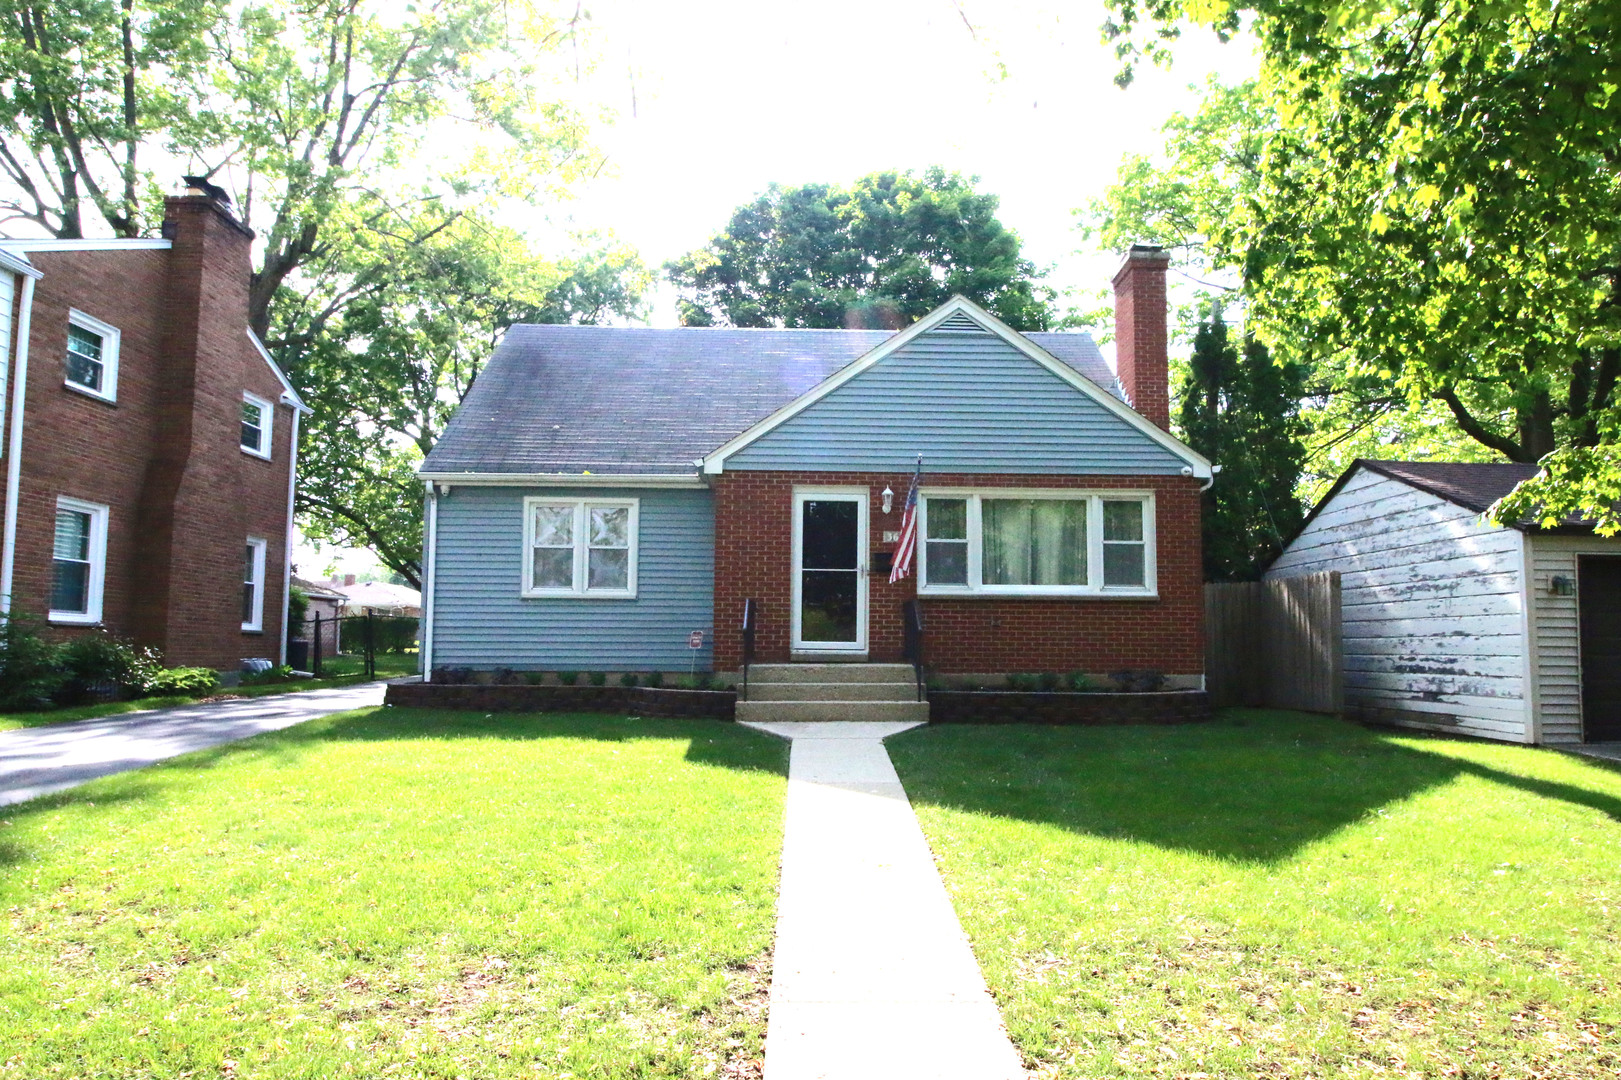
Active
$269,900
3
bds
|
2
ba
|
2,438
sqft
|
built
1963
36 N Martin Ave, Waukegan, IL 60085
$-315
Cash flow
-6.1%
Cash-on-Cash Return
4.9%
Cap rate
0.9%
Rent to Value Ratio
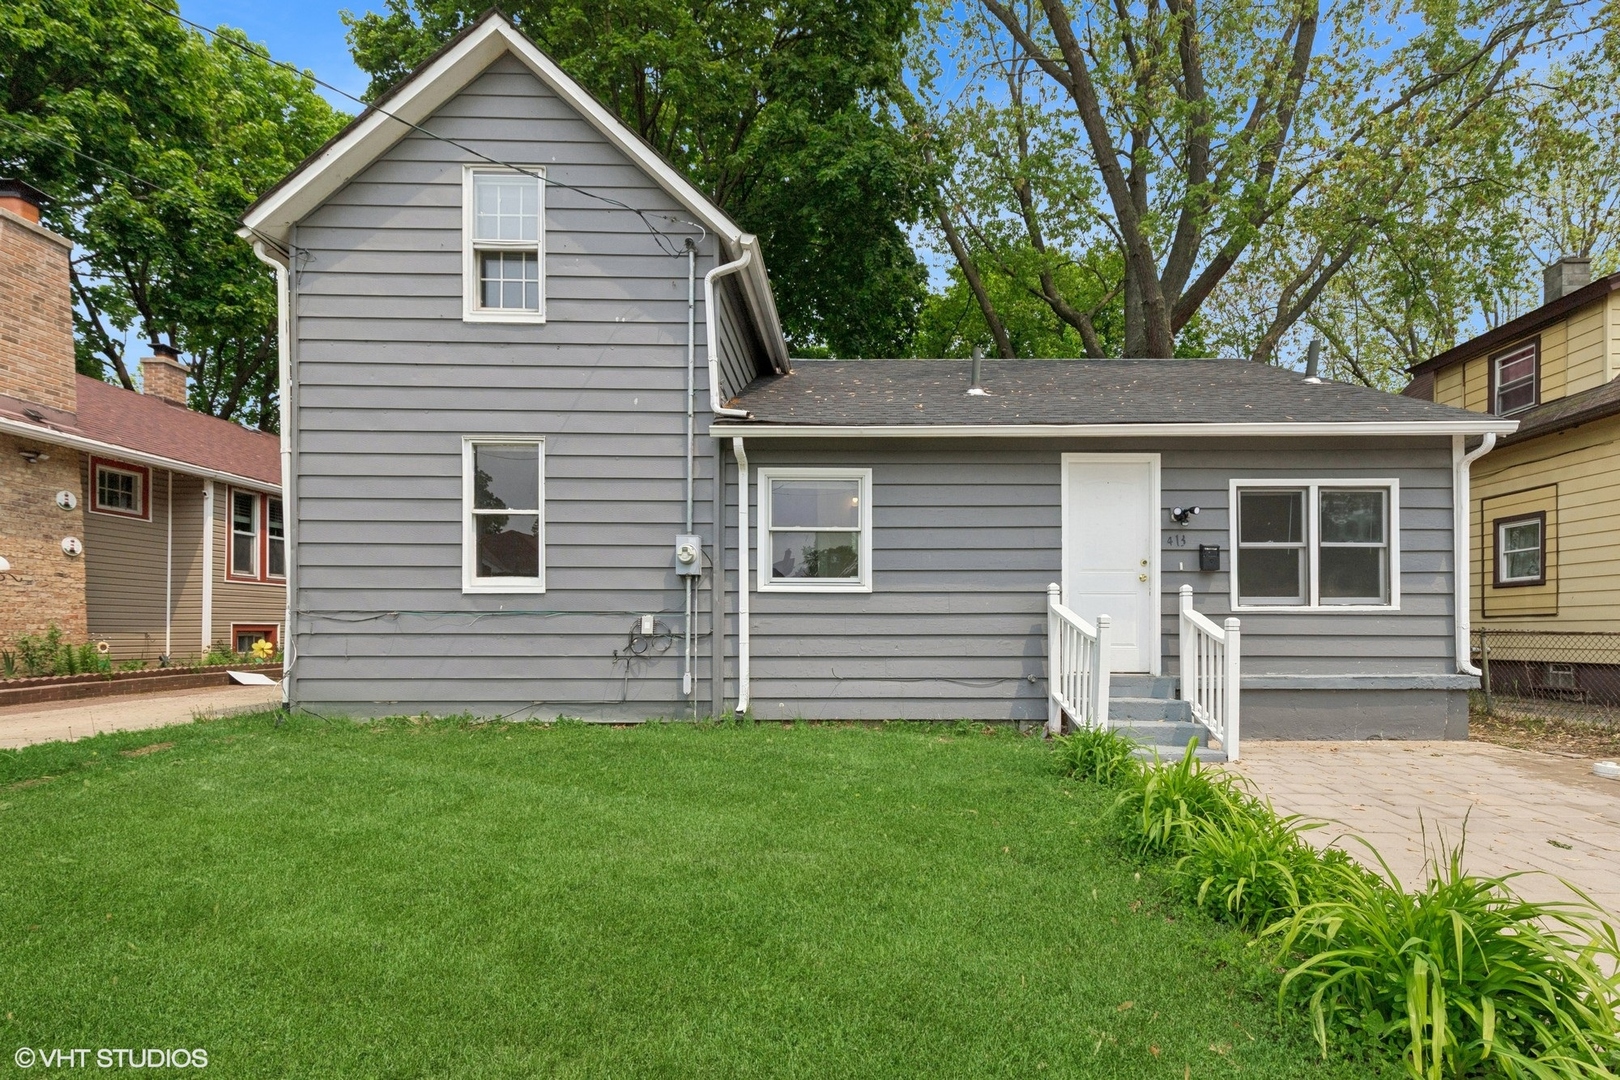
Active
$219,900
3
bds
|
2
ba
|
0
sqft
|
built
1905
413 N Poplar St, Waukegan, IL 60085
$-163
Cash flow
-3.9%
Cash-on-Cash Return
5.4%
Cap rate
0.8%
Rent to Value Ratio
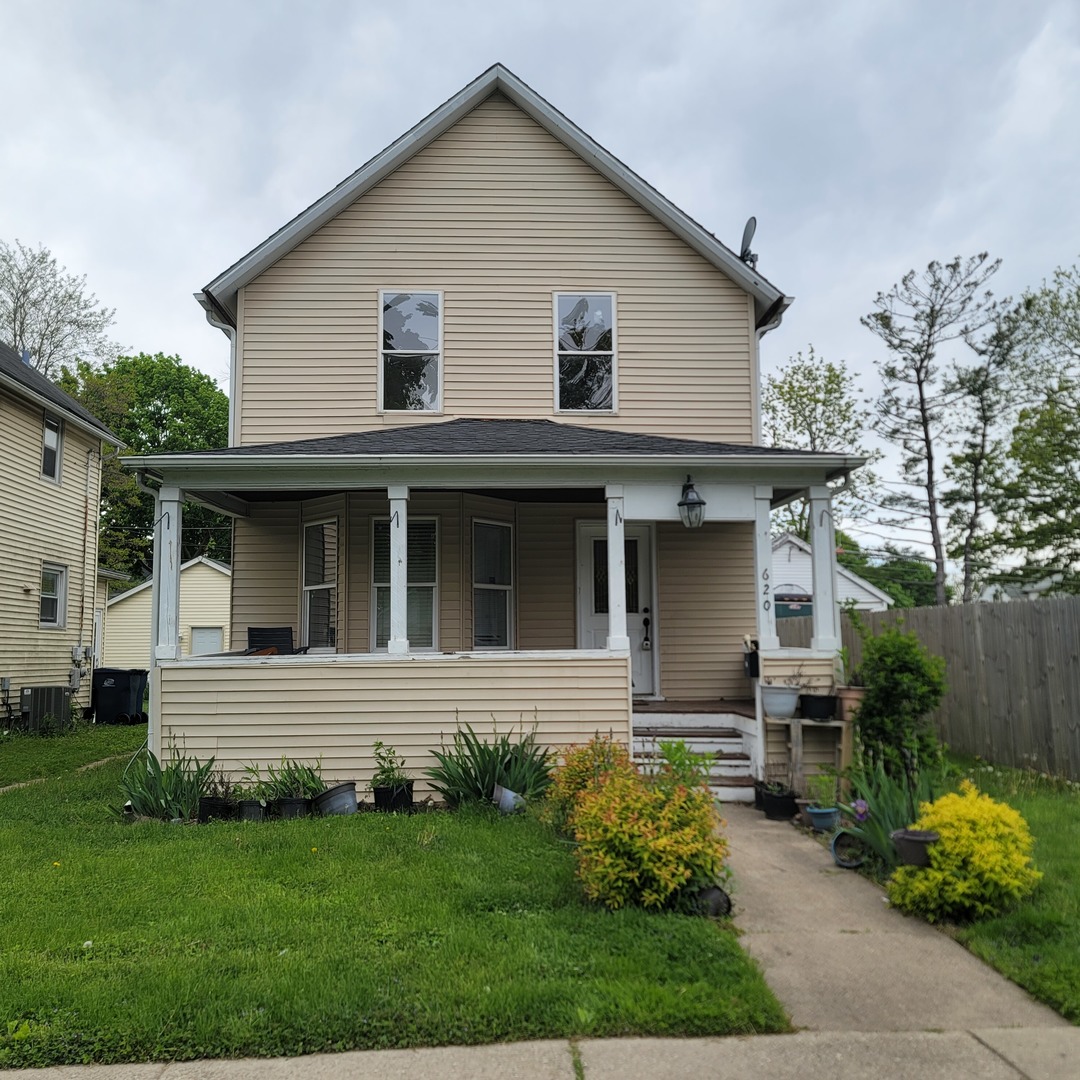
Active
$175,000
3
bds
|
2
ba
|
1,110
sqft
|
built
1901
620 N Poplar St, Waukegan, IL 60085
$-273
Cash flow
-8.1%
Cash-on-Cash Return
4.4%
Cap rate
0.8%
Rent to Value Ratio
Active
$185,000
3
bds
|
1
ba
|
0
sqft
|
built
1925
428 Hull Ct, Waukegan, IL 60085
$332
Cash flow
9.4%
Cash-on-Cash Return
8.5%
Cap rate
1.4%
Rent to Value Ratio
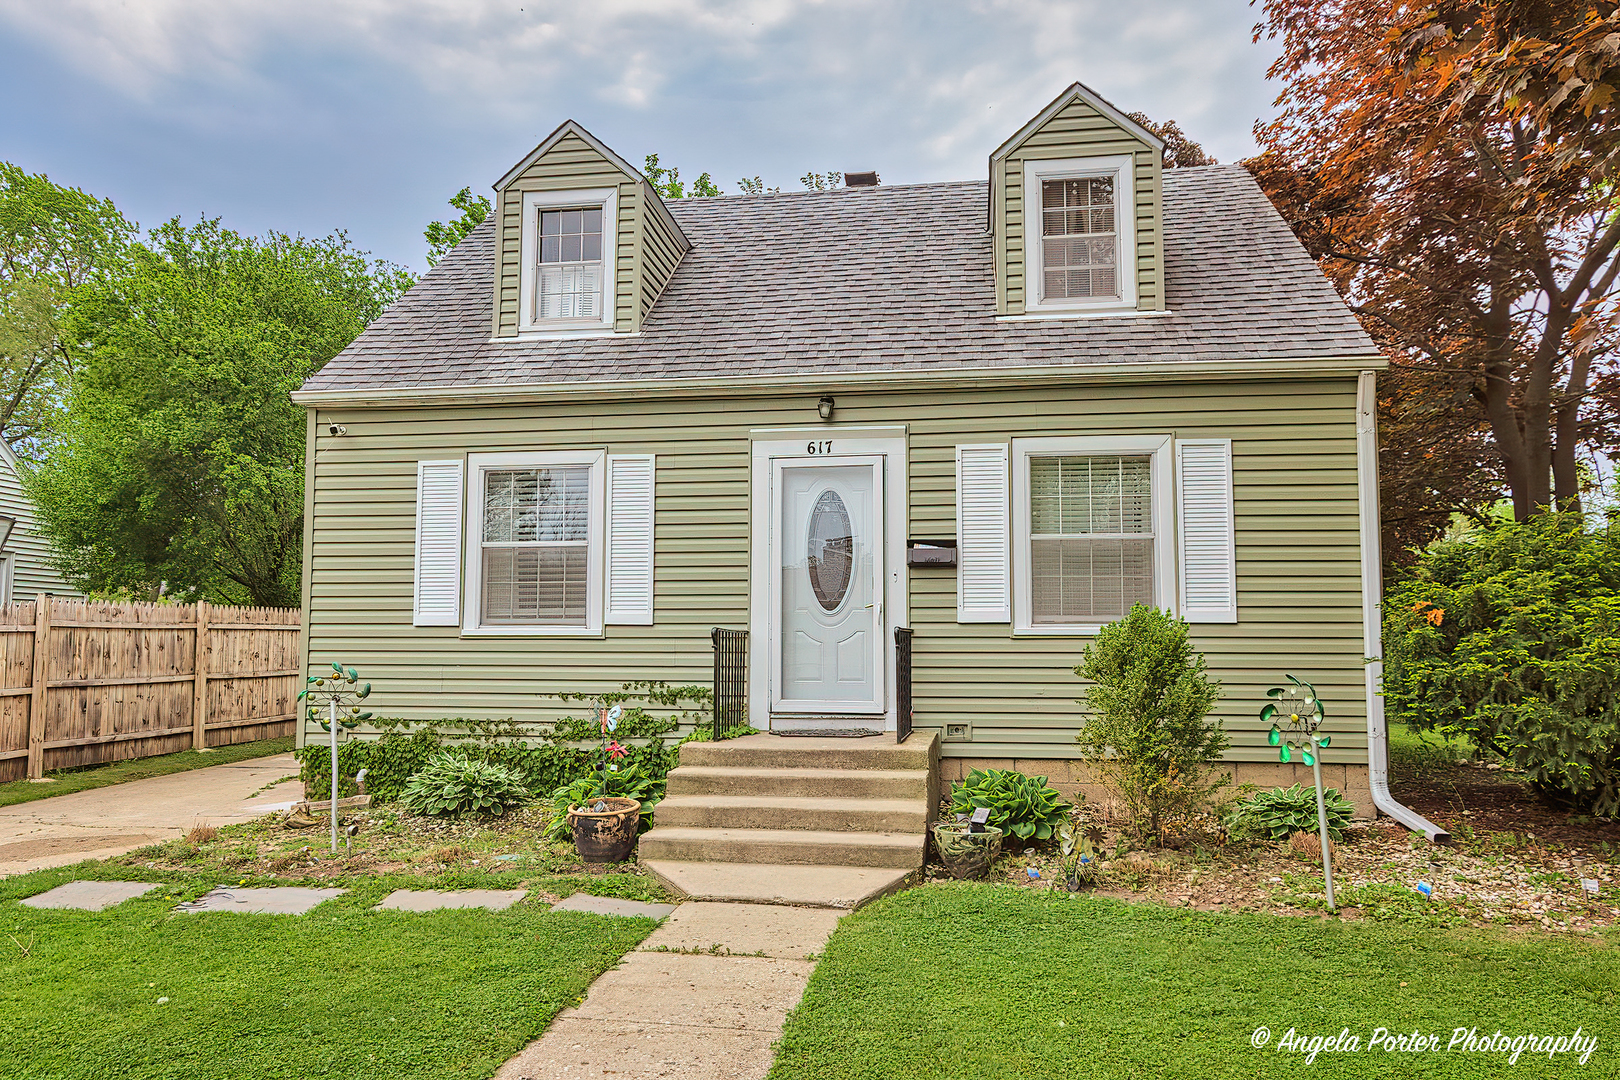
Active
$295,000
3
bds
|
3
ba
|
1,680
sqft
|
built
1940
617 Colville Pl, Waukegan, IL 60087
$-396
Cash flow
-7.0%
Cash-on-Cash Return
4.7%
Cap rate
0.7%
Rent to Value Ratio
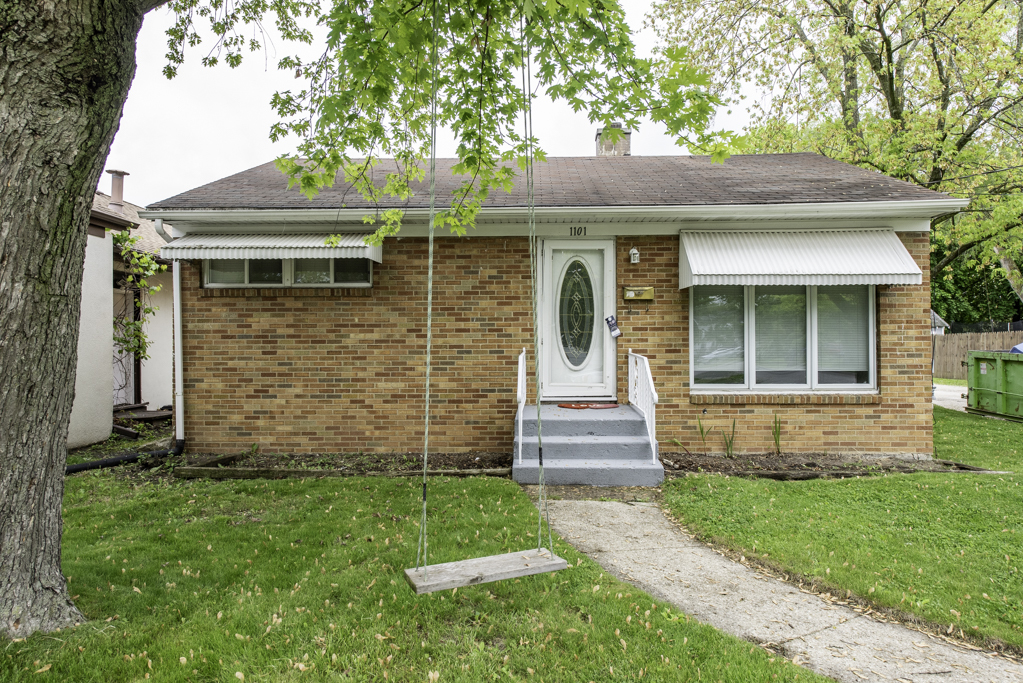
Active
$290,000
2
bds
|
2
ba
|
800
sqft
|
built
1953
1101 Pine St, Waukegan, IL 60085
$-522
Cash flow
-9.4%
Cash-on-Cash Return
4.2%
Cap rate
0.7%
Rent to Value Ratio
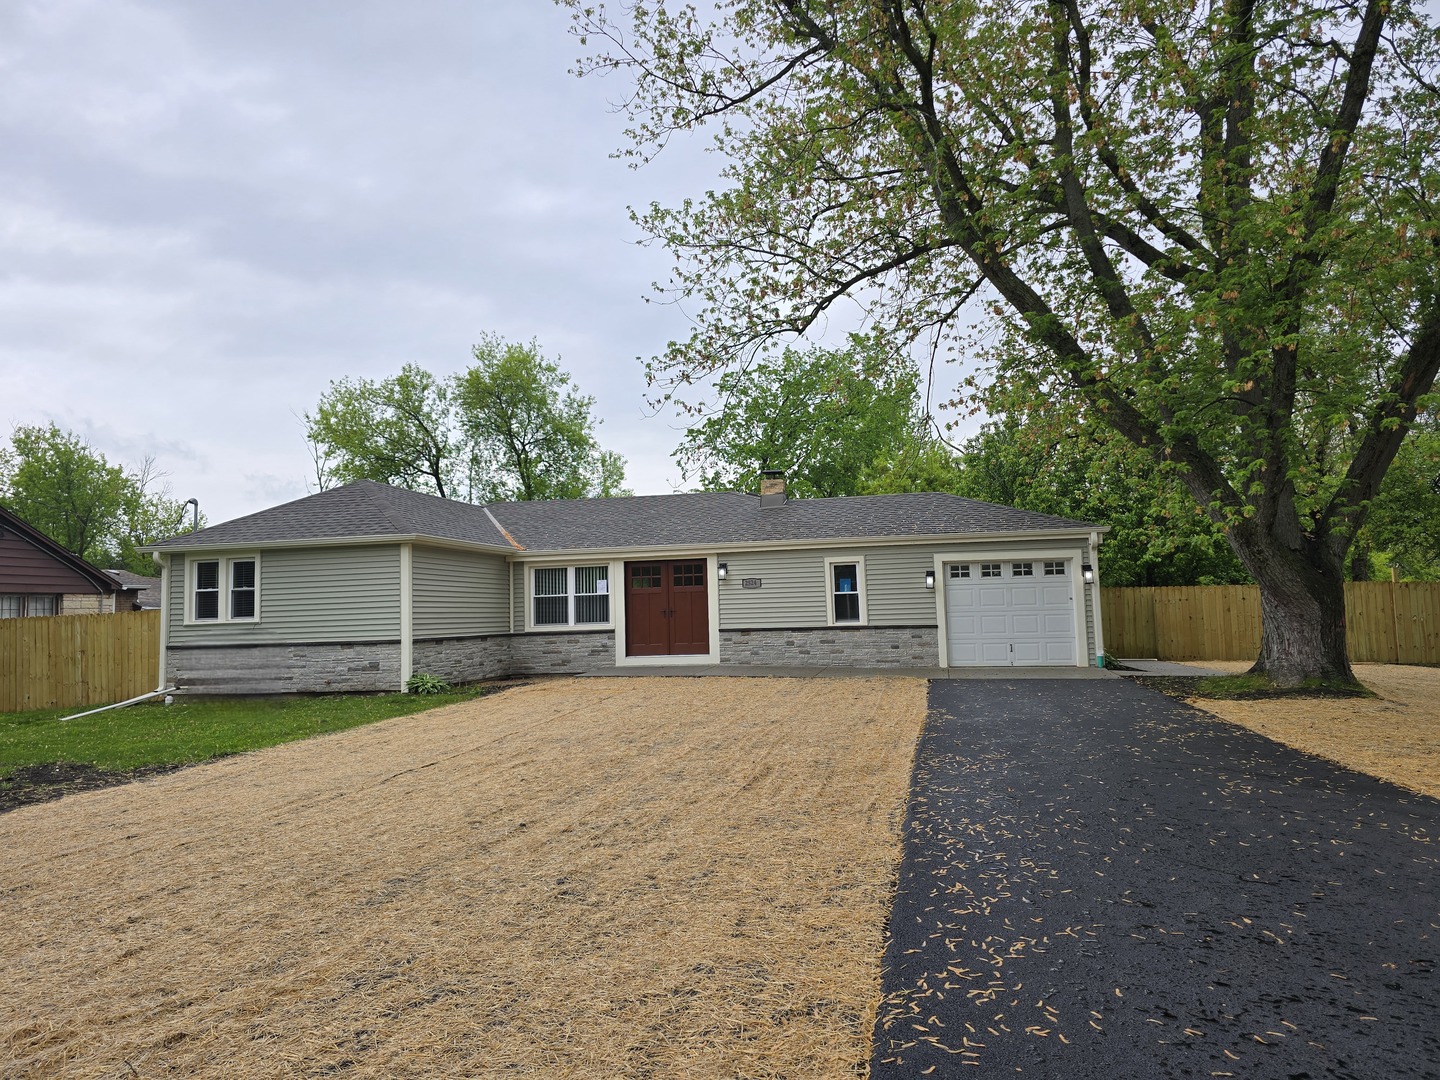
Active
$355,000
4
bds
|
2
ba
|
1,394
sqft
|
built
1954
2524 Gray Ct, Waukegan, IL 60085
$-824
Cash flow
-12.1%
Cash-on-Cash Return
3.5%
Cap rate
0.6%
Rent to Value Ratio
Active
$375,000
3
bds
|
2
ba
|
1,800
sqft
|
built
1982
4832 Crest Ct, Waukegan, IL 60087
$-1,234
Cash flow
-17.2%
Cash-on-Cash Return
2.4%
Cap rate
0.5%
Rent to Value Ratio
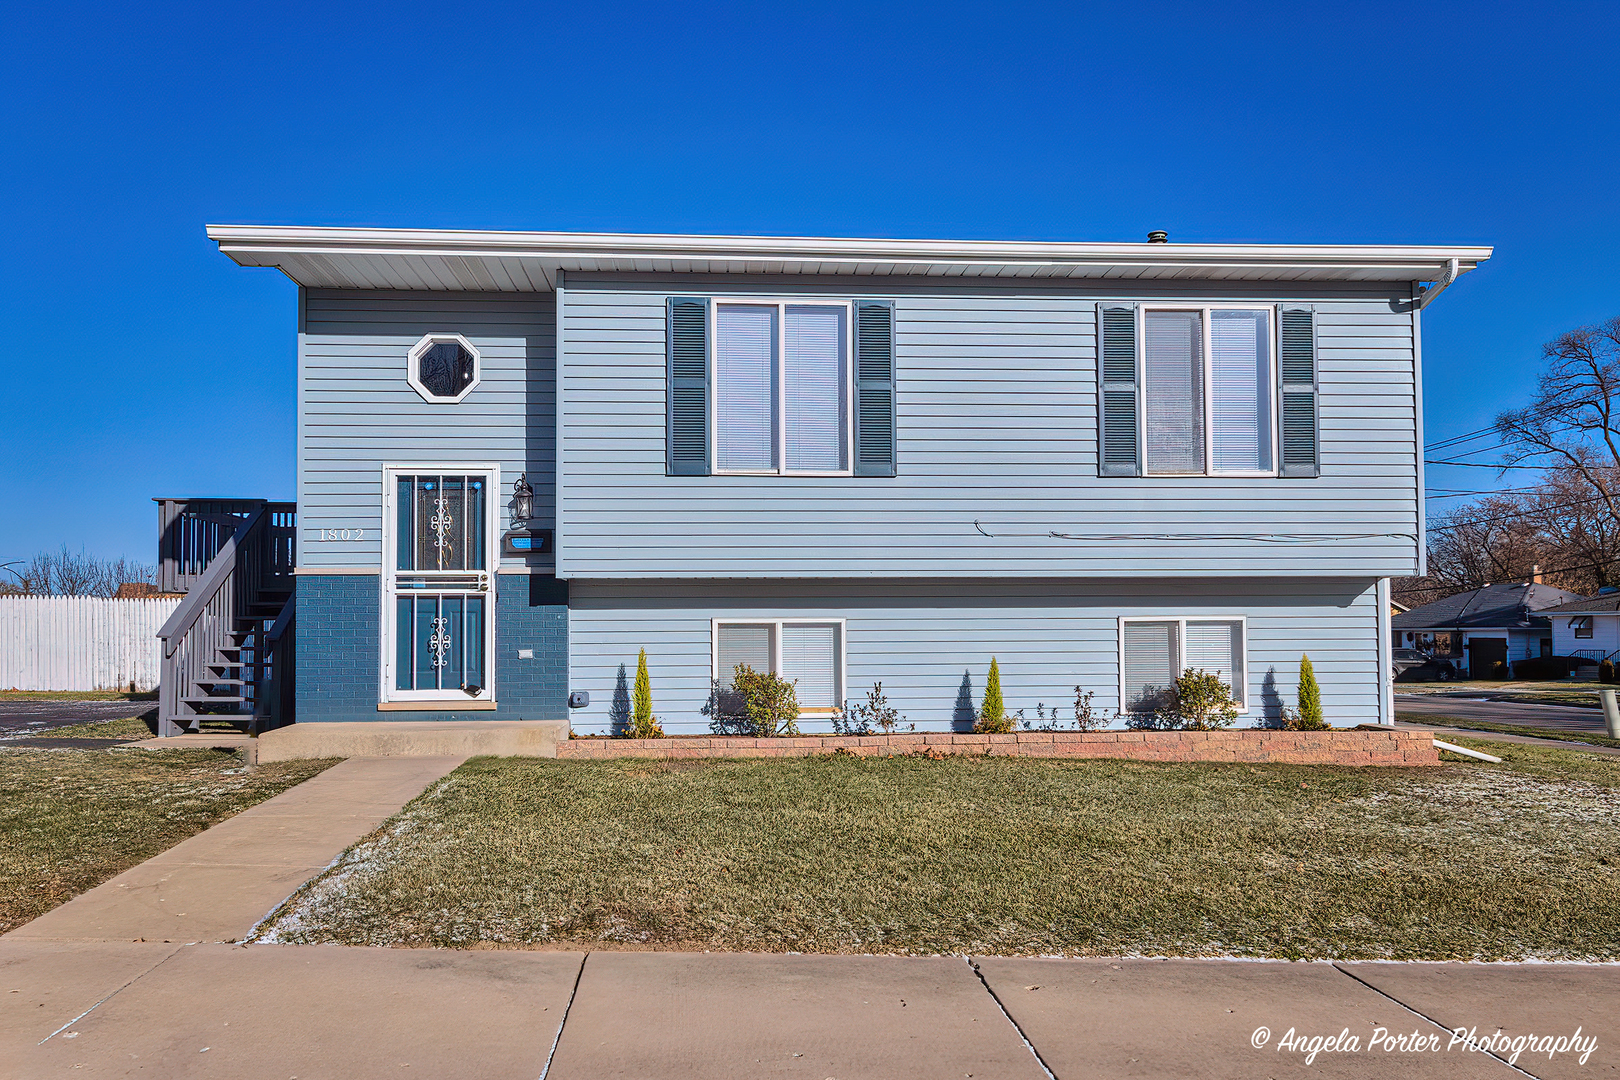
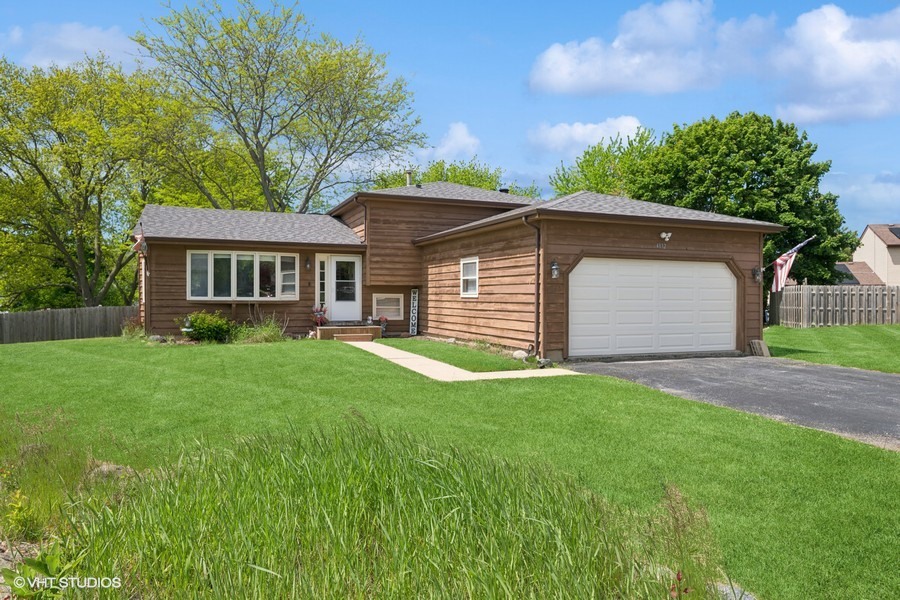
Active
$335,000
4
bds
|
2
ba
|
1,840
sqft
|
built
2002
1802 11th St, Waukegan, IL 60085
$-228
Cash flow
-3.6%
Cash-on-Cash Return
5.5%
Cap rate
0.8%
Rent to Value Ratio
Active
$239,900
4
bds
|
2
ba
|
1,725
sqft
|
built
1927
304 W Keith Ave, Waukegan, IL 60085
$255
Cash flow
5.5%
Cash-on-Cash Return
7.6%
Cap rate
0.9%
Rent to Value Ratio
Active
$148,000
4
bds
|
2
ba
|
1,624
sqft
|
built
1910
937 N County St, Waukegan, IL 60085
$361
Cash flow
12.7%
Cash-on-Cash Return
9.2%
Cap rate
1.6%
Rent to Value Ratio
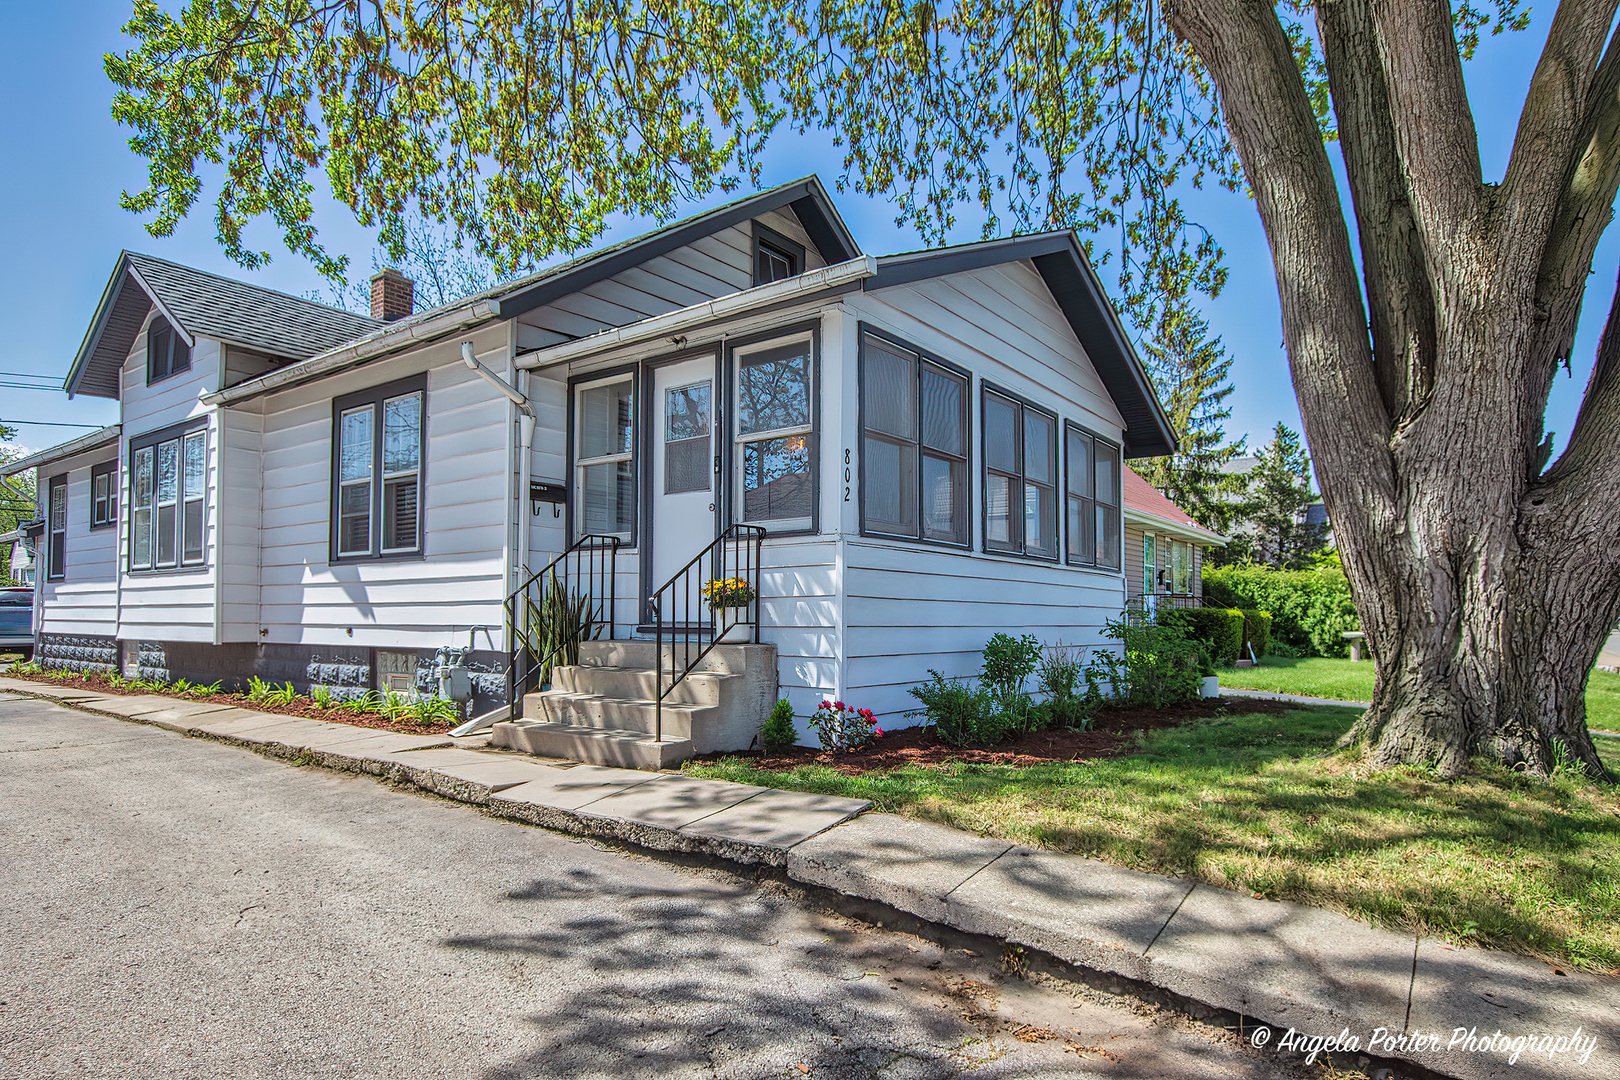
Active
$214,700
2
bds
|
1
ba
|
1,002
sqft
|
built
1935
802 N Lewis Ave, Waukegan, IL 60085
$-53
Cash flow
-1.3%
Cash-on-Cash Return
6.0%
Cap rate
1.0%
Rent to Value Ratio
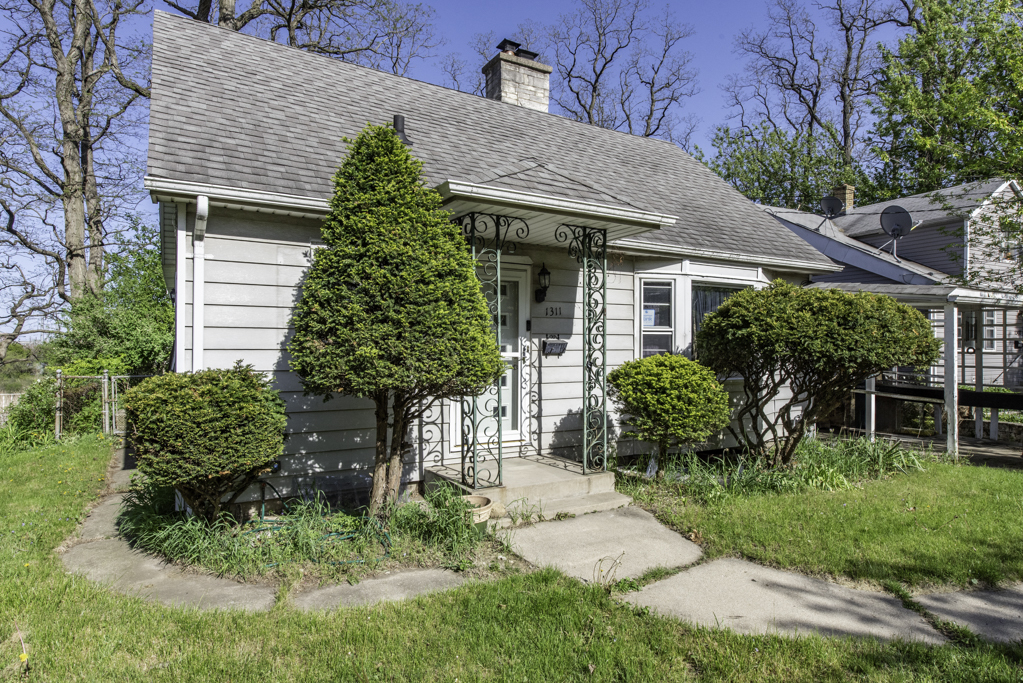
Active
$239,900
3
bds
|
1
ba
|
1,410
sqft
|
built
1954
1311 Eastview Dr, Waukegan, IL 60085
$-193
Cash flow
-4.2%
Cash-on-Cash Return
5.4%
Cap rate
0.9%
Rent to Value Ratio
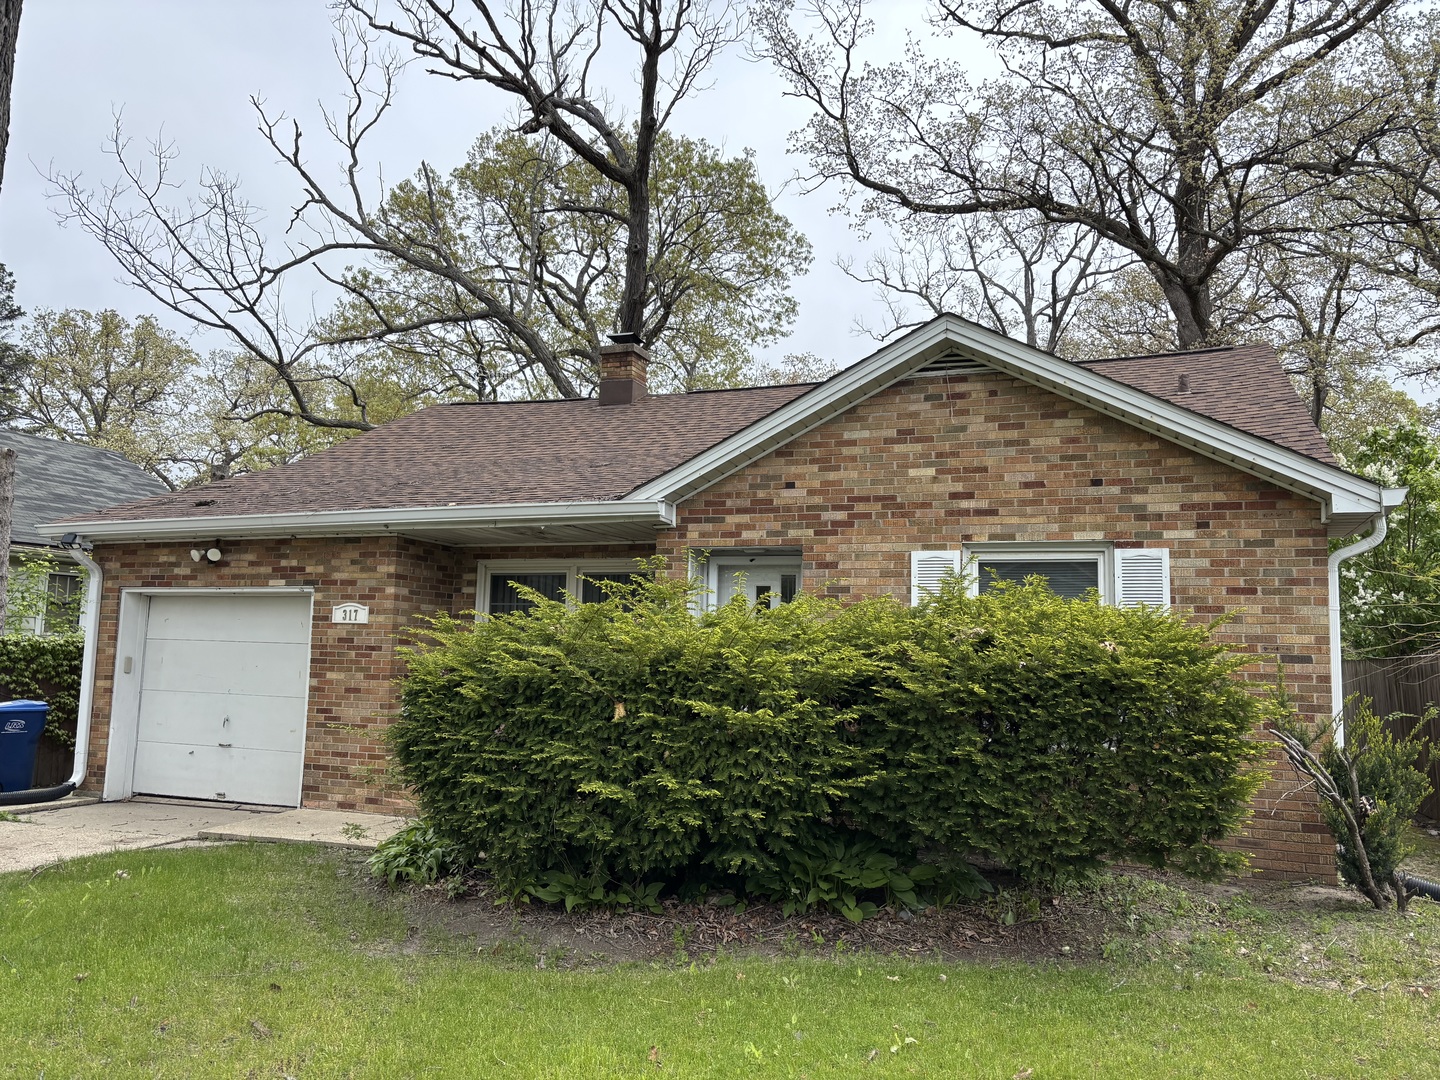
Active
$205,000
2
bds
|
1
ba
|
1,152
sqft
|
built
1951
317 N Jackson St, Waukegan, IL 60085
$-217
Cash flow
-5.5%
Cash-on-Cash Return
5.0%
Cap rate
0.8%
Rent to Value Ratio
Active
$315,000
4
bds
|
2
ba
|
2,063
sqft
|
built
1952
1600 N Ash St, Waukegan, IL 60085
$-567
Cash flow
-9.4%
Cash-on-Cash Return
4.2%
Cap rate
0.7%
Rent to Value Ratio
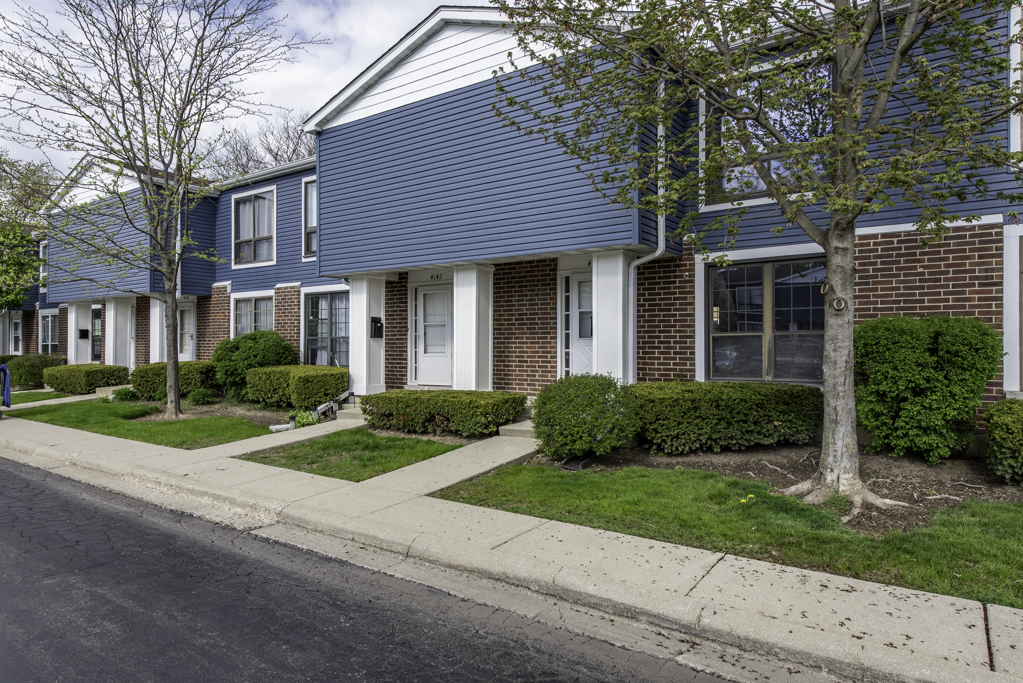
Active
$229,900
3
bds
|
2
ba
|
1,320
sqft
|
built
1976
4140 Brentwood Ln, Waukegan, IL 60087
$-567
Cash flow
-12.9%
Cash-on-Cash Return
3.4%
Cap rate
0.9%
Rent to Value Ratio
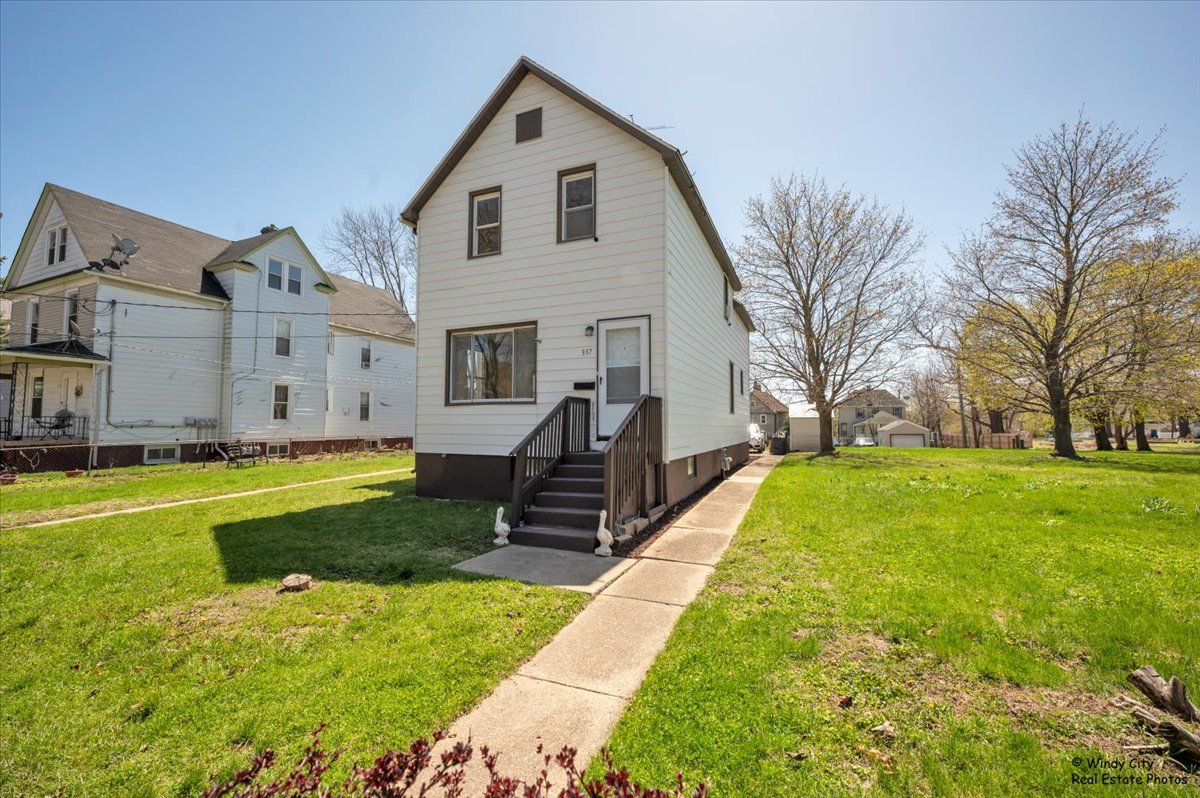
Active
$239,000
3
bds
|
2
ba
|
2,400
sqft
|
built
1901
337 George Ave, Waukegan, IL 60085
$10
Cash flow
0.2%
Cash-on-Cash Return
6.4%
Cap rate
0.9%
Rent to Value Ratio
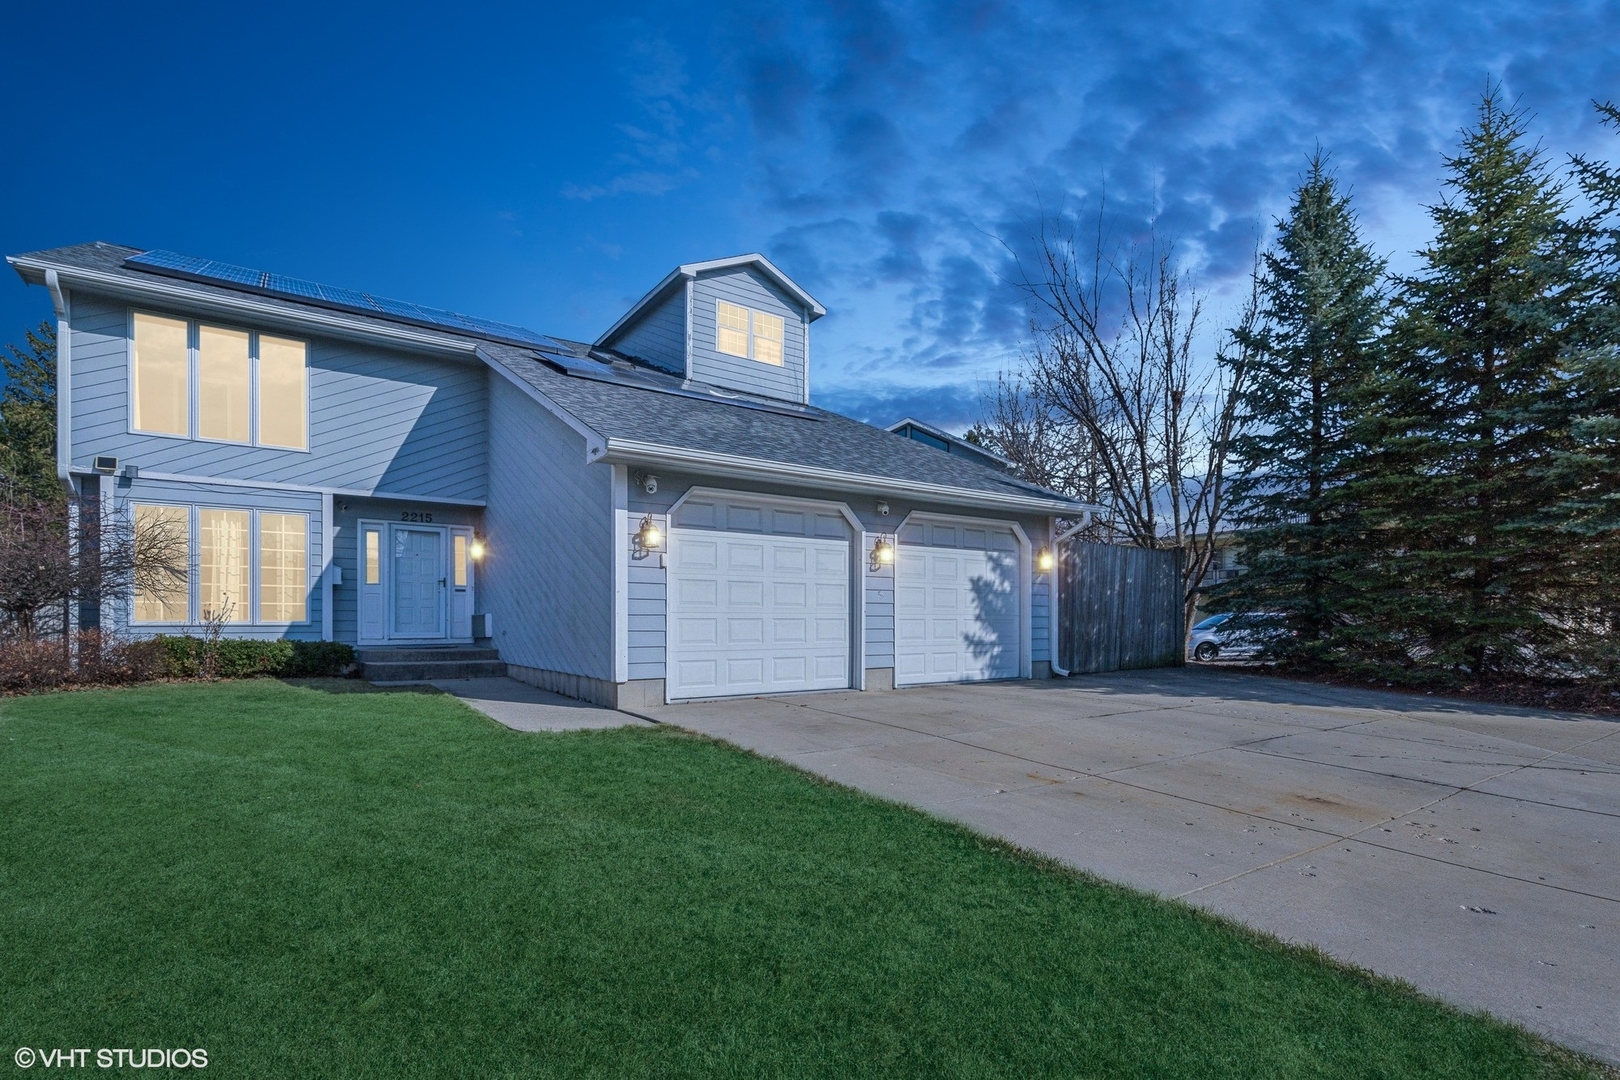
Active
$415,000
3
bds
|
4
ba
|
3,971
sqft
|
built
1991
2215 Yeoman St, Waukegan, IL 60087
$-917
Cash flow
-11.5%
Cash-on-Cash Return
3.7%
Cap rate
0.8%
Rent to Value Ratio
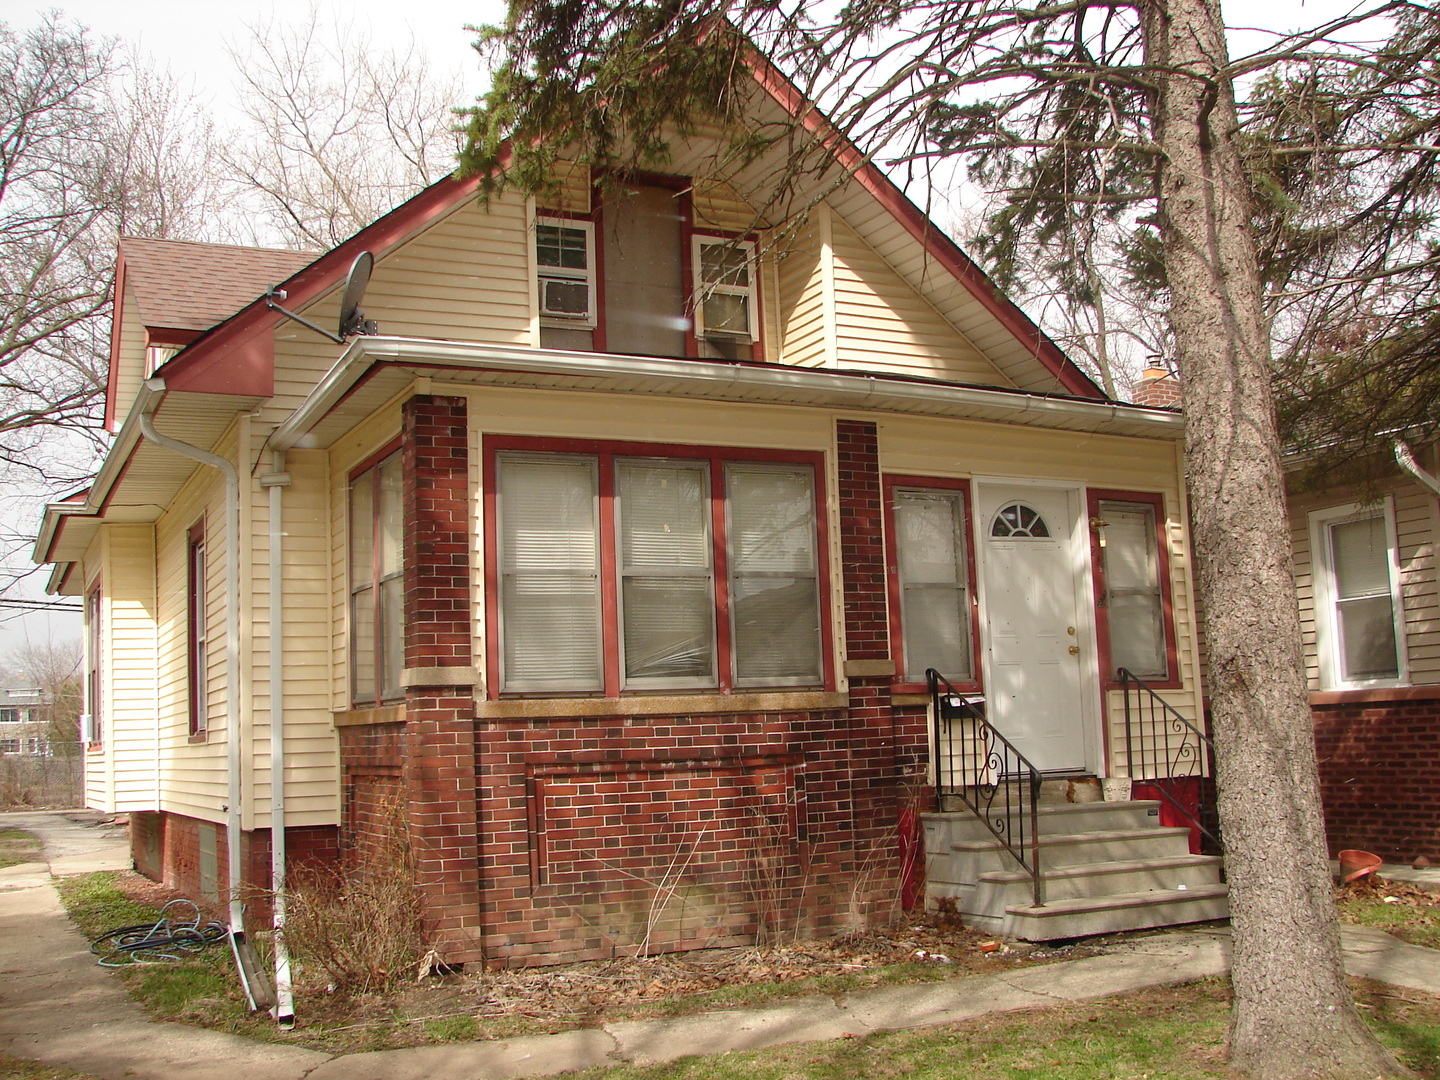
Active
$245,000
4
bds
|
2
ba
|
0
sqft
|
built
1920
28 S Fulton Ave, Waukegan, IL 60085
$-184
Cash flow
-3.9%
Cash-on-Cash Return
5.4%
Cap rate
0.9%
Rent to Value Ratio
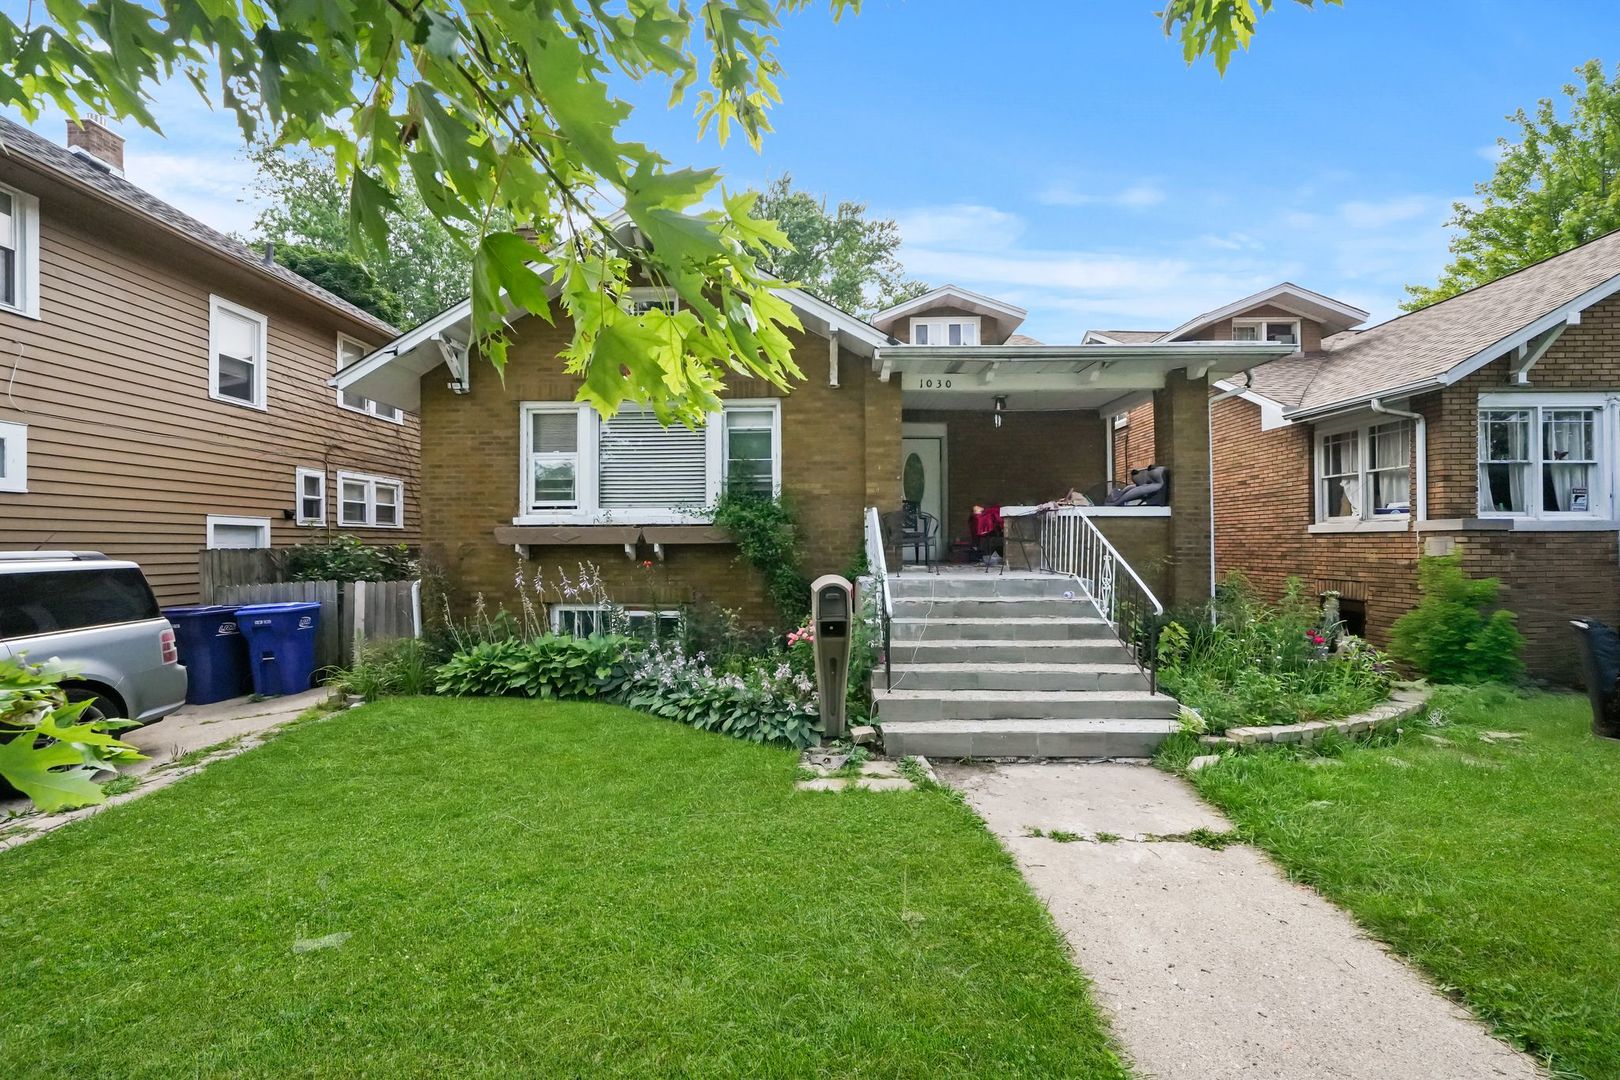
Active
$200,000
4
bds
|
3
ba
|
2,060
sqft
|
built
1920
1030 N Ash St, Waukegan, IL 60085
$169
Cash flow
4.4%
Cash-on-Cash Return
7.3%
Cap rate
1.3%
Rent to Value Ratio
Active
$230,000
3
bds
|
3
ba
|
2,029
sqft
|
built
1934
712 Pine St, Waukegan, IL 60085
$173
Cash flow
3.9%
Cash-on-Cash Return
7.2%
Cap rate
1.1%
Rent to Value Ratio
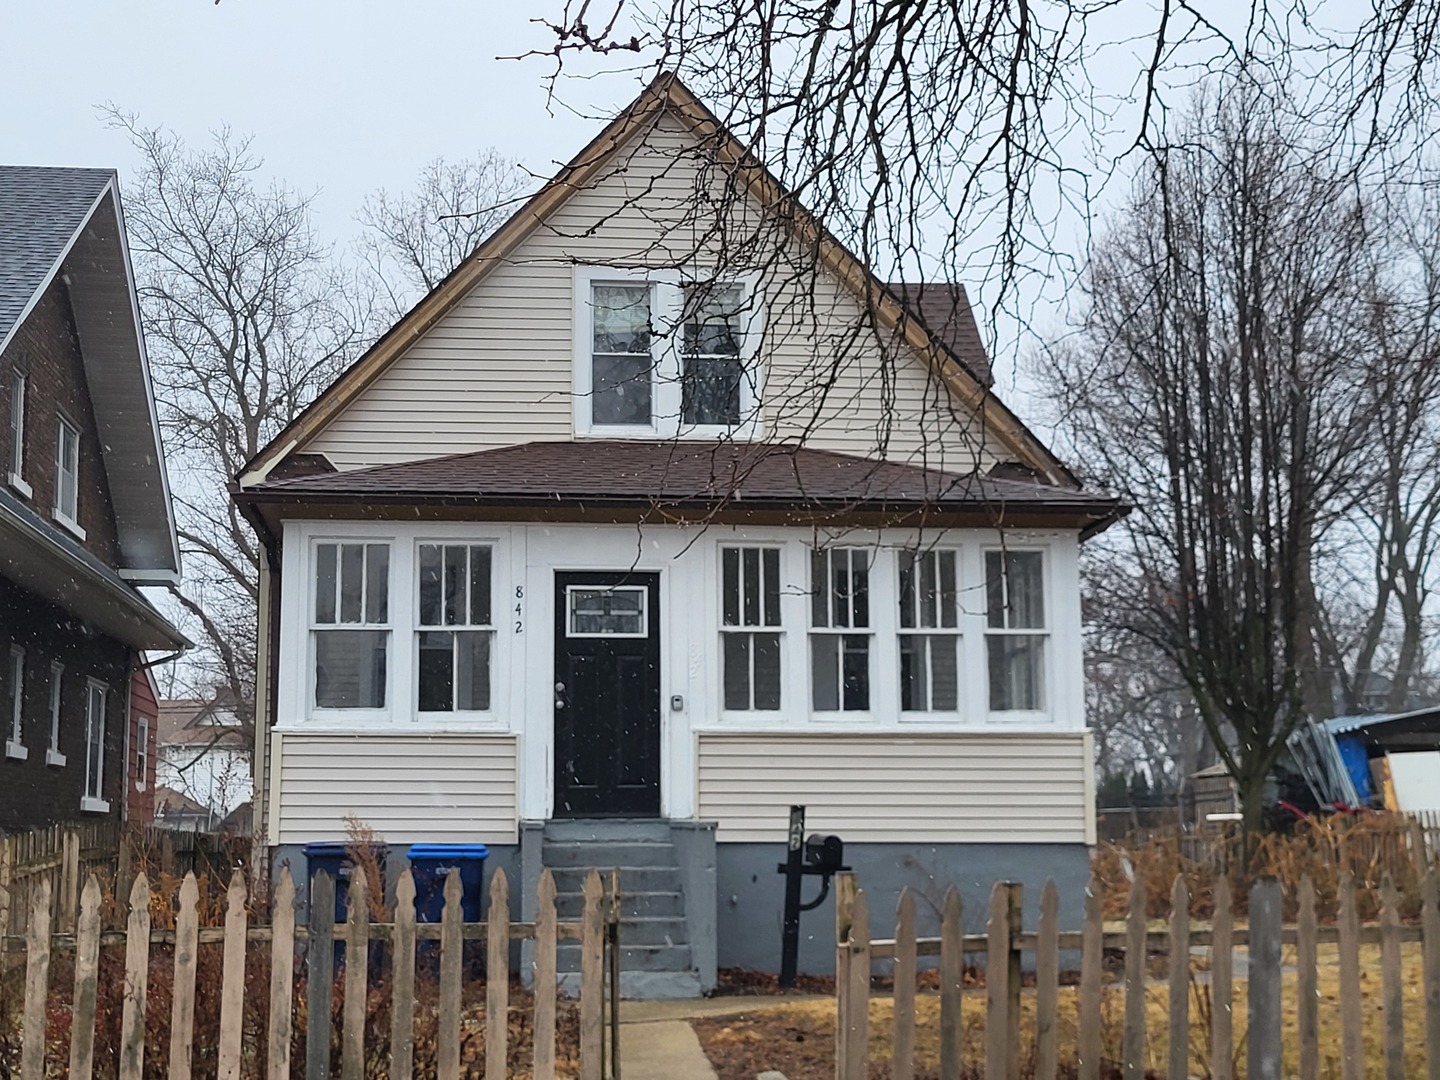
Active
$186,000
3
bds
|
1
ba
|
1,163
sqft
|
built
1920
842 Wadsworth Ave, Waukegan, IL 60085
$106
Cash flow
3.0%
Cash-on-Cash Return
7.0%
Cap rate
1.1%
Rent to Value Ratio
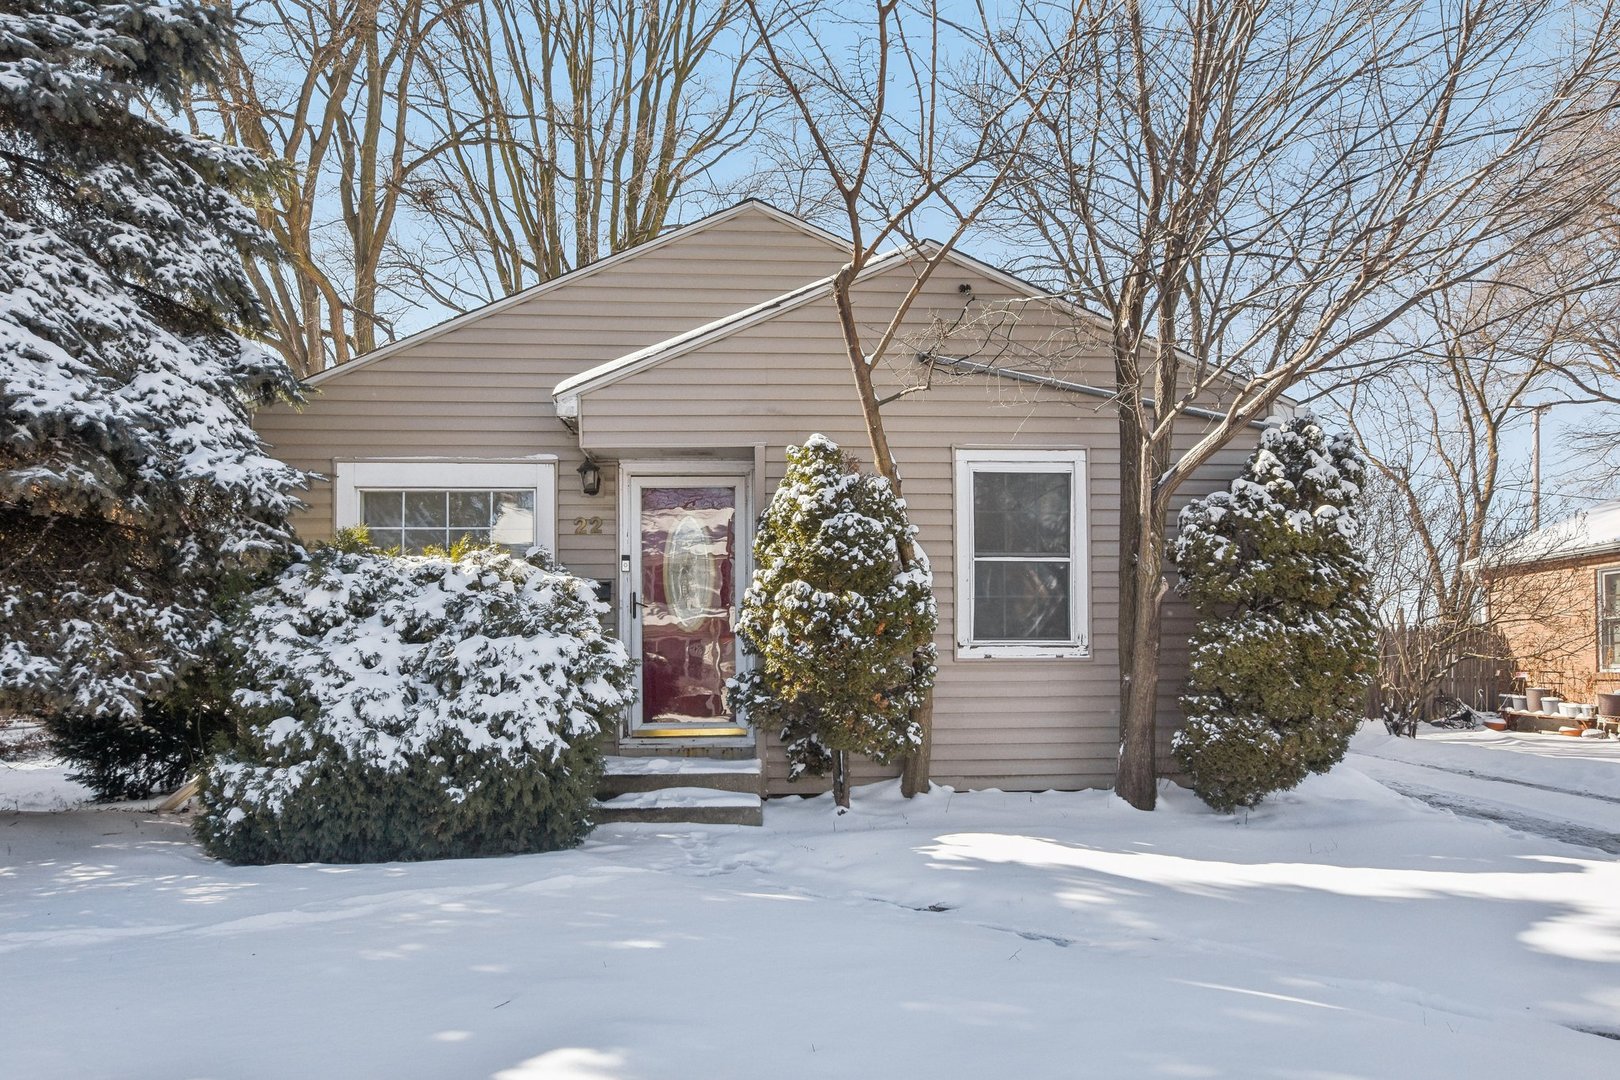
Active
$169,900
2
bds
|
1
ba
|
910
sqft
|
built
1953
22 N Lewis Ave, Waukegan, IL 60085
$51
Cash flow
1.6%
Cash-on-Cash Return
6.7%
Cap rate
1.1%
Rent to Value Ratio
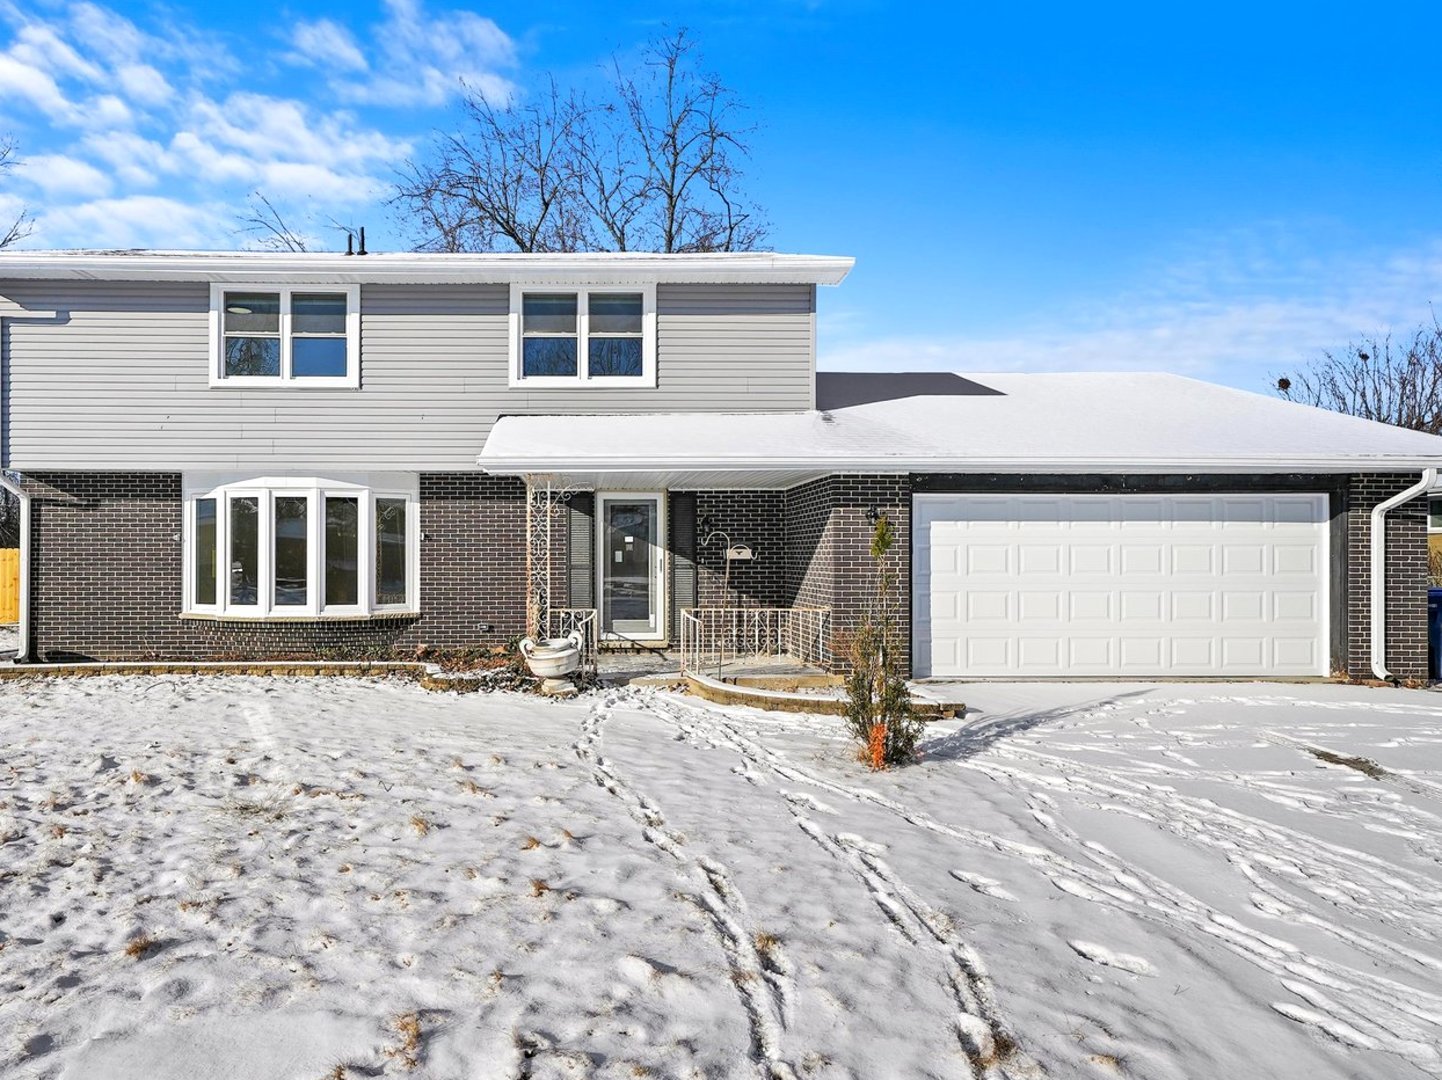
Active
$430,000
4
bds
|
2
ba
|
2,190
sqft
|
built
1969
730 S Mc Aree Rd, Waukegan, IL 60085
$-446
Cash flow
-5.4%
Cash-on-Cash Return
5.1%
Cap rate
0.8%
Rent to Value Ratio
Active
$239,000
2
bds
|
2
ba
|
0
sqft
|
built
1925
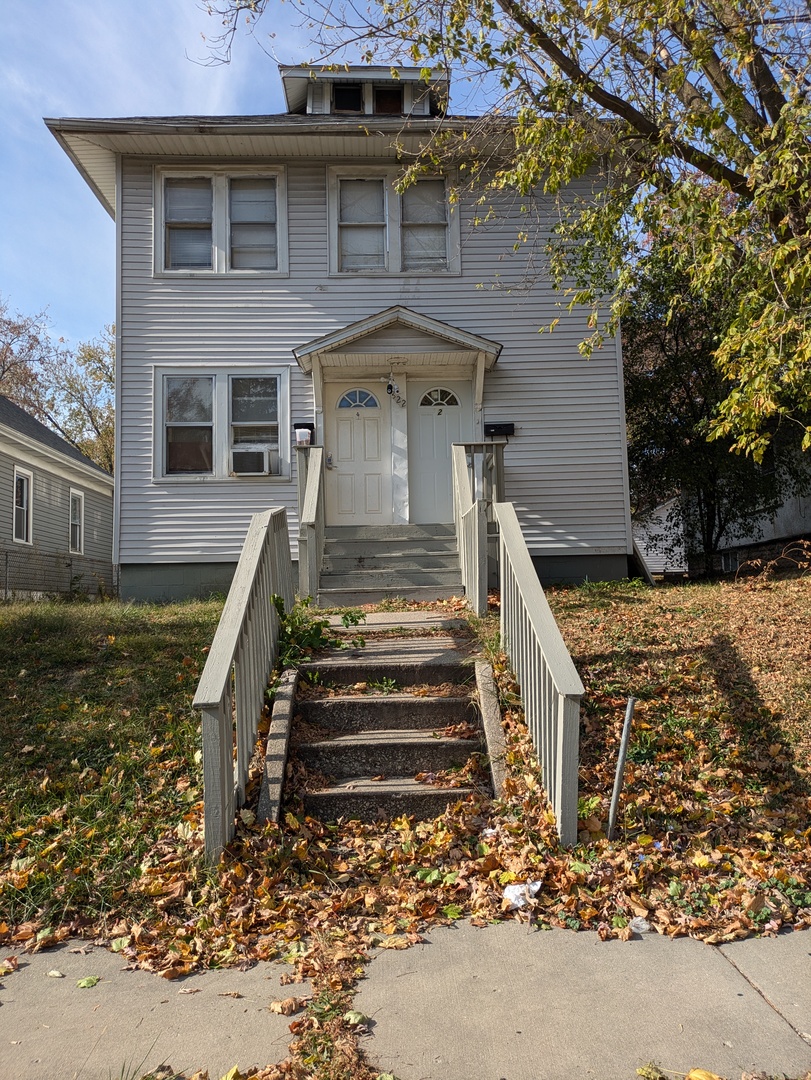
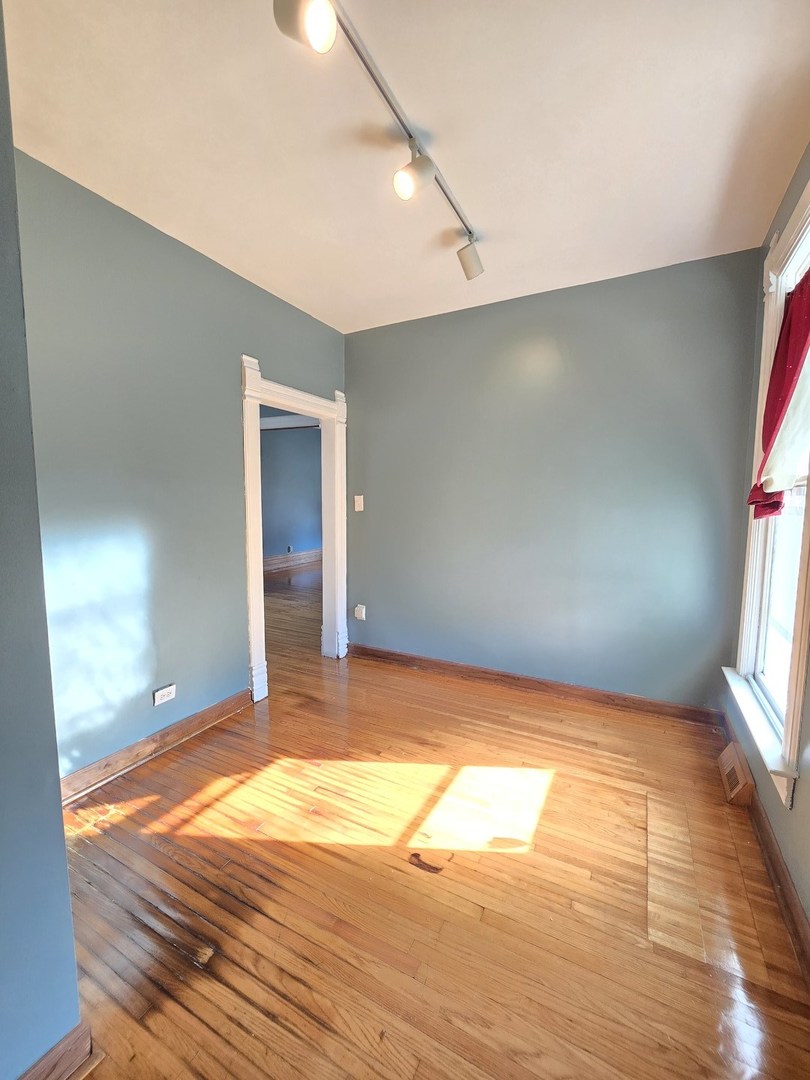
822 S Martin Luther King Jr Ave, Waukegan, IL 60085
$-252
Cash flow
-5.5%
Cash-on-Cash Return
5.1%
Cap rate
0.8%
Rent to Value Ratio
Active
$295,000
4
bds
|
2
ba
|
2,614
sqft
|
built
1901
702 Franklin St, Waukegan, IL 60085
$-40
Cash flow
-0.7%
Cash-on-Cash Return
6.2%
Cap rate
0.9%
Rent to Value Ratio