Waukegan, IL Investment Properties for Sale
Browse homes for sale and investment properties in Waukegan, IL. Refine your search by price, property type, or more.
Best cash flowing properties in Waukegan, IL
Active
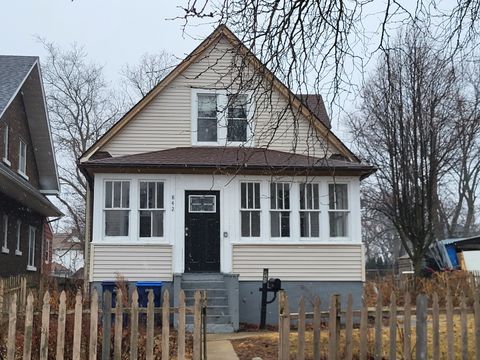
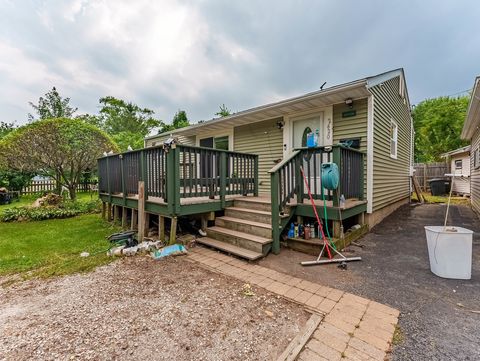
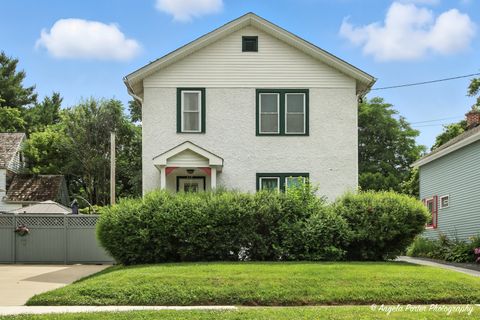
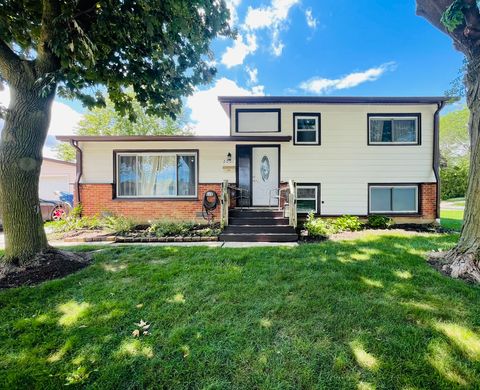
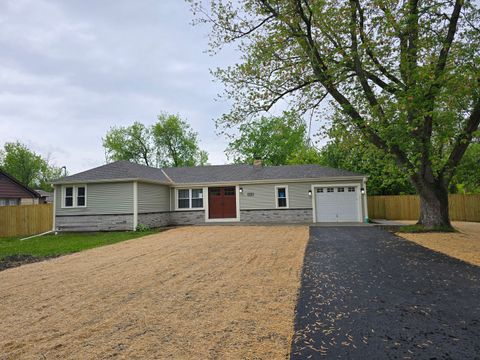
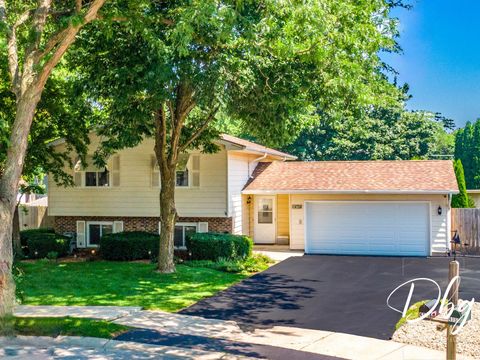
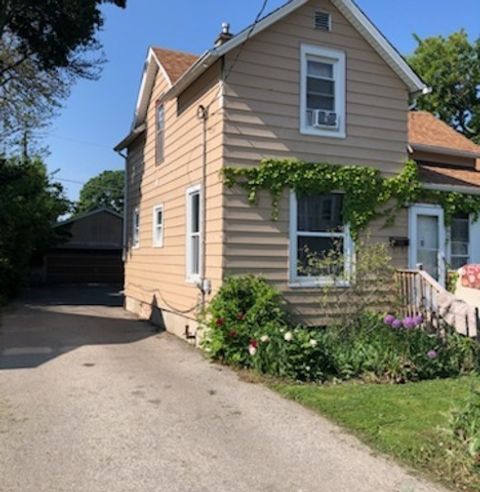
$167,000
3
bds
|
1
ba
|
1,163
sqft
|
built
1920
842 Wadsworth Ave, Waukegan, IL 60085
$295
Cash flow
9.2%
Cash-on-Cash Return
7.8%
Cap rate
1.2%
Rent to Value Ratio
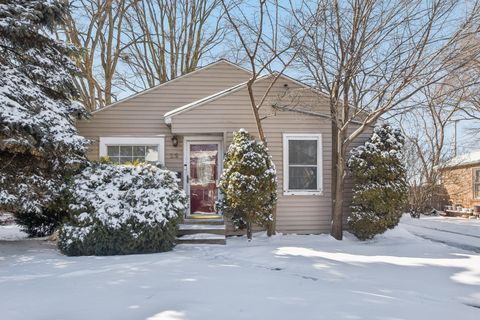
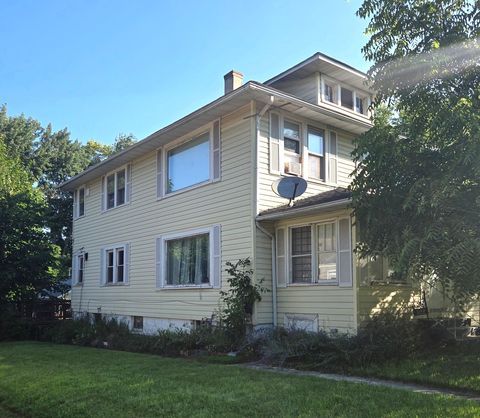
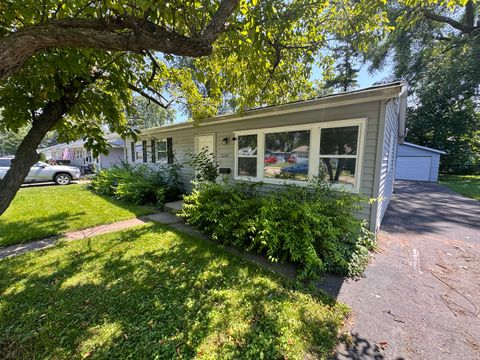
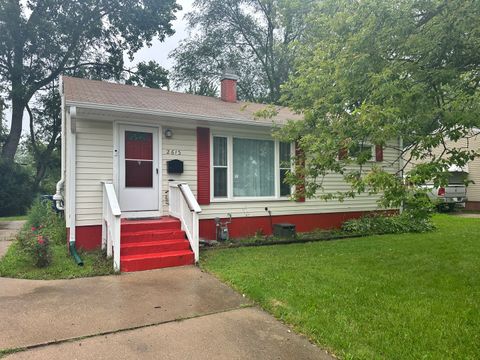
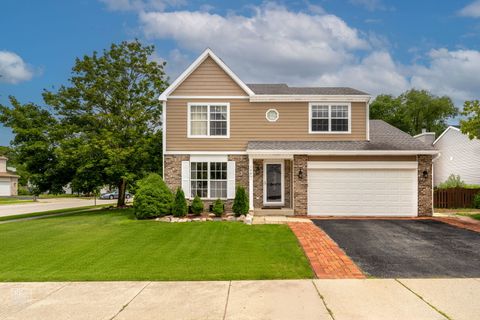
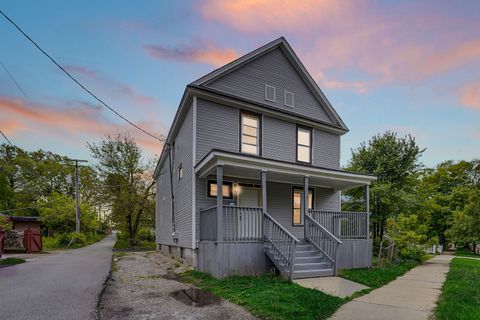
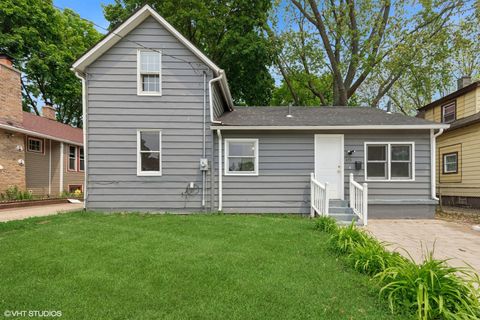
Active
$139,900
2
bds
|
1
ba
|
910
sqft
|
built
1953
22 N Lewis Ave, Waukegan, IL 60085
$242
Cash flow
9.0%
Cash-on-Cash Return
7.8%
Cap rate
1.3%
Rent to Value Ratio
32 out of 33 properties for sale in Waukegan, IL
Limited Results Shown
Create a free account, or log in to reveal all property listings and enjoy the complete experience.
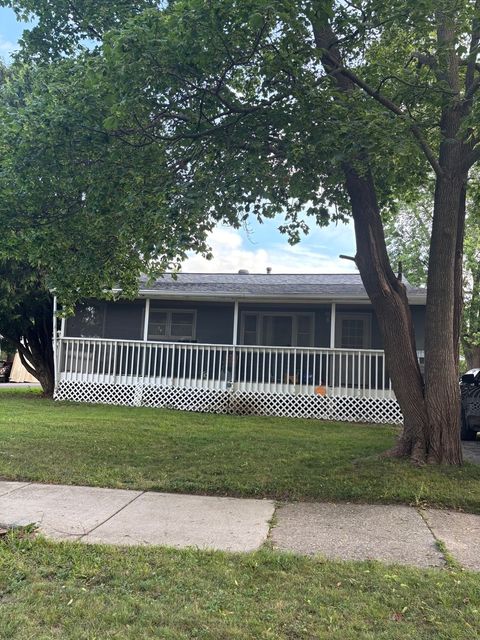
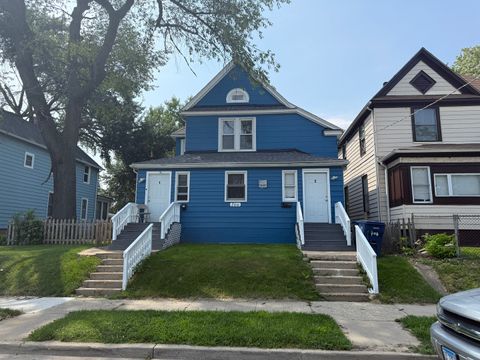
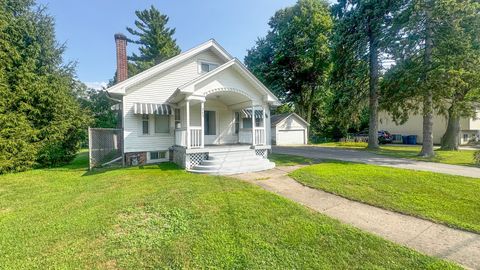
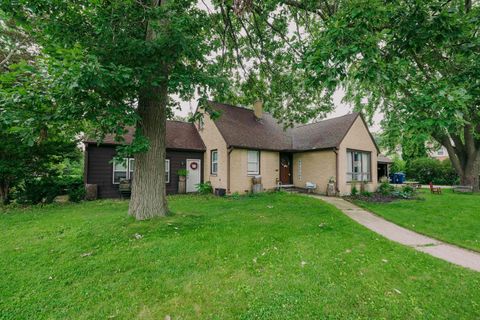
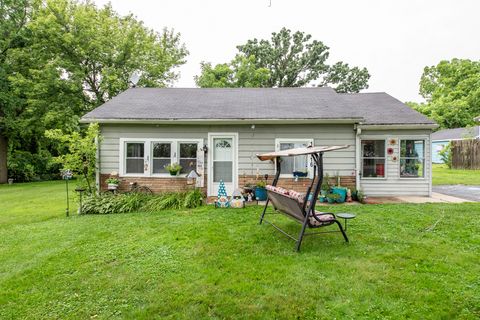
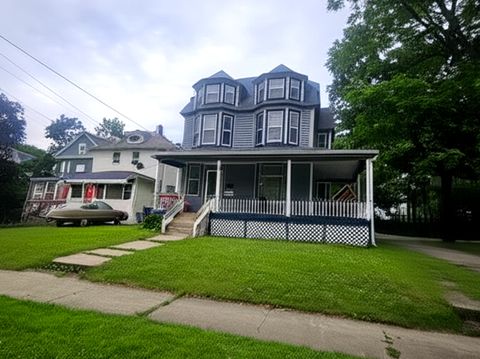
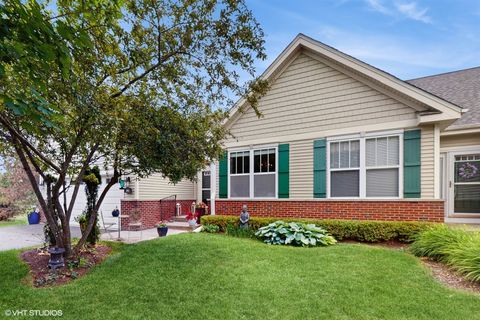
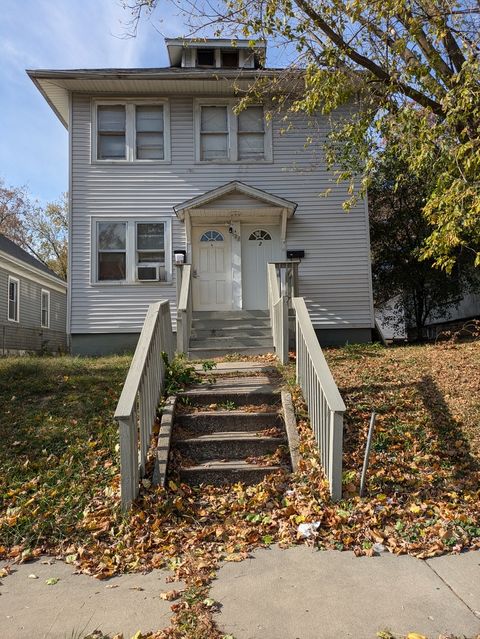
Active
$199,000
2
bds
|
2
ba
|
768
sqft
|
built
1954
1635 Ferry St, Waukegan, IL 60087
$-104
Cash flow
-2.7%
Cash-on-Cash Return
5.1%
Cap rate
0.9%
Rent to Value Ratio
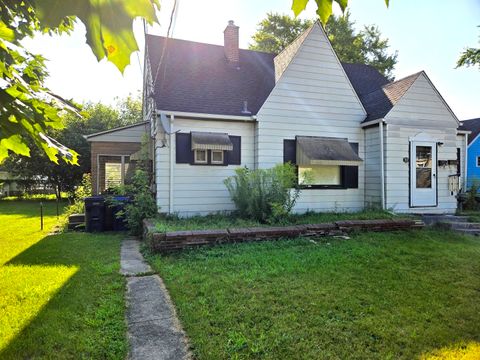
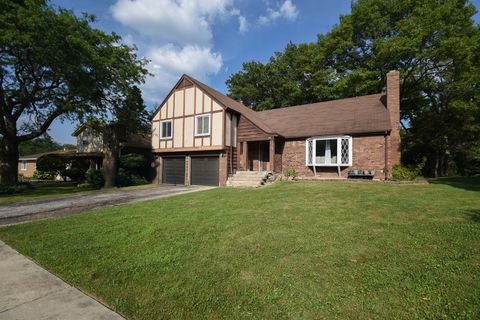
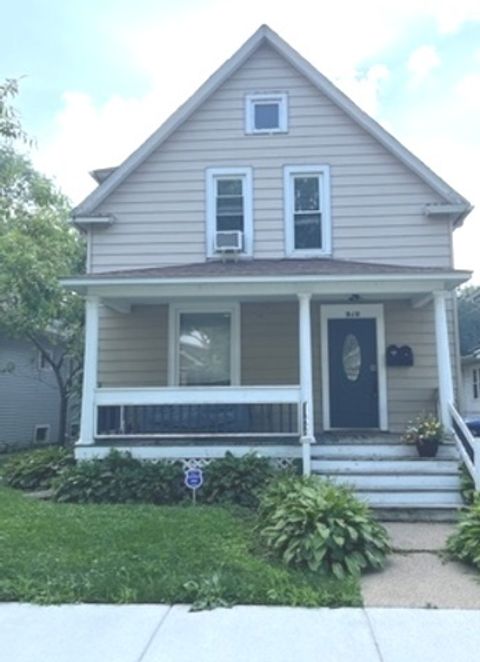
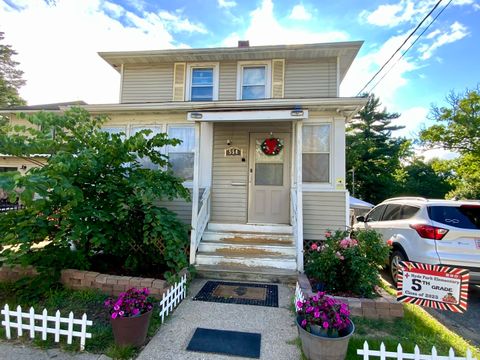
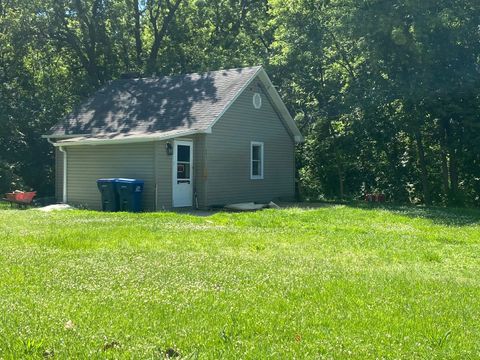
Active
$236,000
5
bds
|
3
ba
|
0
sqft
|
built
1902
1117 Judge Ave, Waukegan, IL 60085
$-125
Cash flow
-2.8%
Cash-on-Cash Return
5.0%
Cap rate
0.8%
Rent to Value Ratio
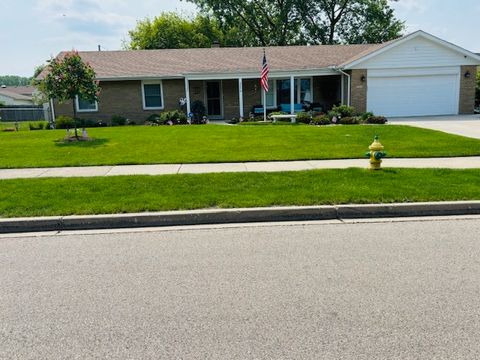
Active
$250,000
3
bds
|
2
ba
|
864
sqft
|
built
1954
2620 Yeoman St, Waukegan, IL 60087
$-250
Cash flow
-5.2%
Cash-on-Cash Return
4.5%
Cap rate
0.8%
Rent to Value Ratio
Active
$238,000
4
bds
|
2
ba
|
0
sqft
|
built
1920
522 George Ave, Waukegan, IL 60085
$-175
Cash flow
-3.8%
Cash-on-Cash Return
4.8%
Cap rate
0.8%
Rent to Value Ratio
Active
$259,000
6
bds
|
2
ba
|
0
sqft
|
built
1920
706 S Martin Luther King Jr Ave, Waukegan, IL 60085
$-289
Cash flow
-5.8%
Cash-on-Cash Return
4.3%
Cap rate
0.8%
Rent to Value Ratio
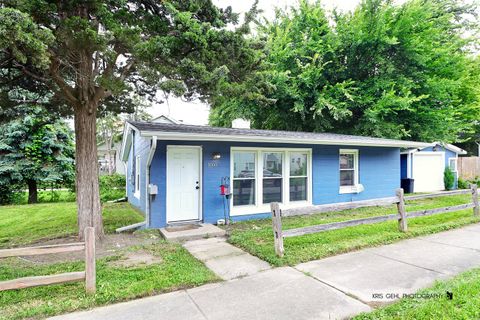
Active
$194,000
2
bds
|
1
ba
|
896
sqft
|
built
1947
1000 Pine St, Waukegan, IL 60085
$126
Cash flow
3.4%
Cash-on-Cash Return
6.5%
Cap rate
1.0%
Rent to Value Ratio
Active
$199,700
4
bds
|
2
ba
|
0
sqft
|
built
1901
419 N Ash St, Waukegan, IL 60085
$152
Cash flow
4.0%
Cash-on-Cash Return
6.6%
Cap rate
1.2%
Rent to Value Ratio
Active
$209,900
3
bds
|
1
ba
|
1,100
sqft
|
built
1950
2105 W Grove Ave, Waukegan, IL 60085
$32
Cash flow
0.8%
Cash-on-Cash Return
5.9%
Cap rate
1.0%
Rent to Value Ratio
Active
$219,900
4
bds
|
2
ba
|
1,120
sqft
|
built
1910
241 N Ash St, Waukegan, IL 60085
$-32
Cash flow
-0.8%
Cash-on-Cash Return
5.5%
Cap rate
0.9%
Rent to Value Ratio
Active
$295,000
4
bds
|
3
ba
|
2,012
sqft
|
built
1971
339 N Pioneer Rd, Waukegan, IL 60085
$-54
Cash flow
-1.0%
Cash-on-Cash Return
5.5%
Cap rate
0.9%
Rent to Value Ratio
Active
$264,999
3
bds
|
2
ba
|
1,025
sqft
|
built
1959
2001 Devonshire Rd, Waukegan, IL 60087
$6
Cash flow
0.1%
Cash-on-Cash Return
5.7%
Cap rate
0.8%
Rent to Value Ratio
Active
$229,000
3
bds
|
2
ba
|
1,728
sqft
|
built
1953
2613 N Lewis Ave, Waukegan, IL 60087
$15
Cash flow
0.3%
Cash-on-Cash Return
5.8%
Cap rate
1.0%
Rent to Value Ratio
Active
$320,000
3
bds
|
3
ba
|
1,772
sqft
|
built
1955
2115 Lydia St, Waukegan, IL 60085
$-295
Cash flow
-4.8%
Cash-on-Cash Return
4.6%
Cap rate
0.9%
Rent to Value Ratio
Active
$360,000
4
bds
|
2
ba
|
0
sqft
|
built
1920
918 N Ash St, Waukegan, IL 60085
$-835
Cash flow
-12.1%
Cash-on-Cash Return
2.9%
Cap rate
0.5%
Rent to Value Ratio
Active
$335,000
4
bds
|
2
ba
|
1,394
sqft
|
built
1954
2524 Gray Ct, Waukegan, IL 60085
$-540
Cash flow
-8.4%
Cash-on-Cash Return
3.7%
Cap rate
0.6%
Rent to Value Ratio
Active
$365,000
4
bds
|
4
ba
|
2,300
sqft
|
built
1997
1745 N Frolic Ave, Waukegan, IL 60085
$-471
Cash flow
-6.7%
Cash-on-Cash Return
4.1%
Cap rate
0.8%
Rent to Value Ratio
Active
$194,900
2
bds
|
1
ba
|
632
sqft
|
built
1954
12716 W Grandview Ave, Waukegan, IL 60085
$-10
Cash flow
-0.3%
Cash-on-Cash Return
5.6%
Cap rate
0.8%
Rent to Value Ratio
Active
$199,000
3
bds
|
3
ba
|
1,264
sqft
|
built
1901
554 S Mc Alister Ave, Waukegan, IL 60085
$73
Cash flow
1.9%
Cash-on-Cash Return
6.1%
Cap rate
1.0%
Rent to Value Ratio
Active
$319,900
4
bds
|
2
ba
|
1,025
sqft
|
built
1981
4750 Crest Ct, Waukegan, IL 60087
$-134
Cash flow
-2.2%
Cash-on-Cash Return
5.2%
Cap rate
0.6%
Rent to Value Ratio
Active
$325,000
6
bds
|
2
ba
|
0
sqft
|
built
1901
515 George Ave, Waukegan, IL 60085
$-725
Cash flow
-11.6%
Cash-on-Cash Return
3.0%
Cap rate
0.6%
Rent to Value Ratio
Active
$269,900
5
bds
|
2
ba
|
3,870
sqft
|
built
1903
723 N County St, Waukegan, IL 60085
$-106
Cash flow
-2.0%
Cash-on-Cash Return
5.2%
Cap rate
1.0%
Rent to Value Ratio
Active
$124,900
1
bds
|
1
ba
|
528
sqft
|
built
1935
621 N Austin Ave, Waukegan, IL 60085
$17
Cash flow
0.7%
Cash-on-Cash Return
5.8%
Cap rate
1.0%
Rent to Value Ratio
Active
$389,999
4
bds
|
4
ba
|
2,293
sqft
|
built
2007
301 W Eagle Ct, Waukegan, IL 60087
$-1,058
Cash flow
-14.2%
Cash-on-Cash Return
2.4%
Cap rate
0.7%
Rent to Value Ratio
Active
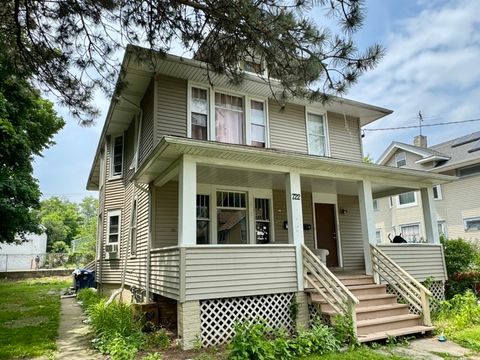
$160,000
6
bds
|
2
ba
|
0
sqft
|
built
1920
722 Lenox Ave, Waukegan, IL 60085
$132
Cash flow
4.3%
Cash-on-Cash Return
6.7%
Cap rate
1.3%
Rent to Value Ratio
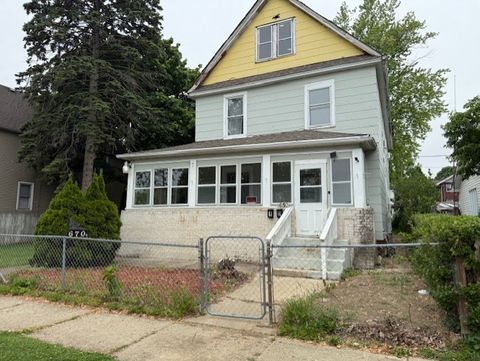
Active
$255,000
4
bds
|
2
ba
|
0
sqft
|
built
1920
670 S Martin Luther King Jr Ave, Waukegan, IL 60085
$-22
Cash flow
-0.5%
Cash-on-Cash Return
5.6%
Cap rate
0.9%
Rent to Value Ratio
Active
$380,000
3
bds
|
3
ba
|
1,886
sqft
|
built
1972
2250 Yeoman St, Waukegan, IL 60087
$-626
Cash flow
-8.6%
Cash-on-Cash Return
3.7%
Cap rate
0.7%
Rent to Value Ratio
Active
$190,000
5
bds
|
2
ba
|
876
sqft
|
built
1901
1416 Hamilton Ct, Waukegan, IL 60085
$188
Cash flow
5.2%
Cash-on-Cash Return
6.9%
Cap rate
1.1%
Rent to Value Ratio
Active
$219,900
3
bds
|
2
ba
|
0
sqft
|
built
1905
413 N Poplar St, Waukegan, IL 60085
$-47
Cash flow
-1.1%
Cash-on-Cash Return
5.4%
Cap rate
0.8%
Rent to Value Ratio
Active
$239,000
2
bds
|
2
ba
|
0
sqft
|
built
1925
822 S Martin Luther King Jr Ave, Waukegan, IL 60085
$-125
Cash flow
-2.7%
Cash-on-Cash Return
5.1%
Cap rate
0.8%
Rent to Value Ratio

Active
$285,000
4
bds
|
2
ba
|
2,614
sqft
|
built
1901
702 Franklin St, Waukegan, IL 60085
$164
Cash flow
3.0%
Cash-on-Cash Return
6.4%
Cap rate
1.0%
Rent to Value Ratio