Milwaukee County Investment Properties for Sale
Browse homes for sale and investment properties in Milwaukee County. Refine your search by price, property type, or more.
Best cash flowing properties in Milwaukee County
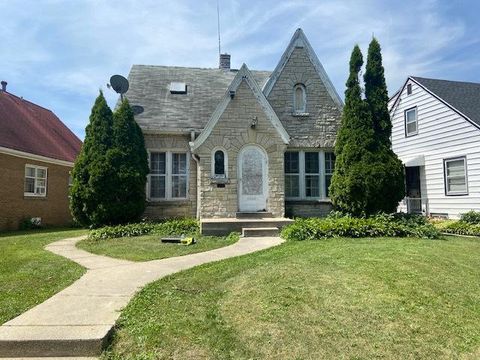
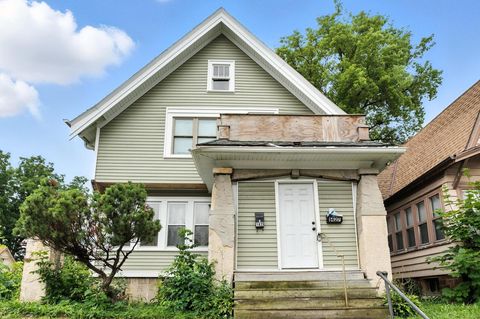
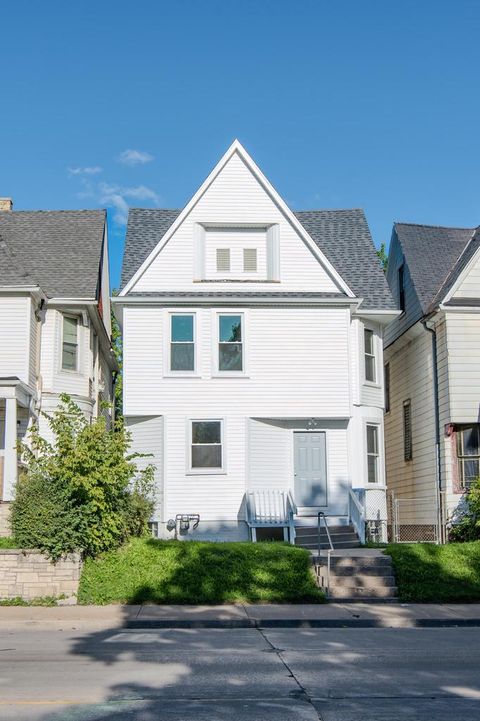
Active
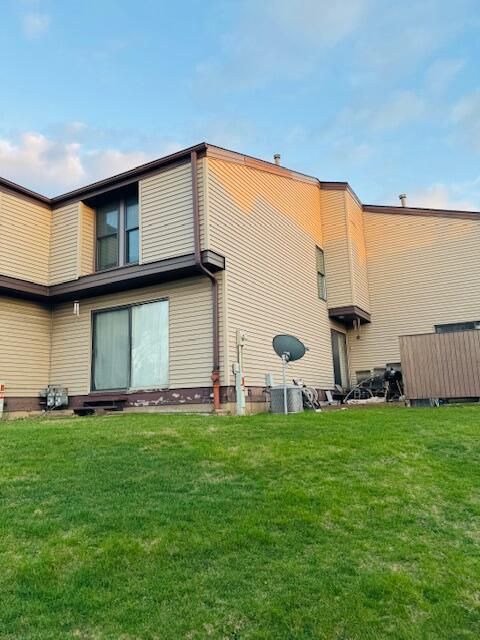
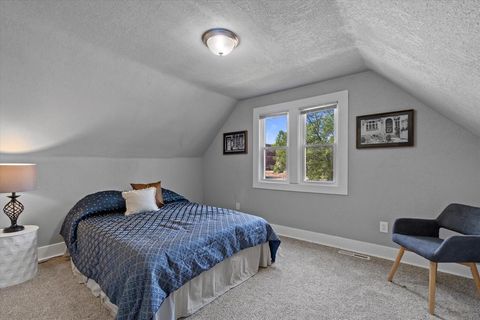
$120,000
3
bds
|
1
ba
|
1,177
sqft
|
built
1937
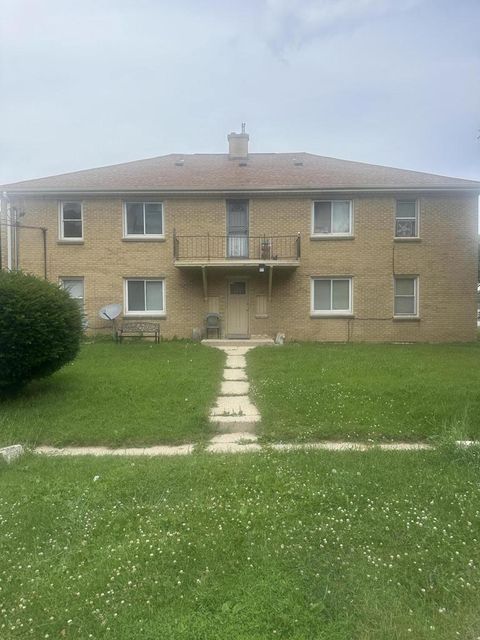
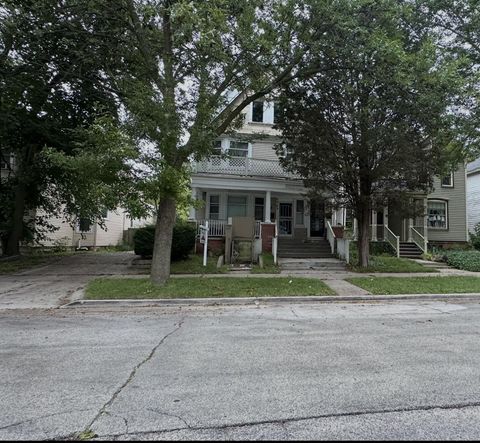
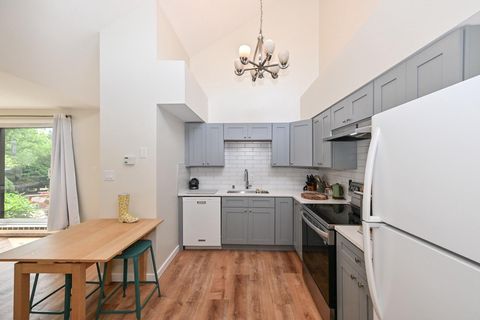
4045 N Montreal St, Milwaukee, WI 53216
$92
Cash flow
4.0%
Cash-on-Cash Return
7.1%
Cap rate
1.1%
Rent to Value Ratio

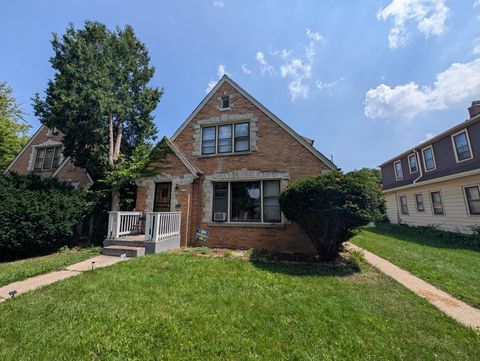
Active
$120,000
2
bds
|
1
ba
|
1,336
sqft
|
built
1927
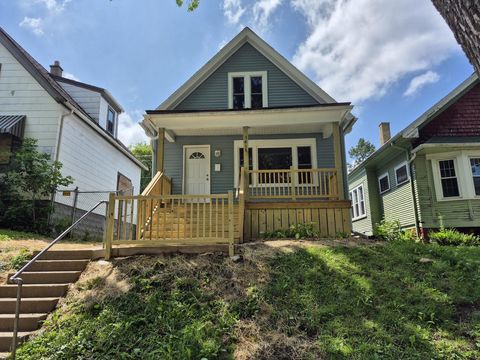
1309 N 38th St, Milwaukee, WI 53208
$35
Cash flow
1.5%
Cash-on-Cash Return
6.5%
Cap rate
0.9%
Rent to Value Ratio
643 out of 804 properties for sale in Milwaukee County
Limited Results Shown
Create a free account, or log in to reveal all property listings and enjoy the complete experience.
Active
$184,900
3
bds
|
1
ba
|
2,123
sqft
|
built
1949
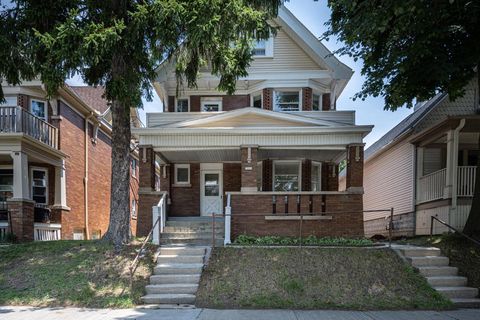
3758 N 41st St, Milwaukee, WI 53216
$-455
Cash flow
-12.8%
Cash-on-Cash Return
3.2%
Cap rate
0.6%
Rent to Value Ratio
Active
$184,999
5
bds
|
3
ba
|
1,887
sqft
|
built
1925
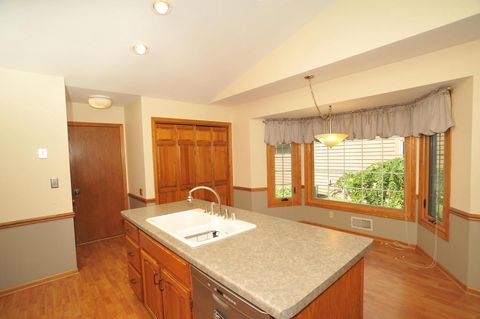
3634 N 9th St, Milwaukee, WI 53206
$-91
Cash flow
-2.6%
Cash-on-Cash Return
5.6%
Cap rate
0.8%
Rent to Value Ratio
Active
$249,500
3
bds
|
2
ba
|
1,663
sqft
|
built
1955
3739 N 97th Pl, Milwaukee, WI 53222
$-381
Cash flow
-8.0%
Cash-on-Cash Return
4.3%
Cap rate
0.8%
Rent to Value Ratio
Active
$449,900
bds
|
0
ba
|
3,850
sqft
|
built
1951
4715 W Capitol Dr, Milwaukee, WI 53216
$-1,758
Cash flow
-20.4%
Cash-on-Cash Return
1.5%
Cap rate
0.3%
Rent to Value Ratio
Active
$265,000
6
bds
|
1
ba
|
2,484
sqft
|
built
1900
2220 N Holton St, Milwaukee, WI 53212
$-767
Cash flow
-15.1%
Cash-on-Cash Return
2.7%
Cap rate
0.5%
Rent to Value Ratio
Active
$124,900
2
bds
|
2
ba
|
1,067
sqft
|
built
1974
3749 N 88th St, Milwaukee, WI 53222
$-386
Cash flow
-16.1%
Cash-on-Cash Return
2.4%
Cap rate
0.9%
Rent to Value Ratio
Active
$230,000
3
bds
|
1
ba
|
1,179
sqft
|
built
1968
7124 W Lima St, Milwaukee, WI 53223
$-319
Cash flow
-7.2%
Cash-on-Cash Return
4.5%
Cap rate
0.8%
Rent to Value Ratio
Active
$415,000
6
bds
|
2
ba
|
2,901
sqft
|
built
1905
2323 N Palmer St, Milwaukee, WI 53212
$-1,445
Cash flow
-18.2%
Cash-on-Cash Return
2.0%
Cap rate
0.4%
Rent to Value Ratio
Active
$277,000
1
bds
|
1
ba
|
1,110
sqft
|
built
2005
1905 N Water St, Milwaukee, WI 53202
$-938
Cash flow
-17.7%
Cash-on-Cash Return
2.1%
Cap rate
0.7%
Rent to Value Ratio
Active
$289,900
5
bds
|
0
ba
|
2,736
sqft
|
built
1956
6535 W Keefe Avenue Pkwy, Milwaukee, WI 53216
$-976
Cash flow
-17.6%
Cash-on-Cash Return
2.1%
Cap rate
0.5%
Rent to Value Ratio
Active
$286,900
1
bds
|
1
ba
|
1,172
sqft
|
built
2005
601 E Ogden Ave, Milwaukee, WI 53202
$-1,024
Cash flow
-18.6%
Cash-on-Cash Return
1.9%
Cap rate
0.6%
Rent to Value Ratio
Active
$169,900
2
bds
|
1.5
ba
|
980
sqft
|
built
1973
5225 S 13th St, Milwaukee, WI 53221
$-278
Cash flow
-8.5%
Cash-on-Cash Return
4.2%
Cap rate
0.6%
Rent to Value Ratio
Active
$259,900
4
bds
|
2
ba
|
1,618
sqft
|
built
1957
5306 W Calumet Rd, Milwaukee, WI 53223
$-509
Cash flow
-10.2%
Cash-on-Cash Return
3.8%
Cap rate
0.7%
Rent to Value Ratio
Active
$275,000
4
bds
|
1
ba
|
1,978
sqft
|
built
1953
3520 N 77th St, Milwaukee, WI 53222
$-824
Cash flow
-15.6%
Cash-on-Cash Return
2.6%
Cap rate
0.5%
Rent to Value Ratio
Active
$198,900
3
bds
|
2
ba
|
1,021
sqft
|
built
1951
4726 W Villard Ave, Milwaukee, WI 53218
$-391
Cash flow
-10.3%
Cash-on-Cash Return
3.8%
Cap rate
0.6%
Rent to Value Ratio
Active
$179,900
3
bds
|
1
ba
|
1,005
sqft
|
built
1903
4702 N 35th St, Milwaukee, WI 53209
$-295
Cash flow
-8.6%
Cash-on-Cash Return
4.2%
Cap rate
0.7%
Rent to Value Ratio
Active
$172,500
2
bds
|
1
ba
|
1,292
sqft
|
built
1885
3415 N 2nd St, Milwaukee, WI 53212
$-125
Cash flow
-3.8%
Cash-on-Cash Return
5.3%
Cap rate
0.6%
Rent to Value Ratio
Active
$459,555
bds
|
0
ba
|
2,828
sqft
|
built
1912
3066 N Pierce St, Milwaukee, WI 53212
$-1,675
Cash flow
-19.0%
Cash-on-Cash Return
1.8%
Cap rate
0.4%
Rent to Value Ratio
Active
$369,900
2
bds
|
2
ba
|
1,518
sqft
|
built
1988
3817 S Oakbrook Dr, Greenfield, WI 53228
$-889
Cash flow
-12.5%
Cash-on-Cash Return
3.3%
Cap rate
0.6%
Rent to Value Ratio
Active
$309,000
2
bds
|
2
ba
|
1,493
sqft
|
built
1972
400 W Willow Ct, Fox Point, WI 53217
$-1,120
Cash flow
-18.9%
Cash-on-Cash Return
1.8%
Cap rate
0.6%
Rent to Value Ratio
Active
$259,900
3
bds
|
1
ba
|
1,300
sqft
|
built
1947
326 S 60th St, Milwaukee, WI 53214
$8
Cash flow
0.2%
Cash-on-Cash Return
6.2%
Cap rate
0.8%
Rent to Value Ratio
Active
$199,000
2
bds
|
1
ba
|
809
sqft
|
built
1924
231 N 72nd St, Milwaukee, WI 53213
$-432
Cash flow
-11.3%
Cash-on-Cash Return
3.5%
Cap rate
0.7%
Rent to Value Ratio
Active
$249,900
3
bds
|
2
ba
|
1,324
sqft
|
built
1961
3935 N 82nd St, Milwaukee, WI 53222
$-558
Cash flow
-11.6%
Cash-on-Cash Return
3.5%
Cap rate
0.6%
Rent to Value Ratio
Active
$104,977
4
bds
|
1
ba
|
2,198
sqft
|
built
1924
1425 W Burleigh St, Milwaukee, WI 53206
$20
Cash flow
1.0%
Cash-on-Cash Return
6.4%
Cap rate
1.0%
Rent to Value Ratio
Active
$285,000
4
bds
|
1
ba
|
1,000
sqft
|
built
1950
1580 W Howard Ave, Milwaukee, WI 53221
$-584
Cash flow
-10.7%
Cash-on-Cash Return
3.7%
Cap rate
0.6%
Rent to Value Ratio
Active
$180,000
3
bds
|
1
ba
|
971
sqft
|
built
1890
2941 N Dr William Finlayson St, Milwaukee, WI 53212
$-257
Cash flow
-7.4%
Cash-on-Cash Return
4.4%
Cap rate
0.6%
Rent to Value Ratio

Active
$800,000
2
bds
|
2
ba
|
2,094
sqft
|
built
2009
1313 N Franklin Pl, Milwaukee, WI 53202
$-3,979
Cash flow
-26.0%
Cash-on-Cash Return
0.2%
Cap rate
0.5%
Rent to Value Ratio
Active
$289,800
1
bds
|
1
ba
|
733
sqft
|
built
1990
1660 N Prospect Ave, Milwaukee, WI 53202
$-1,507
Cash flow
-27.1%
Cash-on-Cash Return
-0.1%
Cap rate
0.5%
Rent to Value Ratio

Active
$239,000
1
bds
|
1
ba
|
860
sqft
|
built
1965
2525 S Shore Dr, Milwaukee, WI 53207
$-342
Cash flow
-7.5%
Cash-on-Cash Return
4.4%
Cap rate
0.7%
Rent to Value Ratio
Active
$199,000
4
bds
|
2
ba
|
2,000
sqft
|
built
1897
2008 N 35th St, Milwaukee, WI 53208
$-98
Cash flow
-2.6%
Cash-on-Cash Return
5.6%
Cap rate
0.7%
Rent to Value Ratio
Active
$550,000
1
bds
|
2
ba
|
1,645
sqft
|
built
1921
215 W Maple St, Milwaukee, WI 53204
$-2,133
Cash flow
-20.2%
Cash-on-Cash Return
1.5%
Cap rate
0.4%
Rent to Value Ratio
Active
$284,900
3
bds
|
1
ba
|
1,427
sqft
|
built
1969
10452 W Tower Ave, Milwaukee, WI 53224
$-528
Cash flow
-9.7%
Cash-on-Cash Return
3.9%
Cap rate
0.7%
Rent to Value Ratio
Active
$150,000
4
bds
|
1
ba
|
2,649
sqft
|
built
1910
1350 N 36th St, Milwaukee, WI 53208
$-419
Cash flow
-14.6%
Cash-on-Cash Return
2.8%
Cap rate
0.7%
Rent to Value Ratio
Active
$315,000
3
bds
|
2
ba
|
1,493
sqft
|
built
1950
3035 N 88th St, Milwaukee, WI 53222
$-644
Cash flow
-10.7%
Cash-on-Cash Return
3.7%
Cap rate
0.6%
Rent to Value Ratio
Active
$349,900
4
bds
|
2.5
ba
|
1,568
sqft
|
built
1924
1512 E Oklahoma Ave, Milwaukee, WI 53207
$-1,032
Cash flow
-15.4%
Cash-on-Cash Return
2.6%
Cap rate
0.5%
Rent to Value Ratio
Active
$140,000
4
bds
|
1
ba
|
1,882
sqft
|
built
1926
4531 N 29th St, Milwaukee, WI 53209
$-188
Cash flow
-7.0%
Cash-on-Cash Return
4.5%
Cap rate
0.8%
Rent to Value Ratio
Active
$249,900
3
bds
|
1
ba
|
1,010
sqft
|
built
1925
8508 W Greenfield Ave, West Allis, WI 53214
$-291
Cash flow
-6.1%
Cash-on-Cash Return
4.7%
Cap rate
0.7%
Rent to Value Ratio
Active
$849,900
4
bds
|
3
ba
|
2,755
sqft
|
built
1959
8925 N Maitland Rd, Bayside, WI 53217
$-3,268
Cash flow
-20.1%
Cash-on-Cash Return
1.5%
Cap rate
0.4%
Rent to Value Ratio