Milwaukee County Investment Properties for Sale
Browse homes for sale and investment properties in Milwaukee County. Refine your search by price, property type, or more.
Best cash flowing properties in Milwaukee County
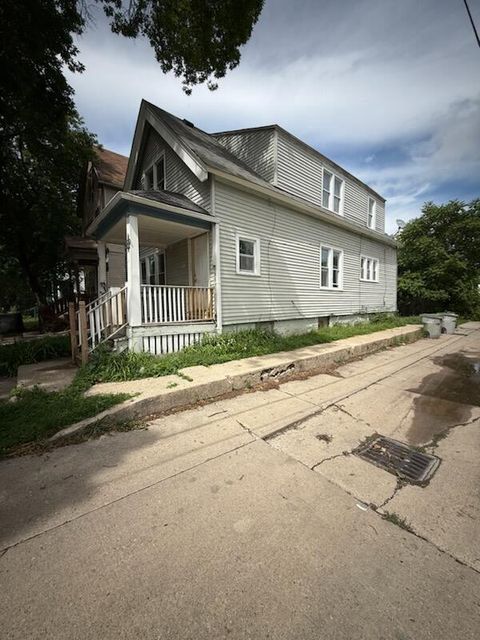
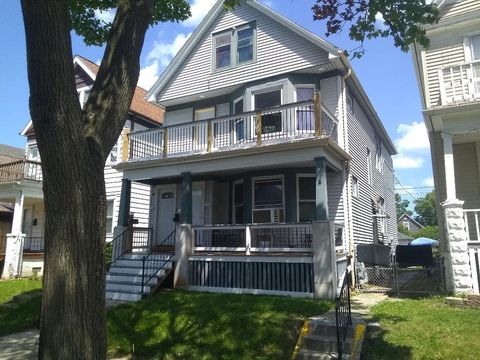
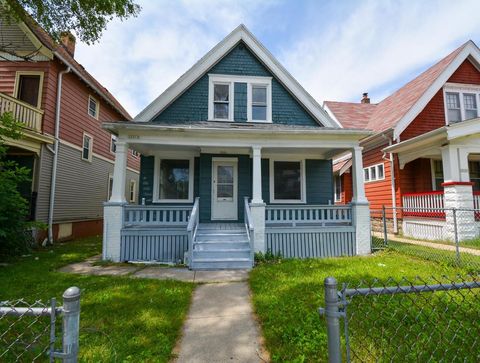
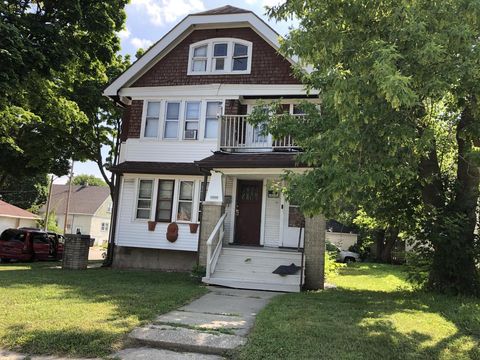
Active
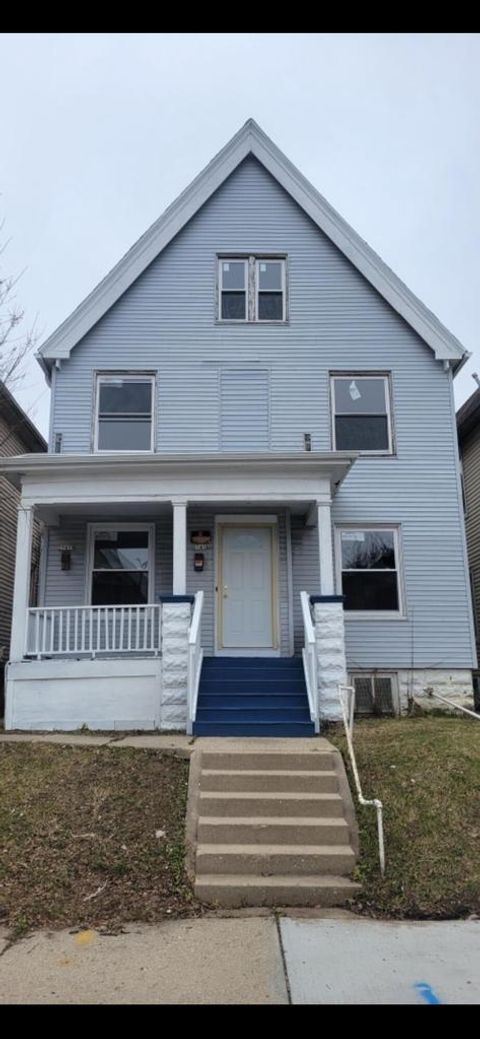
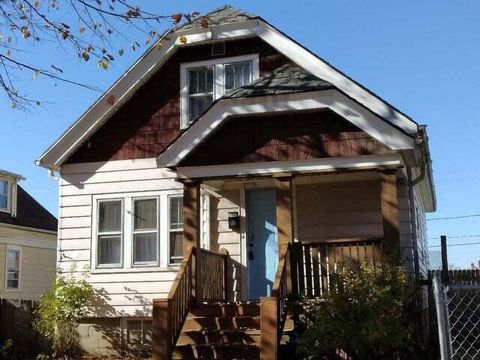
$60,000
3
bds
|
1
ba
|
1,386
sqft
|
built
1900
2564 N 17th St, Milwaukee, WI 53206
$681
Cash flow
13.2%
Cash-on-Cash Return
13.6%
Cap rate
2.2%
Rent to Value Ratio
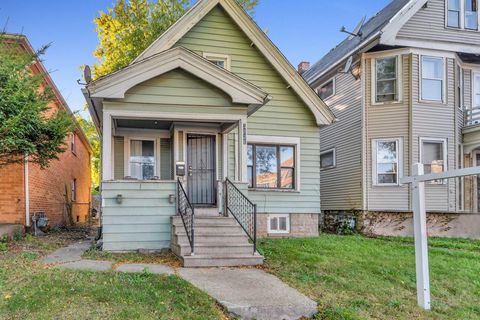
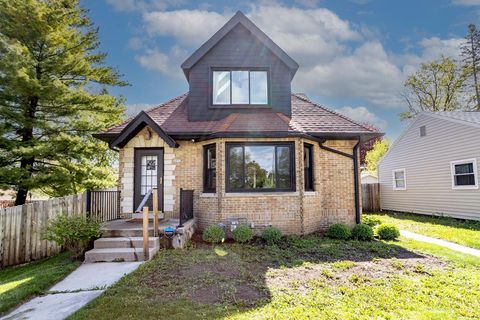
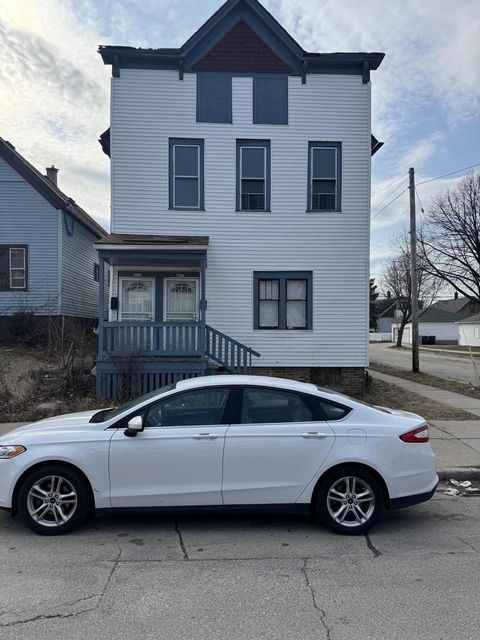
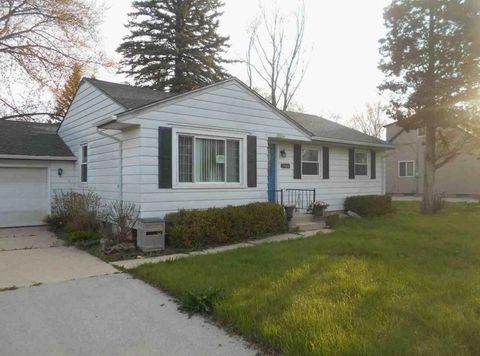
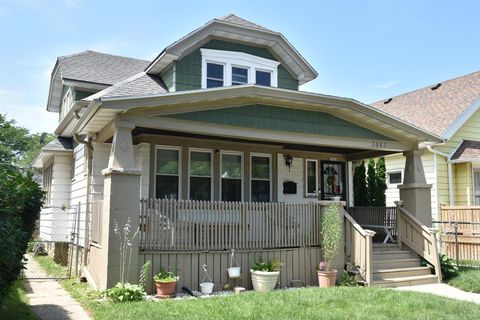
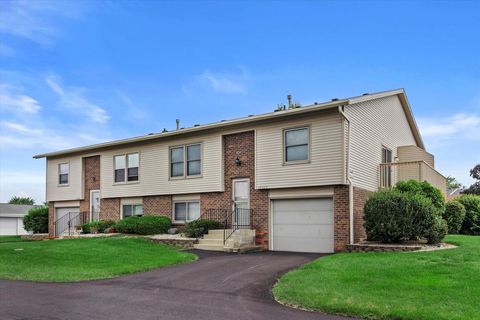
Active
$85,000
3
bds
|
0
ba
|
1,174
sqft
|
built
1915
3221 N 38th St, Milwaukee, WI 53216
$250
Cash flow
15.3%
Cash-on-Cash Return
9.7%
Cap rate
1.4%
Rent to Value Ratio
512 out of 660 properties for sale in Milwaukee County
Limited Results Shown
Create a free account, or log in to reveal all property listings and enjoy the complete experience.
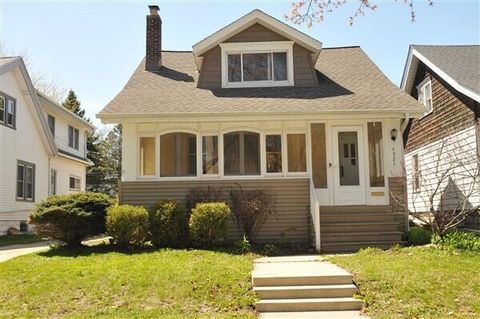
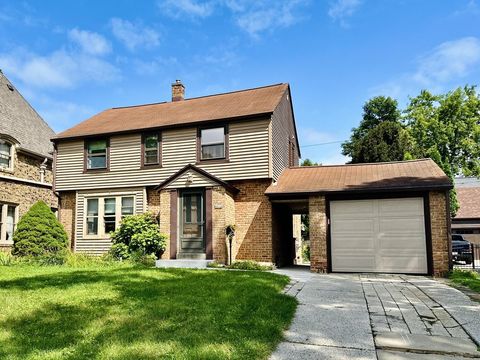
Active
$534,900
4
bds
|
3
ba
|
1,614
sqft
|
built
1920
4321 N Murray Ave, Milwaukee, WI 53211
$-2,285
Cash flow
-22.3%
Cash-on-Cash Return
1.0%
Cap rate
0.4%
Rent to Value Ratio
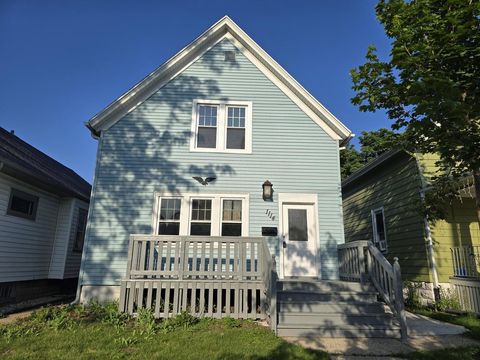
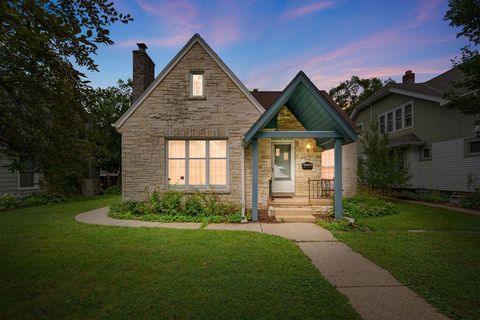
Active
$330,000
4
bds
|
2
ba
|
1,421
sqft
|
built
1909
1114 S 47th St, West Milwaukee, WI 53214
$-1,190
Cash flow
-18.8%
Cash-on-Cash Return
1.8%
Cap rate
0.3%
Rent to Value Ratio
Active
$369,900
4
bds
|
0
ba
|
1,800
sqft
|
built
1928
3044 S 9th Pl, Milwaukee, WI 53215
$-1,433
Cash flow
-20.2%
Cash-on-Cash Return
1.5%
Cap rate
0.3%
Rent to Value Ratio
Active
$529,900
5
bds
|
3
ba
|
3,000
sqft
|
built
1936
4892 N Mohawk Ave, Glendale, WI 53217
$-1,414
Cash flow
-13.9%
Cash-on-Cash Return
2.9%
Cap rate
0.5%
Rent to Value Ratio
Active
$325,000
5
bds
|
2
ba
|
1,947
sqft
|
built
1954
5326 W Crawford Ave, Milwaukee, WI 53220
$-761
Cash flow
-12.2%
Cash-on-Cash Return
3.3%
Cap rate
0.6%
Rent to Value Ratio
Active
$245,555
6
bds
|
0
ba
|
3,043
sqft
|
built
1923
2809 N 48th St, Milwaukee, WI 53210
$-679
Cash flow
-14.4%
Cash-on-Cash Return
2.8%
Cap rate
0.5%
Rent to Value Ratio
Active
$1,399,000
7
bds
|
5
ba
|
6,911
sqft
|
built
1895
2701 N Lake Dr, Milwaukee, WI 53211
$-7,346
Cash flow
-27.4%
Cash-on-Cash Return
-0.2%
Cap rate
0.3%
Rent to Value Ratio
Active
$193,000
6
bds
|
1
ba
|
1,840
sqft
|
built
1953
5323 N 27th St, Milwaukee, WI 53209
$-487
Cash flow
-13.2%
Cash-on-Cash Return
3.1%
Cap rate
0.6%
Rent to Value Ratio
Active
$215,000
2
bds
|
1
ba
|
730
sqft
|
built
1946
5970 S 28th St, Greenfield, WI 53221
$-584
Cash flow
-14.2%
Cash-on-Cash Return
2.9%
Cap rate
0.5%
Rent to Value Ratio

Active
$307,500
3
bds
|
1
ba
|
2,786
sqft
|
built
1927
2519 N 60th St, Milwaukee, WI 53210
$-828
Cash flow
-14.0%
Cash-on-Cash Return
2.9%
Cap rate
0.5%
Rent to Value Ratio
Active
$259,900
3
bds
|
1
ba
|
963
sqft
|
built
1953
5509 N 20th St, Milwaukee, WI 53209
$-183
Cash flow
-3.7%
Cash-on-Cash Return
5.3%
Cap rate
0.8%
Rent to Value Ratio
Active
$118,000
5
bds
|
0
ba
|
1,932
sqft
|
built
1910
2541 N 34th St, Milwaukee, WI 53210
$-3
Cash flow
-0.1%
Cash-on-Cash Return
6.1%
Cap rate
0.8%
Rent to Value Ratio
Active
$169,900
7
bds
|
0
ba
|
0
sqft
|
built
1892
3573 N 11th St, Milwaukee, WI 53206
$-280
Cash flow
-8.6%
Cash-on-Cash Return
4.2%
Cap rate
0.6%
Rent to Value Ratio
Active
$255,000
3
bds
|
1
ba
|
1,310
sqft
|
built
1917
2512 S 84th St, West Allis, WI 53227
$-301
Cash flow
-6.2%
Cash-on-Cash Return
4.7%
Cap rate
0.7%
Rent to Value Ratio
Active
$349,900
5
bds
|
1.5
ba
|
2,118
sqft
|
built
1974
2773 S 58th St, Milwaukee, WI 53219
$-1,398
Cash flow
-20.8%
Cash-on-Cash Return
1.4%
Cap rate
0.4%
Rent to Value Ratio
Active
$139,900
5
bds
|
1
ba
|
1,688
sqft
|
built
1913
3221 N 29th St, Milwaukee, WI 53216
$-175
Cash flow
-6.5%
Cash-on-Cash Return
4.6%
Cap rate
0.6%
Rent to Value Ratio
Active
$265,980
3
bds
|
2
ba
|
1,081
sqft
|
built
1957
5400 W Dean Rd, Brown Deer, WI 53223
$-571
Cash flow
-11.2%
Cash-on-Cash Return
3.6%
Cap rate
0.6%
Rent to Value Ratio
Active
$499,900
3
bds
|
1.5
ba
|
1,798
sqft
|
built
1947
4856 N Woodburn St, Whitefish Bay, WI 53217
$-1,242
Cash flow
-13.0%
Cash-on-Cash Return
3.2%
Cap rate
0.6%
Rent to Value Ratio
Active
$339,900
4
bds
|
1
ba
|
2,205
sqft
|
built
1940
3317 S 46th St, Greenfield, WI 53219
$-571
Cash flow
-8.8%
Cash-on-Cash Return
4.1%
Cap rate
0.7%
Rent to Value Ratio
Active
$505,999
4
bds
|
1.5
ba
|
1,840
sqft
|
built
1946
4823 N Elkhart Ave, Whitefish Bay, WI 53217
$-1,133
Cash flow
-11.7%
Cash-on-Cash Return
3.5%
Cap rate
0.6%
Rent to Value Ratio
Active
$285,000
2
bds
|
2
ba
|
1,618
sqft
|
built
2004
3053 W Drexel Ave, Franklin, WI 53132
$-947
Cash flow
-17.3%
Cash-on-Cash Return
2.2%
Cap rate
0.6%
Rent to Value Ratio
Active
$464,900
3
bds
|
1
ba
|
2,209
sqft
|
built
1983
7535 S Bishops Way, Franklin, WI 53132
$-1,173
Cash flow
-13.2%
Cash-on-Cash Return
3.1%
Cap rate
0.5%
Rent to Value Ratio
Active
$1,790,000
5
bds
|
5
ba
|
10,693
sqft
|
built
1980
9001 N Range Line Rd, River Hills, WI 53217
$-8,867
Cash flow
-25.8%
Cash-on-Cash Return
0.2%
Cap rate
0.2%
Rent to Value Ratio
Active
$474,900
5
bds
|
2
ba
|
2,512
sqft
|
built
1960
800 Emerson Ave, South Milwaukee, WI 53172
$-1,357
Cash flow
-14.9%
Cash-on-Cash Return
2.7%
Cap rate
0.5%
Rent to Value Ratio
Active
$162,500
2
bds
|
1.5
ba
|
1,057
sqft
|
built
1940
4429 N 56th St, Milwaukee, WI 53218
$-185
Cash flow
-5.9%
Cash-on-Cash Return
4.8%
Cap rate
0.8%
Rent to Value Ratio
Active
$129,900
4
bds
|
1
ba
|
1,981
sqft
|
built
1924
3918 N 24th St, Milwaukee, WI 53206
$-108
Cash flow
-4.3%
Cash-on-Cash Return
5.1%
Cap rate
0.8%
Rent to Value Ratio
Active
$299,000
1
bds
|
1
ba
|
678
sqft
|
built
2006
106 W Seeboth St, Milwaukee, WI 53204
$-1,456
Cash flow
-25.4%
Cash-on-Cash Return
0.3%
Cap rate
0.5%
Rent to Value Ratio
Active
$119,000
3
bds
|
1
ba
|
1,270
sqft
|
built
1893
3124 N 29th St, Milwaukee, WI 53216
$29
Cash flow
1.3%
Cash-on-Cash Return
6.4%
Cap rate
0.9%
Rent to Value Ratio
Active
$90,000
3
bds
|
1
ba
|
892
sqft
|
built
1924
4715 N 39th St, Milwaukee, WI 53209
$222
Cash flow
12.9%
Cash-on-Cash Return
9.1%
Cap rate
1.3%
Rent to Value Ratio
Active
$130,000
2
bds
|
1
ba
|
1,110
sqft
|
built
1925
3843 N 25th St, Milwaukee, WI 53206
$108
Cash flow
4.3%
Cash-on-Cash Return
7.1%
Cap rate
1.0%
Rent to Value Ratio
Active
$549,900
3
bds
|
2
ba
|
2,156
sqft
|
built
1970
4700 W Hunting Park Dr, Franklin, WI 53132
$-1,172
Cash flow
-11.1%
Cash-on-Cash Return
3.6%
Cap rate
0.6%
Rent to Value Ratio
Active
$285,000
3
bds
|
2
ba
|
1,255
sqft
|
built
1967
1707 N Prospect Ave, Milwaukee, WI 53202
$-1,522
Cash flow
-27.9%
Cash-on-Cash Return
-0.3%
Cap rate
0.6%
Rent to Value Ratio
Active
$249,900
2
bds
|
0
ba
|
1,226
sqft
|
built
1981
10340 W Parkwood Dr, Franklin, WI 53132
$-306
Cash flow
-6.4%
Cash-on-Cash Return
4.7%
Cap rate
0.7%
Rent to Value Ratio
Active
$164,900
4
bds
|
1
ba
|
2,250
sqft
|
built
1926
2878 N 57th St, Milwaukee, WI 53210
$-359
Cash flow
-11.4%
Cash-on-Cash Return
3.5%
Cap rate
0.7%
Rent to Value Ratio
Active
$169,900
4
bds
|
2
ba
|
1,350
sqft
|
built
1926
4025 W Fairmount Ave, Milwaukee, WI 53209
$-275
Cash flow
-8.4%
Cash-on-Cash Return
4.2%
Cap rate
0.6%
Rent to Value Ratio
Active
$169,900
4
bds
|
1
ba
|
2,288
sqft
|
built
1930
3507 N 40th St, Milwaukee, WI 53216
$-331
Cash flow
-10.2%
Cash-on-Cash Return
3.8%
Cap rate
0.6%
Rent to Value Ratio
Active
$299,000
2
bds
|
1
ba
|
847
sqft
|
built
1938
4544 S Quincy Ave, Milwaukee, WI 53207
$-945
Cash flow
-16.5%
Cash-on-Cash Return
2.4%
Cap rate
0.4%
Rent to Value Ratio
Active
$95,000
6
bds
|
1
ba
|
2,619
sqft
|
built
1908
3912 W Cherry St, Milwaukee, WI 53208
$160
Cash flow
8.8%
Cash-on-Cash Return
8.2%
Cap rate
1.2%
Rent to Value Ratio