Milwaukee County Investment Properties for Sale
Browse homes for sale and investment properties in Milwaukee County. Refine your search by price, property type, or more.
Best cash flowing properties in Milwaukee County
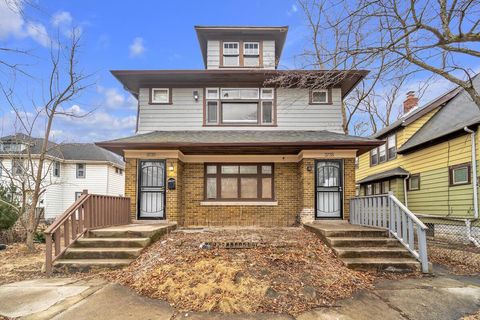
Active
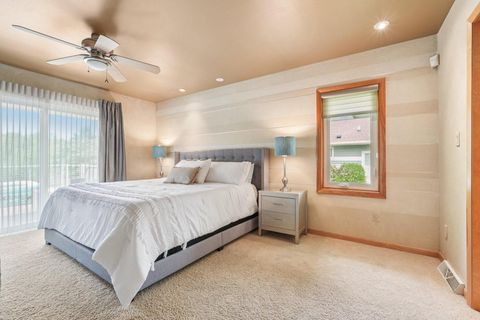
$145,000
bds
|
0
ba
|
0
sqft
|
built
1904
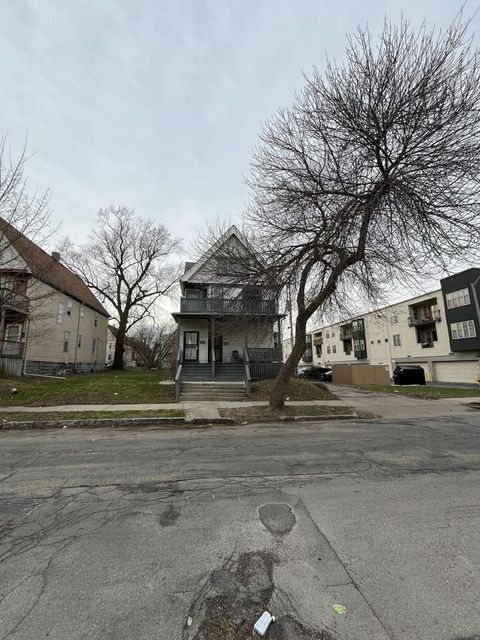
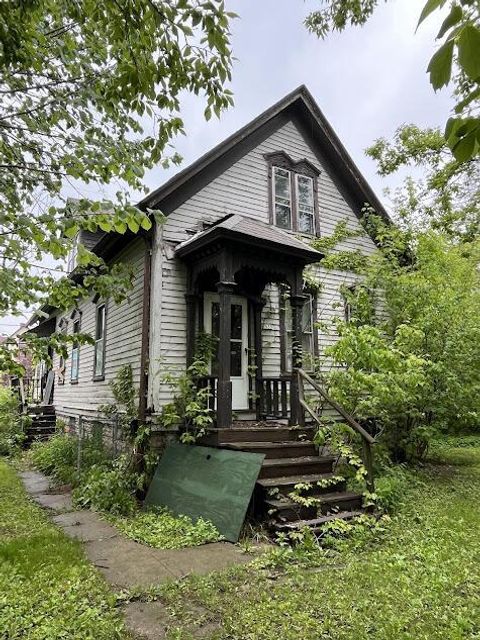
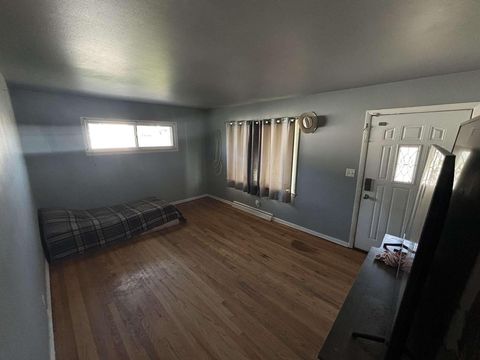
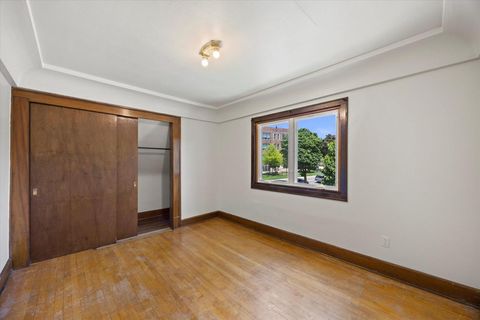
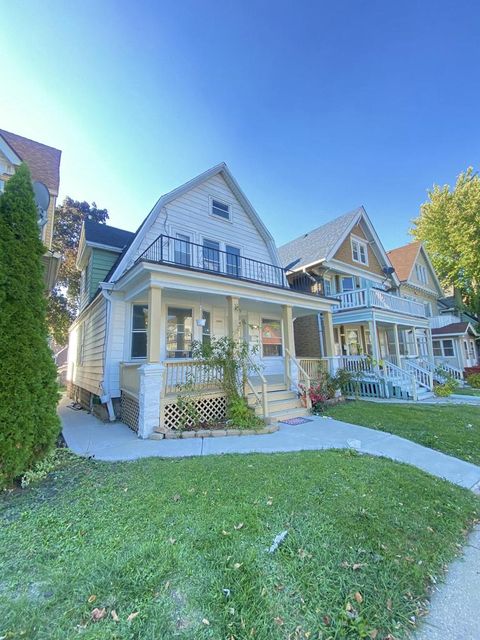
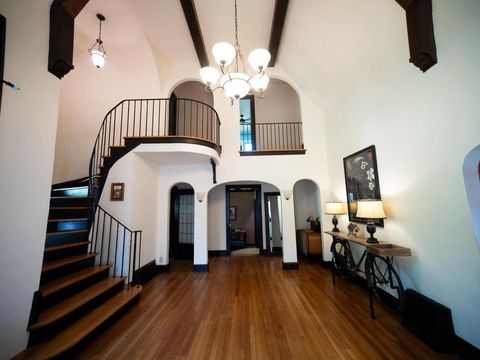
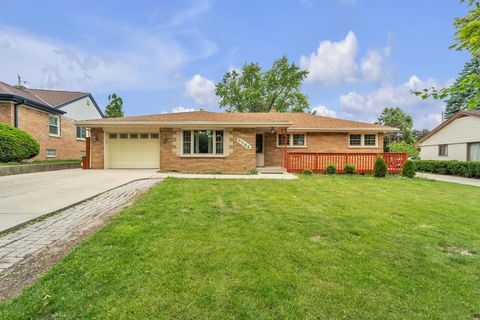
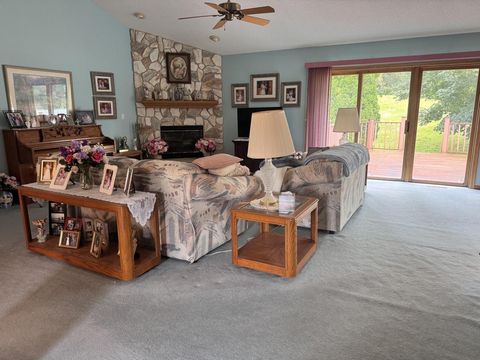
2237 N 33rd St, Milwaukee, WI 53208
$59
Cash flow
2.1%
Cash-on-Cash Return
6.6%
Cap rate
1.0%
Rent to Value Ratio
Active
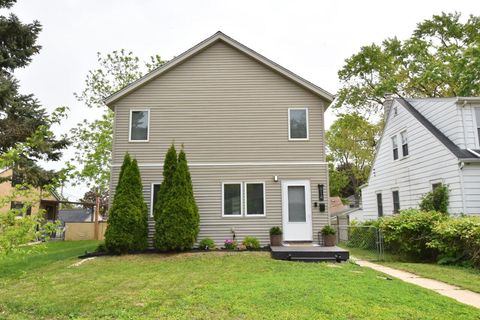
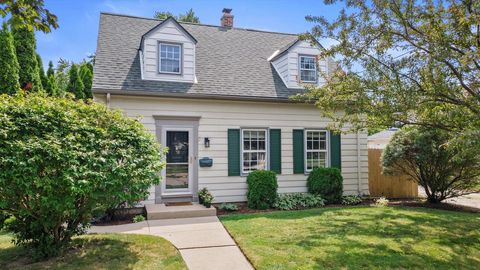
$107,900
3
bds
|
1
ba
|
1,418
sqft
|
built
1885
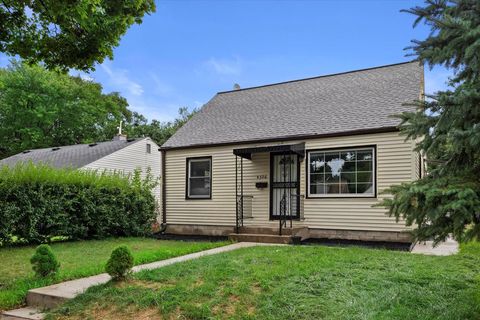
2635 N 6th St, Milwaukee, WI 53212
$-53
Cash flow
-2.6%
Cash-on-Cash Return
5.6%
Cap rate
0.8%
Rent to Value Ratio
512 out of 660 properties for sale in Milwaukee County
Limited Results Shown
Create a free account, or log in to reveal all property listings and enjoy the complete experience.
Active
$215,000
3
bds
|
0
ba
|
918
sqft
|
built
1958
8210 W Winfield Ave, Milwaukee, WI 53218
$-476
Cash flow
-11.6%
Cash-on-Cash Return
3.5%
Cap rate
0.7%
Rent to Value Ratio
Active
$259,900
2
bds
|
1
ba
|
934
sqft
|
built
1926
3265 S Swain Ct, Milwaukee, WI 53207
$-602
Cash flow
-12.1%
Cash-on-Cash Return
3.4%
Cap rate
0.6%
Rent to Value Ratio
Active
$619,900
3
bds
|
2
ba
|
2,104
sqft
|
built
1998
3426 W Links Dr, Franklin, WI 53132
$-1,752
Cash flow
-14.7%
Cash-on-Cash Return
2.8%
Cap rate
0.5%
Rent to Value Ratio
Active
$342,000
3
bds
|
2
ba
|
1,549
sqft
|
built
1948
814 S 114th St, West Allis, WI 53214
$-793
Cash flow
-12.1%
Cash-on-Cash Return
3.4%
Cap rate
0.6%
Rent to Value Ratio
Active
$259,995
3
bds
|
2
ba
|
1,219
sqft
|
built
1979
9073 N Joyce Ave, Milwaukee, WI 53224
$-614
Cash flow
-12.3%
Cash-on-Cash Return
3.3%
Cap rate
0.7%
Rent to Value Ratio
Active
$399,900
bds
|
0
ba
|
0
sqft
|
built
1947
3910 N Sherman Blvd, Milwaukee, WI 53216
$-1,653
Cash flow
-21.6%
Cash-on-Cash Return
1.2%
Cap rate
0.4%
Rent to Value Ratio
Active
$89,000
1
bds
|
1
ba
|
625
sqft
|
built
1971
11926 W Mill Rd, Milwaukee, WI 53225
$-464
Cash flow
-27.2%
Cash-on-Cash Return
-0.1%
Cap rate
0.9%
Rent to Value Ratio
Active
$298,000
6
bds
|
2
ba
|
2,719
sqft
|
built
1928
3402 N 51st Blvd, Milwaukee, WI 53216
$-887
Cash flow
-15.5%
Cash-on-Cash Return
2.6%
Cap rate
0.5%
Rent to Value Ratio
Active
$299,900
4
bds
|
2
ba
|
1,120
sqft
|
built
1926
203 N 71st St, Milwaukee, WI 53213
$-837
Cash flow
-14.6%
Cash-on-Cash Return
2.8%
Cap rate
0.5%
Rent to Value Ratio
Active
$309,900
3
bds
|
3
ba
|
1,026
sqft
|
built
1928
2202 S 67th Pl, West Allis, WI 53219
$-763
Cash flow
-12.8%
Cash-on-Cash Return
3.2%
Cap rate
0.5%
Rent to Value Ratio
Active
$233,000
4
bds
|
1
ba
|
1,573
sqft
|
built
1907
1009 S 35th St, Milwaukee, WI 53215
$-298
Cash flow
-6.7%
Cash-on-Cash Return
4.6%
Cap rate
0.7%
Rent to Value Ratio
Active
$329,000
2
bds
|
2
ba
|
1,635
sqft
|
built
1948
1625 W Green Tree Rd, Glendale, WI 53209
$-914
Cash flow
-14.5%
Cash-on-Cash Return
2.8%
Cap rate
0.6%
Rent to Value Ratio
Active
$139,900
1
bds
|
1
ba
|
750
sqft
|
built
1972
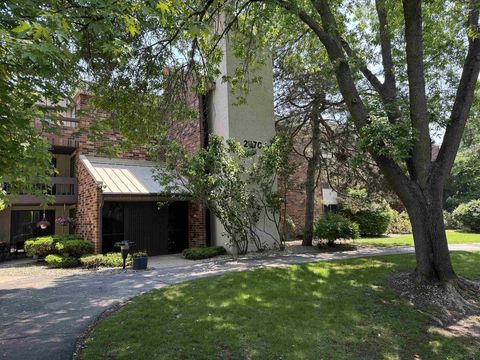
2470 W Good Hope Rd, Glendale, WI 53209
$-420
Cash flow
-15.7%
Cash-on-Cash Return
2.5%
Cap rate
0.9%
Rent to Value Ratio
Active
$865,000
4
bds
|
3
ba
|
3,400
sqft
|
built
1922
8408 N Lake Dr, Fox Point, WI 53217
$-2,526
Cash flow
-15.2%
Cash-on-Cash Return
2.6%
Cap rate
0.6%
Rent to Value Ratio
Active
$185,000
4
bds
|
0
ba
|
2,288
sqft
|
built
1926
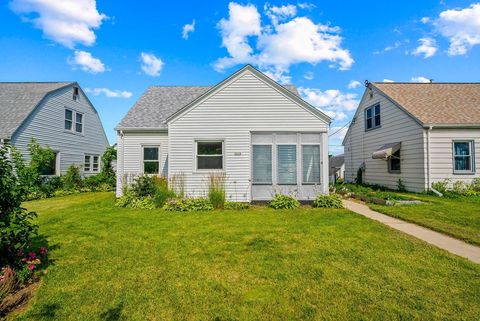
3733 W Sarnow St, Milwaukee, WI 53208
$-314
Cash flow
-8.9%
Cash-on-Cash Return
4.1%
Cap rate
0.6%
Rent to Value Ratio
Active
$419,900
3
bds
|
1
ba
|
1,762
sqft
|
built
1981
7046 Evans Dr, Franklin, WI 53132
$-1,223
Cash flow
-15.2%
Cash-on-Cash Return
2.7%
Cap rate
0.5%
Rent to Value Ratio
Active
$1,395,000
6
bds
|
4
ba
|
7,044
sqft
|
built
1970
2305 W County Line Rd, River Hills, WI 53217
$-7,532
Cash flow
-28.2%
Cash-on-Cash Return
-0.3%
Cap rate
0.2%
Rent to Value Ratio
Active
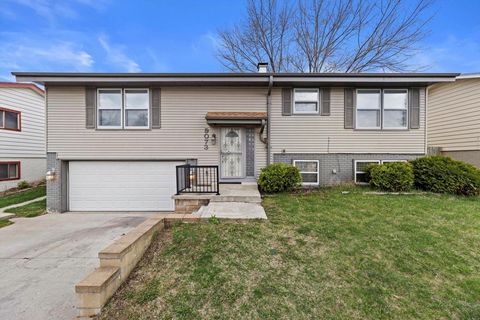
$164,999
2
bds
|
0
ba
|
925
sqft
|
built
1957
4300 N 73rd St, Milwaukee, WI 53216
$-217
Cash flow
-6.9%
Cash-on-Cash Return
4.6%
Cap rate
0.8%
Rent to Value Ratio
Active
$669,000
3
bds
|
2
ba
|
2,024
sqft
|
built
1931
2544 N 91st St, Wauwatosa, WI 53226
$-1,576
Cash flow
-12.3%
Cash-on-Cash Return
3.3%
Cap rate
0.6%
Rent to Value Ratio
Active
$319,900
1
bds
|
1
ba
|
858
sqft
|
built
2007
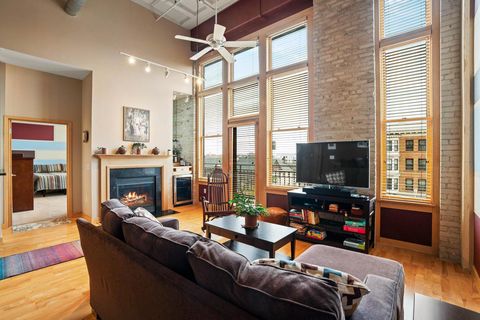
106 W Seeboth St, Milwaukee, WI 53204
$-1,675
Cash flow
-27.3%
Cash-on-Cash Return
-0.1%
Cap rate
0.5%
Rent to Value Ratio
Active
$274,900
3
bds
|
1
ba
|
1,239
sqft
|
built
1948
3218 S Chase Ave, Milwaukee, WI 53207
$-389
Cash flow
-7.4%
Cash-on-Cash Return
4.4%
Cap rate
0.7%
Rent to Value Ratio

Active
$600,000
2
bds
|
2
ba
|
1,612
sqft
|
built
2012
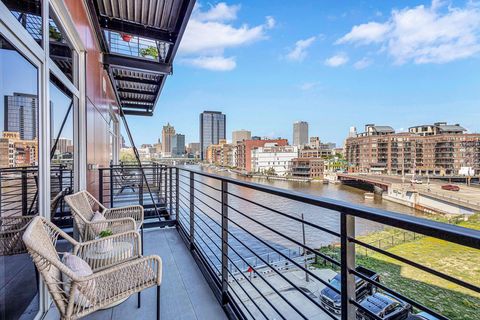
1141 N Old World 3rd St, Milwaukee, WI 53203
$-3,247
Cash flow
-28.2%
Cash-on-Cash Return
-0.3%
Cap rate
0.4%
Rent to Value Ratio
Active
$250,000
1
bds
|
1
ba
|
733
sqft
|
built
1990
1660 N Prospect Ave, Milwaukee, WI 53202
$-964
Cash flow
-20.1%
Cash-on-Cash Return
1.5%
Cap rate
0.6%
Rent to Value Ratio
Active
$397,000
3
bds
|
1
ba
|
2,175
sqft
|
built
1958
5542 W Jerelyn Pl, Milwaukee, WI 53219
$-919
Cash flow
-12.1%
Cash-on-Cash Return
3.4%
Cap rate
0.6%
Rent to Value Ratio
Active
$224,900
4
bds
|
2
ba
|
1,396
sqft
|
built
1951
4326 N 51st Blvd, Milwaukee, WI 53216
$-440
Cash flow
-10.2%
Cash-on-Cash Return
3.8%
Cap rate
0.6%
Rent to Value Ratio
Active
$475,000
2
bds
|
2
ba
|
1,329
sqft
|
built
1922
1325 N Van Buren St, Milwaukee, WI 53202
$-2,353
Cash flow
-25.8%
Cash-on-Cash Return
0.2%
Cap rate
0.4%
Rent to Value Ratio
Active
$169,420
4
bds
|
1
ba
|
2,016
sqft
|
built
1920
3151 N 41st St, Milwaukee, WI 53216
$-363
Cash flow
-11.2%
Cash-on-Cash Return
3.6%
Cap rate
0.6%
Rent to Value Ratio
Active
$550,000
3
bds
|
3
ba
|
4,000
sqft
|
built
1997
6764 S Yale Dr, Franklin, WI 53132
$-1,659
Cash flow
-15.7%
Cash-on-Cash Return
2.5%
Cap rate
0.5%
Rent to Value Ratio
Active
$284,900
2
bds
|
1
ba
|
1,726
sqft
|
built
1942
3621 E Van Norman Ave, Cudahy, WI 53110
$-460
Cash flow
-8.4%
Cash-on-Cash Return
4.2%
Cap rate
0.7%
Rent to Value Ratio
Active
$459,900
3
bds
|
2
ba
|
2,105
sqft
|
built
2000
10384 S Katie Dr, Oak Creek, WI 53154
$-1,786
Cash flow
-20.3%
Cash-on-Cash Return
1.5%
Cap rate
0.3%
Rent to Value Ratio
Active
$1,149,000
4
bds
|
3.5
ba
|
5,308
sqft
|
built
1929
10737 W Rawson Ave, Franklin, WI 53132
$-4,535
Cash flow
-20.6%
Cash-on-Cash Return
1.4%
Cap rate
0.3%
Rent to Value Ratio
Active
$223,900
4
bds
|
1.5
ba
|
1,692
sqft
|
built
1924
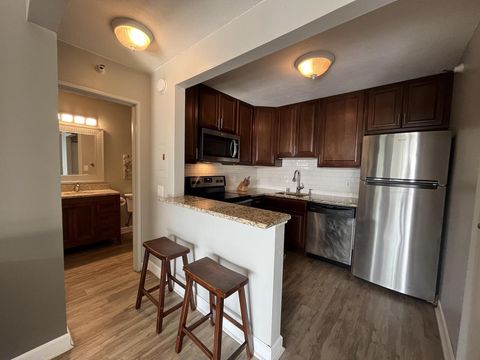
2432 N 55th St, Milwaukee, WI 53210
$-326
Cash flow
-7.6%
Cash-on-Cash Return
4.4%
Cap rate
0.8%
Rent to Value Ratio
Active
$195,000
4
bds
|
1
ba
|
1,540
sqft
|
built
1890
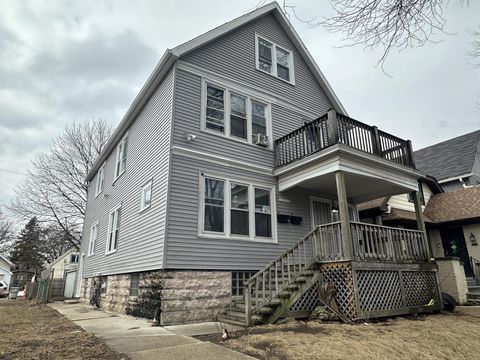
830 N 23rd St, Milwaukee, WI 53233
$-484
Cash flow
-12.9%
Cash-on-Cash Return
3.2%
Cap rate
0.7%
Rent to Value Ratio
Active
$319,900
3
bds
|
1
ba
|
1,626
sqft
|
built
1954
5236 W Cleveland Ave, Milwaukee, WI 53219
$-871
Cash flow
-14.2%
Cash-on-Cash Return
2.9%
Cap rate
0.5%
Rent to Value Ratio
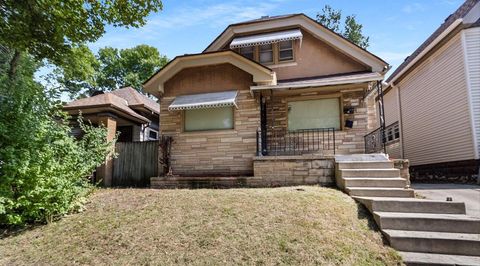
Active
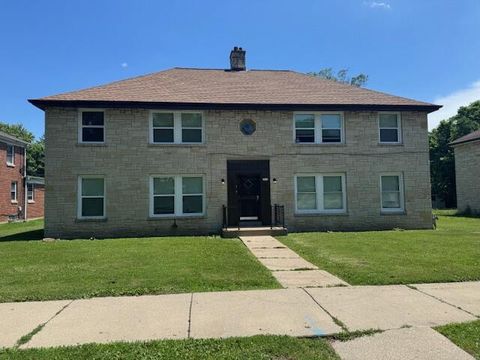
$124,900
4
bds
|
1
ba
|
1,663
sqft
|
built
1900
2322 S 15th Pl, Milwaukee, WI 53215
$-195
Cash flow
-8.1%
Cash-on-Cash Return
4.3%
Cap rate
0.7%
Rent to Value Ratio
Active
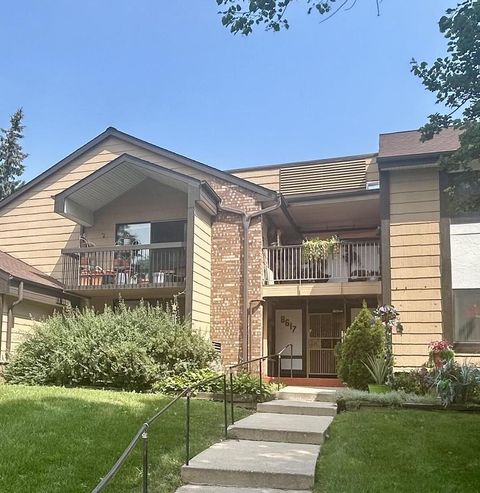
$78,500
2
bds
|
1
ba
|
914
sqft
|
built
1974
8617 N Servite Dr, Milwaukee, WI 53223
$-299
Cash flow
-19.9%
Cash-on-Cash Return
1.6%
Cap rate
1.4%
Rent to Value Ratio
Active
$133,900
4
bds
|
1
ba
|
1,995
sqft
|
built
1926
3172 N 30th St, Milwaukee, WI 53216
$-195
Cash flow
-7.6%
Cash-on-Cash Return
4.4%
Cap rate
0.6%
Rent to Value Ratio
Active
$950,000
2
bds
|
2
ba
|
1,731
sqft
|
built
2004
541 E Erie St, Milwaukee, WI 53202
$-4,344
Cash flow
-23.9%
Cash-on-Cash Return
0.7%
Cap rate
0.3%
Rent to Value Ratio