Milwaukee County Investment Properties for Sale
Browse homes for sale and investment properties in Milwaukee County. Refine your search by price, property type, or more.
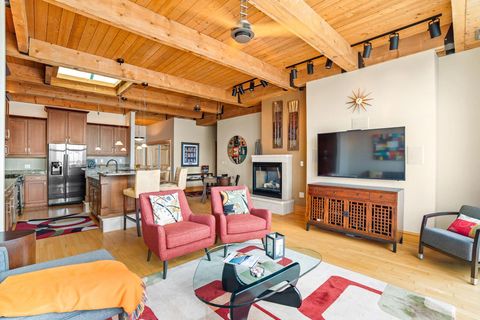
Best cash flowing properties in Milwaukee County
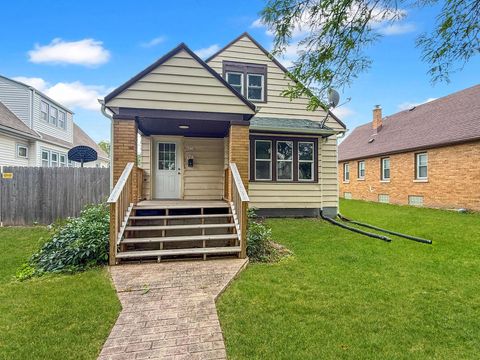
Active
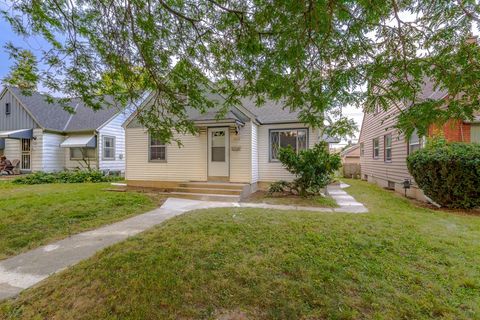
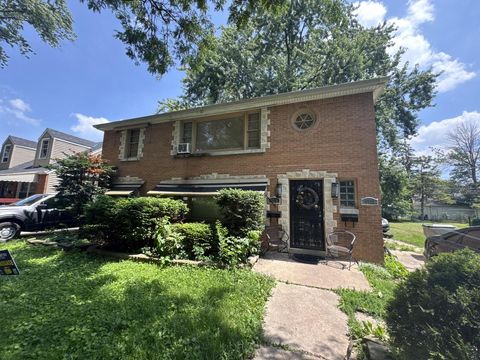
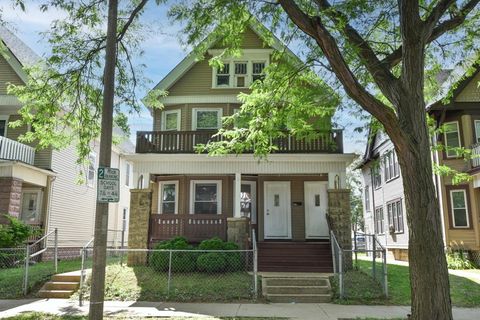
$156,000
4
bds
|
1
ba
|
1,909
sqft
|
built
1903
2009 N 37th St, Milwaukee, WI 53208
$387
Cash flow
12.9%
Cash-on-Cash Return
9.1%
Cap rate
1.3%
Rent to Value Ratio
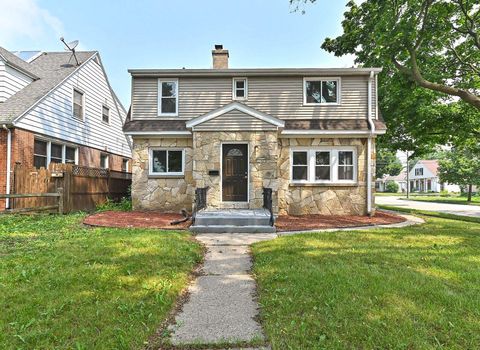
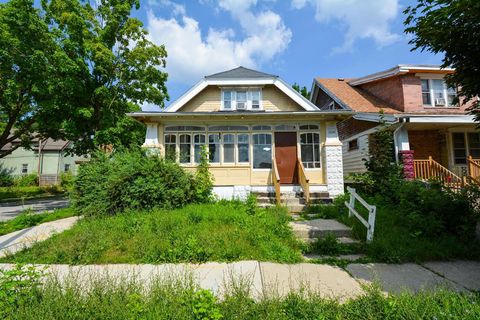
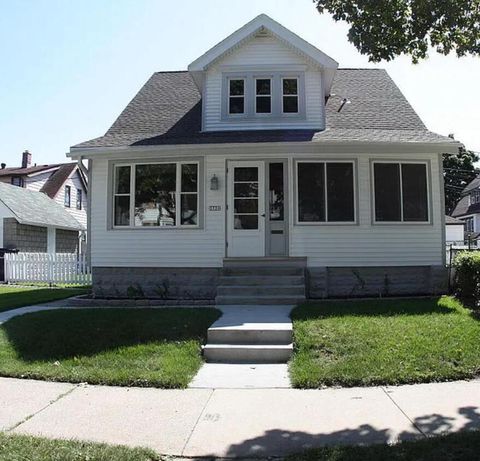
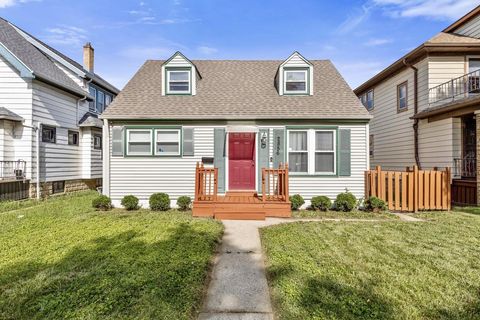
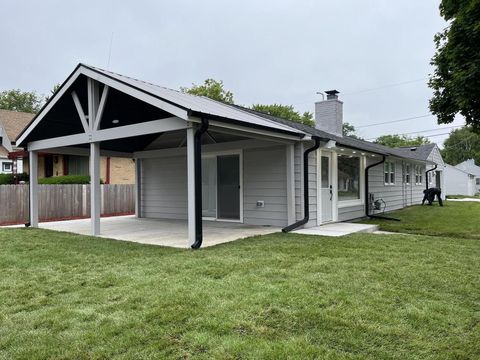
Active
$85,000
4
bds
|
2
ba
|
1,888
sqft
|
built
1888
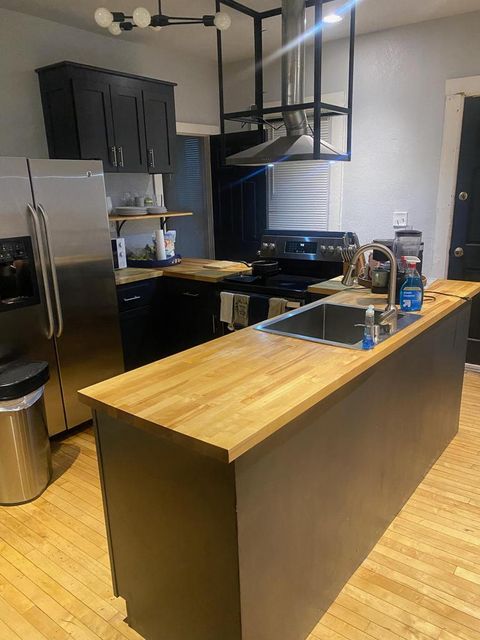
1444 N 29th St, Milwaukee, WI 53208
$341
Cash flow
20.9%
Cash-on-Cash Return
11.0%
Cap rate
1.5%
Rent to Value Ratio
594 out of 743 properties for sale in Milwaukee County
Limited Results Shown
Create a free account, or log in to reveal all property listings and enjoy the complete experience.
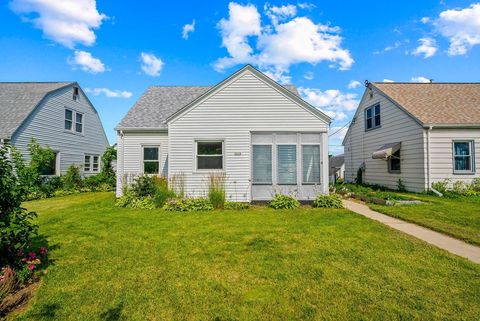
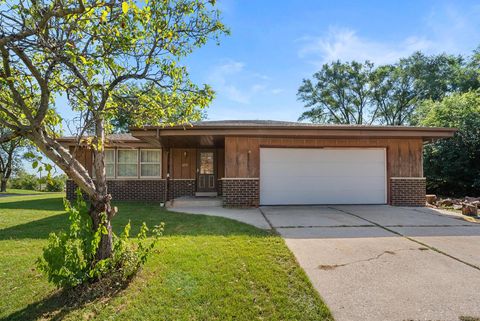
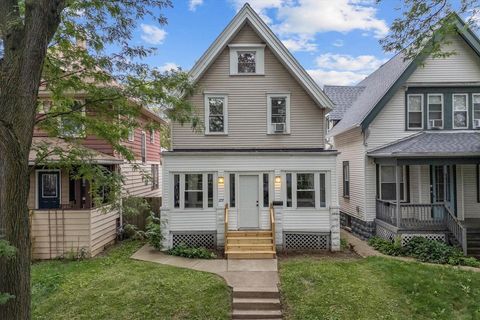
Active
$669,000
3
bds
|
2
ba
|
2,024
sqft
|
built
1931
2544 N 91st St, Wauwatosa, WI 53226
$-1,576
Cash flow
-12.3%
Cash-on-Cash Return
3.3%
Cap rate
0.6%
Rent to Value Ratio
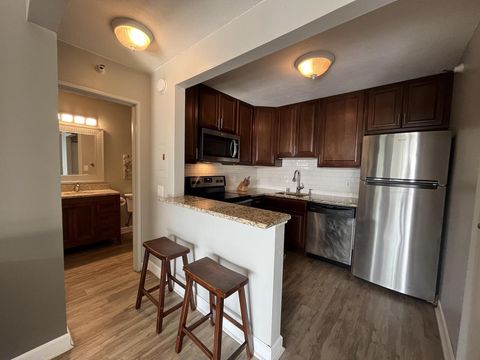
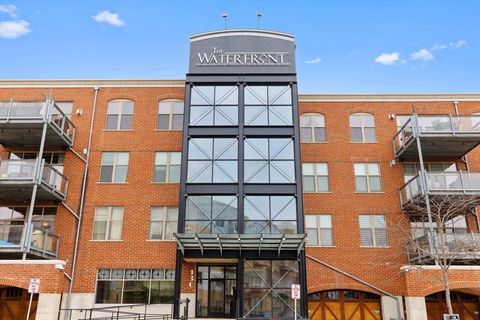
Active
$319,900
1
bds
|
1
ba
|
858
sqft
|
built
2007
106 W Seeboth St, Milwaukee, WI 53204
$-1,675
Cash flow
-27.3%
Cash-on-Cash Return
-0.1%
Cap rate
0.5%
Rent to Value Ratio
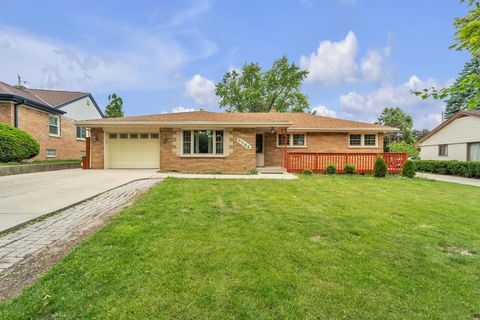
Active
$274,900
3
bds
|
1
ba
|
1,239
sqft
|
built
1948
3218 S Chase Ave, Milwaukee, WI 53207
$-389
Cash flow
-7.4%
Cash-on-Cash Return
4.4%
Cap rate
0.7%
Rent to Value Ratio

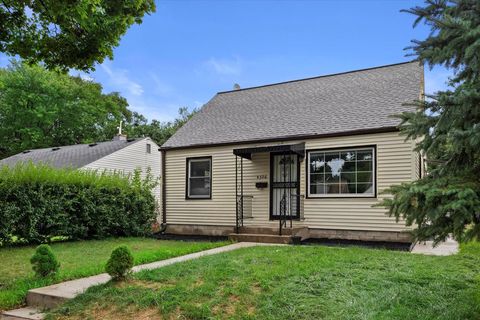
Active
$600,000
2
bds
|
2
ba
|
1,612
sqft
|
built
2012
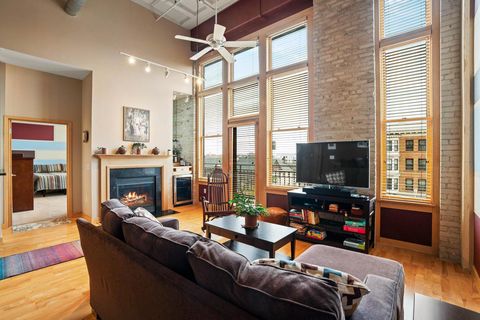
1141 N Old World 3rd St, Milwaukee, WI 53203
$-3,247
Cash flow
-28.2%
Cash-on-Cash Return
-0.3%
Cap rate
0.4%
Rent to Value Ratio
Active
$250,000
1
bds
|
1
ba
|
733
sqft
|
built
1990
1660 N Prospect Ave, Milwaukee, WI 53202
$-964
Cash flow
-20.1%
Cash-on-Cash Return
1.5%
Cap rate
0.6%
Rent to Value Ratio
Active
$397,000
3
bds
|
1
ba
|
2,175
sqft
|
built
1958
5542 W Jerelyn Pl, Milwaukee, WI 53219
$-919
Cash flow
-12.1%
Cash-on-Cash Return
3.4%
Cap rate
0.6%
Rent to Value Ratio
Active
$224,900
4
bds
|
2
ba
|
1,396
sqft
|
built
1951
4326 N 51st Blvd, Milwaukee, WI 53216
$-440
Cash flow
-10.2%
Cash-on-Cash Return
3.8%
Cap rate
0.6%
Rent to Value Ratio
Active
$475,000
2
bds
|
2
ba
|
1,329
sqft
|
built
1922
1325 N Van Buren St, Milwaukee, WI 53202
$-2,353
Cash flow
-25.8%
Cash-on-Cash Return
0.2%
Cap rate
0.4%
Rent to Value Ratio
Active
$169,420
4
bds
|
1
ba
|
2,016
sqft
|
built
1920
3151 N 41st St, Milwaukee, WI 53216
$-363
Cash flow
-11.2%
Cash-on-Cash Return
3.6%
Cap rate
0.6%
Rent to Value Ratio
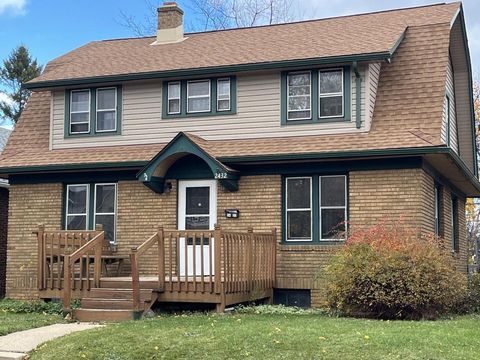
Active
$223,900
4
bds
|
1.5
ba
|
1,692
sqft
|
built
1924
2432 N 55th St, Milwaukee, WI 53210
$-326
Cash flow
-7.6%
Cash-on-Cash Return
4.4%
Cap rate
0.8%
Rent to Value Ratio
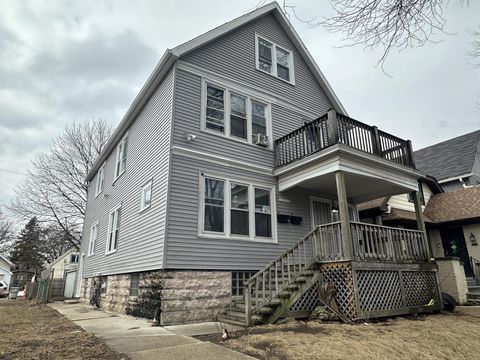
Active
$195,000
4
bds
|
1
ba
|
1,540
sqft
|
built
1890
830 N 23rd St, Milwaukee, WI 53233
$-484
Cash flow
-12.9%
Cash-on-Cash Return
3.2%
Cap rate
0.7%
Rent to Value Ratio
Active
$319,900
3
bds
|
1
ba
|
1,626
sqft
|
built
1954
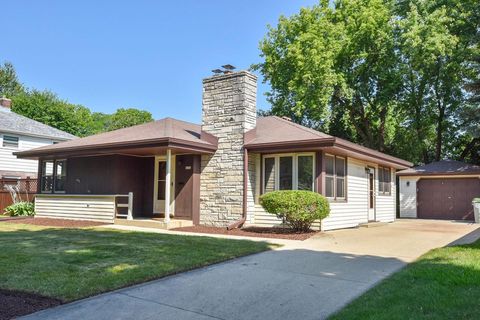
5236 W Cleveland Ave, Milwaukee, WI 53219
$-871
Cash flow
-14.2%
Cash-on-Cash Return
2.9%
Cap rate
0.5%
Rent to Value Ratio
Active
$124,900
4
bds
|
1
ba
|
1,663
sqft
|
built
1900
2322 S 15th Pl, Milwaukee, WI 53215
$-195
Cash flow
-8.1%
Cash-on-Cash Return
4.3%
Cap rate
0.7%
Rent to Value Ratio
Active
$78,500
2
bds
|
1
ba
|
914
sqft
|
built
1974
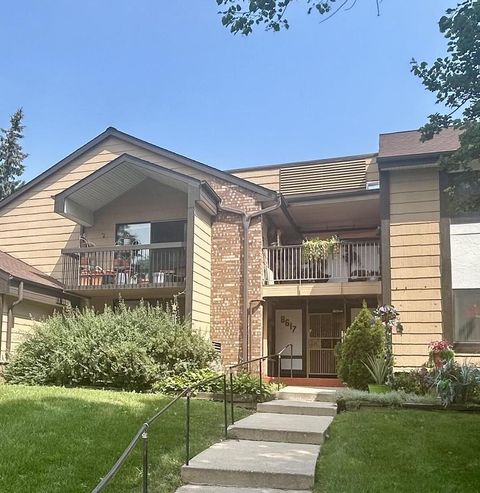
8617 N Servite Dr, Milwaukee, WI 53223
$-299
Cash flow
-19.9%
Cash-on-Cash Return
1.6%
Cap rate
1.4%
Rent to Value Ratio
Active
$133,900
4
bds
|
1
ba
|
1,995
sqft
|
built
1926
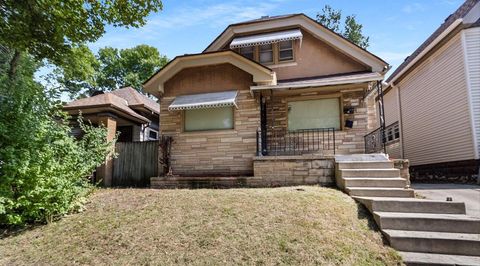
3172 N 30th St, Milwaukee, WI 53216
$-195
Cash flow
-7.6%
Cash-on-Cash Return
4.4%
Cap rate
0.6%
Rent to Value Ratio
Active
$950,000
2
bds
|
2
ba
|
1,731
sqft
|
built
2004
541 E Erie St, Milwaukee, WI 53202
$-4,344
Cash flow
-23.9%
Cash-on-Cash Return
0.7%
Cap rate
0.3%
Rent to Value Ratio
Active
$349,900
5
bds
|
2
ba
|
2,053
sqft
|
built
1950
7702 W Keefe Ave, Milwaukee, WI 53222
$-1,229
Cash flow
-18.3%
Cash-on-Cash Return
1.9%
Cap rate
0.4%
Rent to Value Ratio
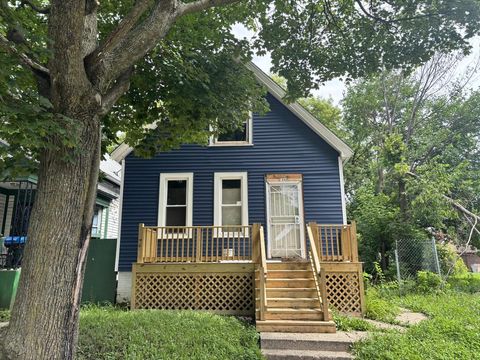
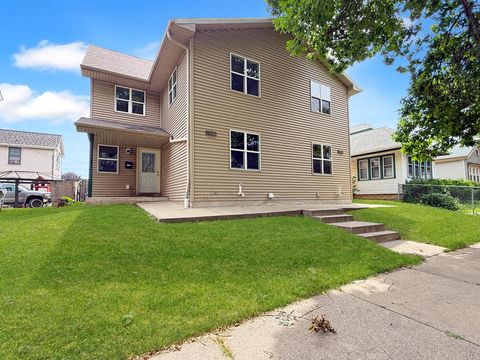
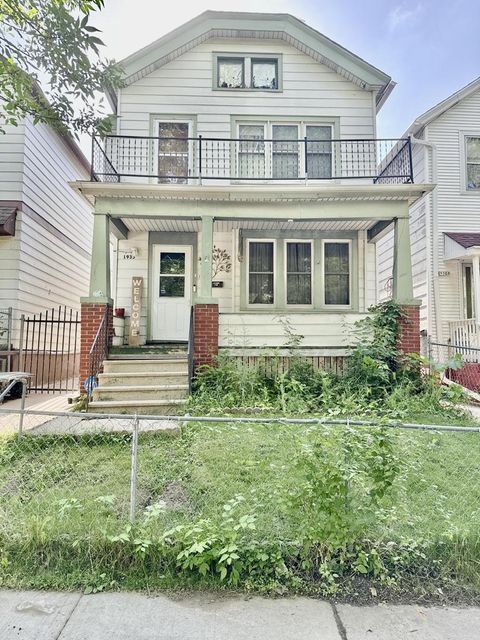
Active
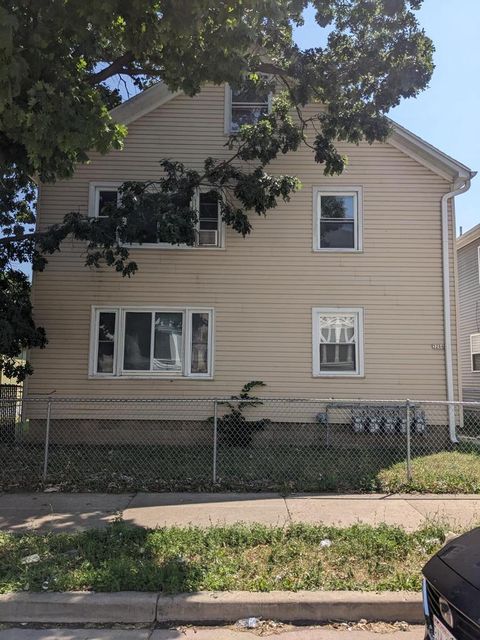
$125,000
4
bds
|
1
ba
|
1,156
sqft
|
built
1886
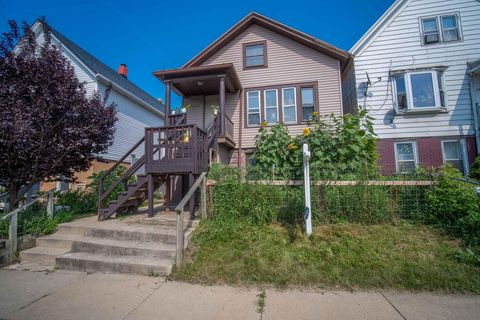
1440 N 29th St, Milwaukee, WI 53208
$101
Cash flow
4.2%
Cash-on-Cash Return
7.1%
Cap rate
1.0%
Rent to Value Ratio
Active
$115,000
4
bds
|
1
ba
|
1,978
sqft
|
built
1926
3551 N 13th St, Milwaukee, WI 53206
$-466
Cash flow
-21.1%
Cash-on-Cash Return
1.3%
Cap rate
0.9%
Rent to Value Ratio
Active
$190,000
3
bds
|
1
ba
|
1,180
sqft
|
built
1947
6314 W Medford Ave, Milwaukee, WI 53218
$-182
Cash flow
-5.0%
Cash-on-Cash Return
5.0%
Cap rate
0.8%
Rent to Value Ratio
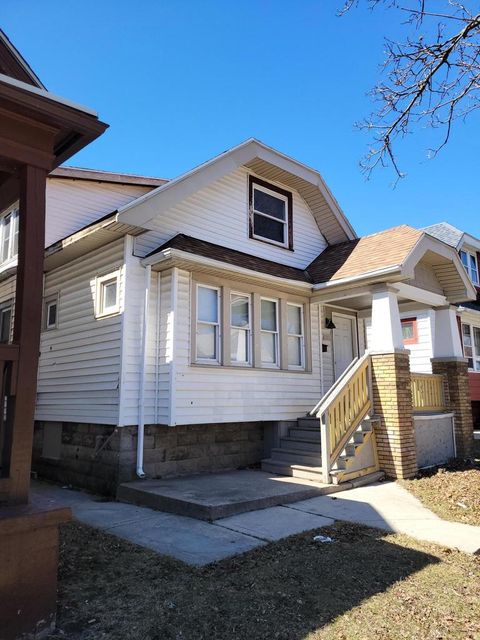
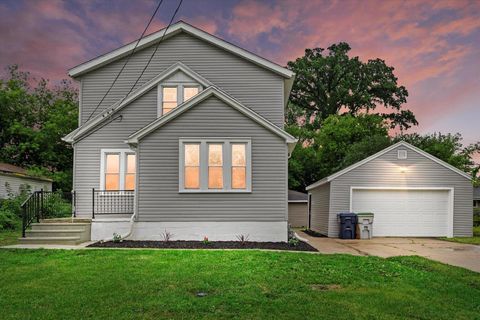
Active
$106,900
4
bds
|
1
ba
|
1,488
sqft
|
built
1916
3544 N 23rd St, Milwaukee, WI 53206
$261
Cash flow
12.7%
Cash-on-Cash Return
9.1%
Cap rate
1.3%
Rent to Value Ratio
Active
$524,900
8
bds
|
1.5
ba
|
2,800
sqft
|
built
2005
1310 S 7th St, Milwaukee, WI 53204
$-2,076
Cash flow
-20.6%
Cash-on-Cash Return
1.4%
Cap rate
0.3%
Rent to Value Ratio
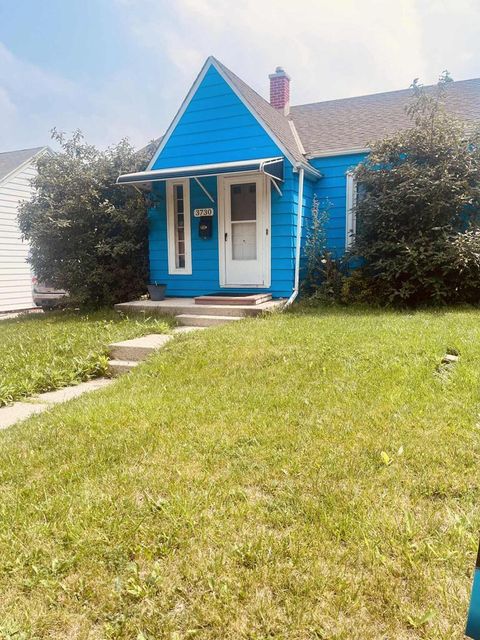
Active
$240,000
3
bds
|
1
ba
|
1,090
sqft
|
built
1949
3730 S 5th Pl, Milwaukee, WI 53207
$-471
Cash flow
-10.2%
Cash-on-Cash Return
3.8%
Cap rate
0.7%
Rent to Value Ratio
Active
$214,900
2
bds
|
1
ba
|
903
sqft
|
built
1929
4672 N 40th St, Milwaukee, WI 53209
$-500
Cash flow
-12.1%
Cash-on-Cash Return
3.4%
Cap rate
0.5%
Rent to Value Ratio
Active
$249,900
3
bds
|
3
ba
|
2,483
sqft
|
built
1916
3731 W Dorothy Pl, Milwaukee, WI 53215
$-469
Cash flow
-9.8%
Cash-on-Cash Return
3.9%
Cap rate
0.7%
Rent to Value Ratio
Active
$319,000
3
bds
|
1
ba
|
1,618
sqft
|
built
1979
6172 N 116th St, Milwaukee, WI 53225
$-716
Cash flow
-11.7%
Cash-on-Cash Return
3.5%
Cap rate
0.6%
Rent to Value Ratio
Active
$260,000
bds
|
0
ba
|
0
sqft
|
built
1920
3266 N 3rd St, Milwaukee, WI 53212
$-1,107
Cash flow
-22.2%
Cash-on-Cash Return
1.0%
Cap rate
0.3%
Rent to Value Ratio
Active
$189,900
4
bds
|
1
ba
|
2,210
sqft
|
built
1956
4722 N 44th St, Milwaukee, WI 53218
$-431
Cash flow
-11.8%
Cash-on-Cash Return
3.4%
Cap rate
0.6%
Rent to Value Ratio
Active
$210,000
3
bds
|
1
ba
|
1,128
sqft
|
built
1950
2856 N 54th St, Milwaukee, WI 53210
$-424
Cash flow
-10.5%
Cash-on-Cash Return
3.7%
Cap rate
0.7%
Rent to Value Ratio
Active
$165,000
3
bds
|
2
ba
|
1,290
sqft
|
built
1884
1935 S 10th St, Milwaukee, WI 53204
$-384
Cash flow
-12.1%
Cash-on-Cash Return
3.4%
Cap rate
0.5%
Rent to Value Ratio
Active
$289,900
4
bds
|
2
ba
|
1,468
sqft
|
built
1935
4512 W Green Tree Rd, Milwaukee, WI 53223
$-1,092
Cash flow
-19.7%
Cash-on-Cash Return
1.6%
Cap rate
0.3%
Rent to Value Ratio
Active
$175,000
6
bds
|
1
ba
|
2,423
sqft
|
built
1914
2437 N 45th St, Milwaukee, WI 53210
$-284
Cash flow
-8.5%
Cash-on-Cash Return
4.2%
Cap rate
0.7%
Rent to Value Ratio
Active
$335,000
3
bds
|
1
ba
|
1,353
sqft
|
built
1949
3730 W Kaul Ave, Milwaukee, WI 53209
$-1,029
Cash flow
-16.0%
Cash-on-Cash Return
2.5%
Cap rate
0.4%
Rent to Value Ratio
Active
$525,000
1
bds
|
1
ba
|
1,140
sqft
|
built
2003
130 S Water St, Milwaukee, WI 53204
$-2,673
Cash flow
-26.6%
Cash-on-Cash Return
0.0%
Cap rate
0.4%
Rent to Value Ratio
Active
$235,000
4
bds
|
1
ba
|
1,392
sqft
|
built
1909
1257 S 36th St, Milwaukee, WI 53215
$-438
Cash flow
-9.7%
Cash-on-Cash Return
3.9%
Cap rate
0.7%
Rent to Value Ratio

Active
$139,900
4
bds
|
1
ba
|
1,130
sqft
|
built
1895
2607 N 24th St, Milwaukee, WI 53206
$-27
Cash flow
-1.0%
Cash-on-Cash Return
5.9%
Cap rate
0.8%
Rent to Value Ratio
Active
$435,000
6
bds
|
1
ba
|
2,450
sqft
|
built
1888
1671 N Franklin Pl, Milwaukee, WI 53202
$-1,442
Cash flow
-17.3%
Cash-on-Cash Return
2.2%
Cap rate
0.4%
Rent to Value Ratio

Active
$345,900
2
bds
|
2
ba
|
1,354
sqft
|
built
2002
1915 N Water St, Milwaukee, WI 53202
$-1,702
Cash flow
-25.7%
Cash-on-Cash Return
0.2%
Cap rate
0.5%
Rent to Value Ratio