Milwaukee County Investment Properties for Sale
Browse homes for sale and investment properties in Milwaukee County. Refine your search by price, property type, or more.
Best cash flowing properties in Milwaukee County
Active
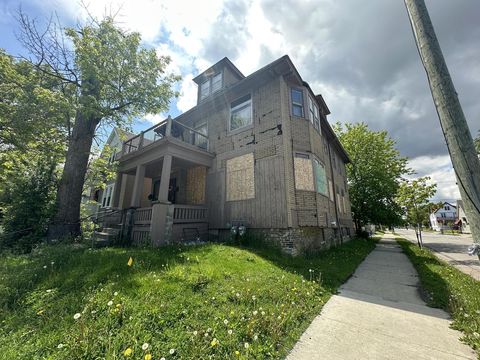
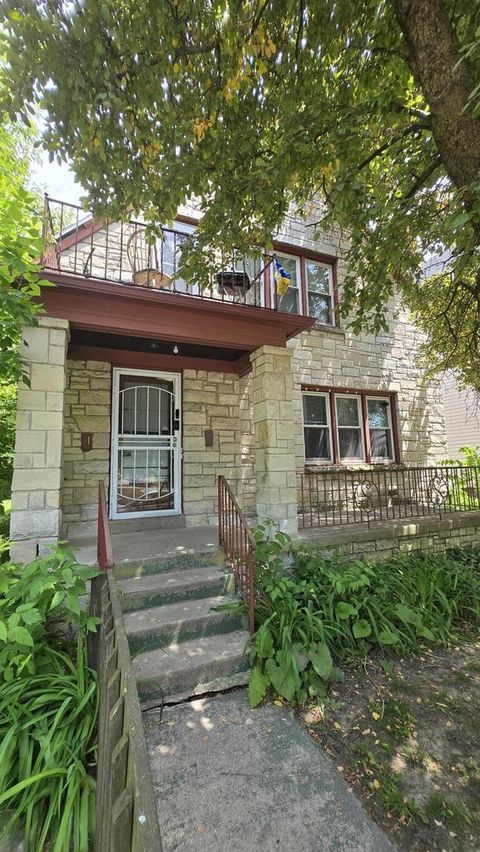
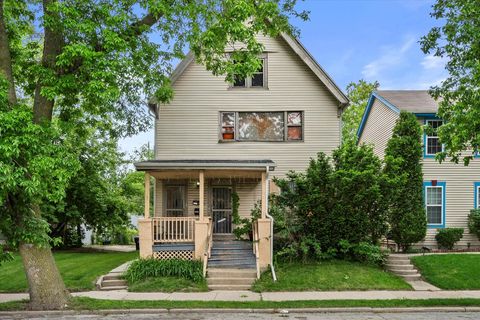
$70,000
6
bds
|
0
ba
|
2,338
sqft
|
built
1911
2877 N 23rd St, Milwaukee, WI 53206
$705
Cash flow
11.7%
Cash-on-Cash Return
12.1%
Cap rate
1.6%
Rent to Value Ratio
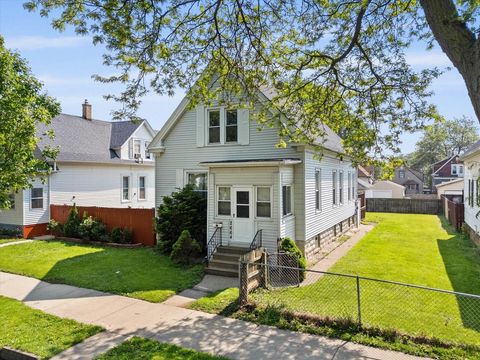
Active
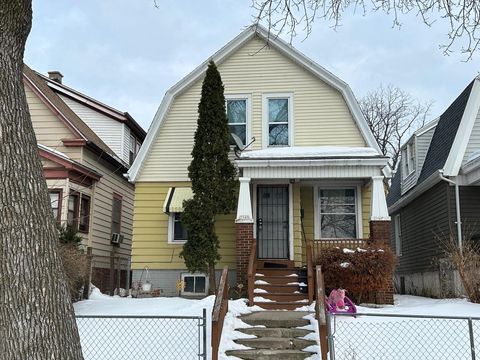
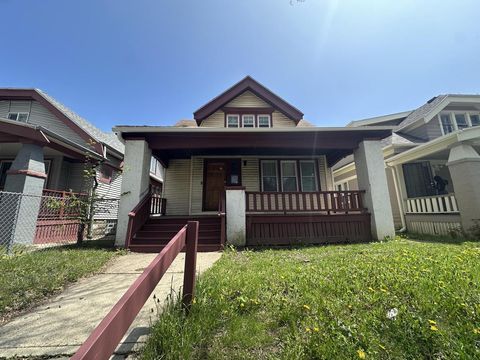
$54,900
4
bds
|
0
ba
|
1,325
sqft
|
built
1912
3540 N 26th St, Milwaukee, WI 53206
$584
Cash flow
12.4%
Cash-on-Cash Return
12.8%
Cap rate
1.8%
Rent to Value Ratio
1,166 out of 1,793 properties for sale in Milwaukee County
Limited Results Shown
Create a free account, or log in to reveal all property listings and enjoy the complete experience.

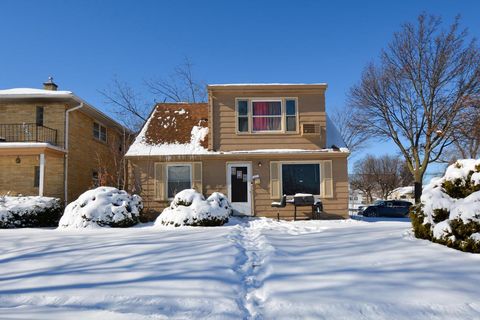
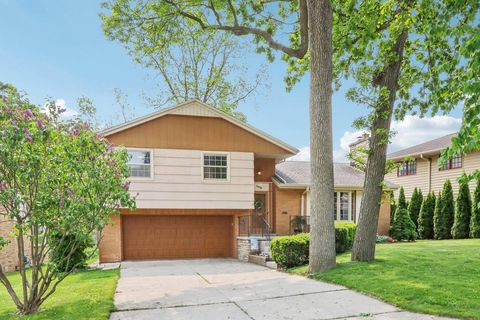
Active
$375,000
4
bds
|
0
ba
|
2,500
sqft
|
built
1955
9427 W Bluemound Rd, Milwaukee, WI 53226
$-814
Cash flow
-11.3%
Cash-on-Cash Return
3.5%
Cap rate
0.7%
Rent to Value Ratio
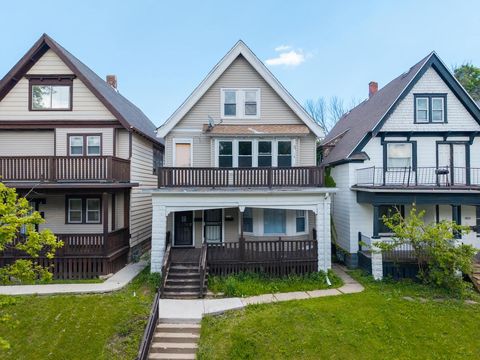
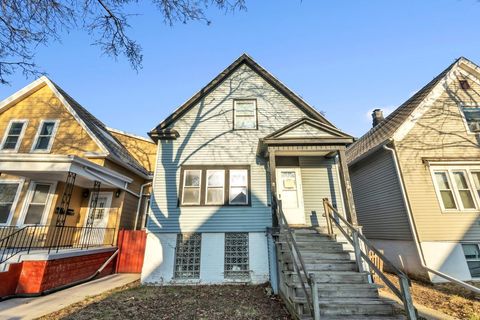
Active
$152,800
3
bds
|
0
ba
|
1,548
sqft
|
built
1953
4375 N 61st St, Milwaukee, WI 53216
$-338
Cash flow
-11.5%
Cash-on-Cash Return
3.5%
Cap rate
0.7%
Rent to Value Ratio
Active
$148,500
6
bds
|
0
ba
|
2,544
sqft
|
built
1912
2162 N 41st St, Milwaukee, WI 53208
$-134
Cash flow
-4.7%
Cash-on-Cash Return
5.1%
Cap rate
0.7%
Rent to Value Ratio
Active
$54,900
4
bds
|
0
ba
|
1,325
sqft
|
built
1912
3540 N 26th St, Milwaukee, WI 53206
$584
Cash flow
12.4%
Cash-on-Cash Return
12.8%
Cap rate
1.8%
Rent to Value Ratio
Active
$164,500
3
bds
|
0
ba
|
1,264
sqft
|
built
1955
5921 N 66th St, Milwaukee, WI 53218
$-184
Cash flow
-5.8%
Cash-on-Cash Return
4.8%
Cap rate
0.8%
Rent to Value Ratio
Active
$249,900
3
bds
|
0
ba
|
1,305
sqft
|
built
1952
5714 W Philip Pl, Milwaukee, WI 53216
$-721
Cash flow
-15.1%
Cash-on-Cash Return
2.7%
Cap rate
0.5%
Rent to Value Ratio
Active
$325,000
4
bds
|
0
ba
|
3,038
sqft
|
built
1962
8915 W Becher St, West Allis, WI 53227
$-452
Cash flow
-7.3%
Cash-on-Cash Return
4.5%
Cap rate
0.9%
Rent to Value Ratio

Active
$679,900
5
bds
|
0
ba
|
2,661
sqft
|
built
1889
2846 N Stowell Ave, Milwaukee, WI 53211
$-2,168
Cash flow
-16.6%
Cash-on-Cash Return
2.3%
Cap rate
0.5%
Rent to Value Ratio

Active
$154,825
3
bds
|
0
ba
|
1,982
sqft
|
built
1927
3025 N 44th St, Milwaukee, WI 53210
$315
Cash flow
10.6%
Cash-on-Cash Return
8.6%
Cap rate
1.3%
Rent to Value Ratio
Active
$425,000
3
bds
|
0
ba
|
2,205
sqft
|
built
1973
1845 W Wayside Dr, Glendale, WI 53209
$-1,007
Cash flow
-12.4%
Cash-on-Cash Return
3.3%
Cap rate
0.6%
Rent to Value Ratio
Active
$109,900
2
bds
|
0
ba
|
1,080
sqft
|
built
1972
5253 N Lovers Lane Rd, Milwaukee, WI 53225
$297
Cash flow
14.1%
Cash-on-Cash Return
9.4%
Cap rate
1.3%
Rent to Value Ratio
Active
$149,900
3
bds
|
0
ba
|
1,667
sqft
|
built
1923
4366 N 25th St, Milwaukee, WI 53209
$-62
Cash flow
-2.2%
Cash-on-Cash Return
5.7%
Cap rate
0.8%
Rent to Value Ratio

Active
$850,000
2
bds
|
0
ba
|
2,088
sqft
|
built
2009
1313 N Franklin Pl, Milwaukee, WI 53202
$-3,298
Cash flow
-20.2%
Cash-on-Cash Return
1.5%
Cap rate
0.5%
Rent to Value Ratio
Active
$129,000
4
bds
|
0
ba
|
2,205
sqft
|
built
1924
3015 N 6th St, Milwaukee, WI 53212
$-61
Cash flow
-2.5%
Cash-on-Cash Return
5.6%
Cap rate
0.9%
Rent to Value Ratio
Active
$955,000
2
bds
|
0
ba
|
2,415
sqft
|
built
2005
923 E Kilbourn Ave, Milwaukee, WI 53202
$-4,217
Cash flow
-23.0%
Cash-on-Cash Return
0.8%
Cap rate
0.4%
Rent to Value Ratio
Active
$230,000
7
bds
|
0
ba
|
3,117
sqft
|
built
1941
3240 N Richards St, Milwaukee, WI 53212
$-584
Cash flow
-13.2%
Cash-on-Cash Return
3.1%
Cap rate
0.5%
Rent to Value Ratio
Active
$229,900
4
bds
|
0
ba
|
1,439
sqft
|
built
1914
2664 S 29th St, Milwaukee, WI 53215
$-469
Cash flow
-10.6%
Cash-on-Cash Return
3.7%
Cap rate
0.7%
Rent to Value Ratio
Active
$335,000
3
bds
|
0
ba
|
1,625
sqft
|
built
1958
2628 S 49th St, Milwaukee, WI 53219
$-842
Cash flow
-13.1%
Cash-on-Cash Return
3.1%
Cap rate
0.6%
Rent to Value Ratio
Active
$116,900
2
bds
|
0
ba
|
1,066
sqft
|
built
1904
2356 S 19th St, Milwaukee, WI 53215
$65
Cash flow
2.9%
Cash-on-Cash Return
6.8%
Cap rate
1.0%
Rent to Value Ratio
Active
$289,900
3
bds
|
0
ba
|
1,159
sqft
|
built
1953
2506 W Whitaker Ave, Milwaukee, WI 53221
$-631
Cash flow
-11.4%
Cash-on-Cash Return
3.5%
Cap rate
0.6%
Rent to Value Ratio
Active
$574,900
4
bds
|
0
ba
|
3,007
sqft
|
built
1928
3448 S Indiana Ave, Milwaukee, WI 53207
$-1,988
Cash flow
-18.0%
Cash-on-Cash Return
2.0%
Cap rate
0.4%
Rent to Value Ratio
Active
$255,000
3
bds
|
0
ba
|
1,269
sqft
|
built
1979
2373 S 83rd St, West Allis, WI 53219
$-278
Cash flow
-5.7%
Cash-on-Cash Return
4.8%
Cap rate
0.7%
Rent to Value Ratio

Active
$800,000
4
bds
|
0
ba
|
3,074
sqft
|
built
1925
3833 N Prospect Ave, Milwaukee, WI 53211
$-2,420
Cash flow
-15.8%
Cash-on-Cash Return
2.5%
Cap rate
0.5%
Rent to Value Ratio
Active
$274,900
5
bds
|
0
ba
|
1,214
sqft
|
built
1952
2101 S 98th St, West Allis, WI 53227
$-514
Cash flow
-9.8%
Cash-on-Cash Return
3.9%
Cap rate
0.7%
Rent to Value Ratio
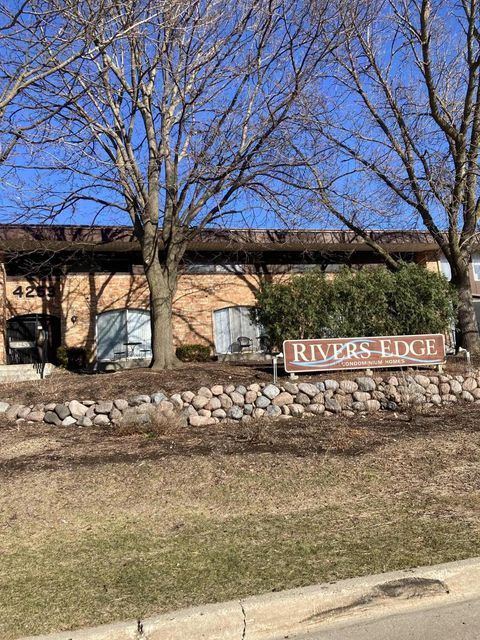
Active
$120,000
2
bds
|
0
ba
|
1,172
sqft
|
built
1971
4253 W Rivers Edge Cir, Brown Deer, WI 53209
$201
Cash flow
8.7%
Cash-on-Cash Return
8.2%
Cap rate
1.2%
Rent to Value Ratio
Active
$159,900
5
bds
|
0
ba
|
2,394
sqft
|
built
1919
2977 N 26th St, Milwaukee, WI 53206
$-731
Cash flow
-23.9%
Cash-on-Cash Return
0.7%
Cap rate
0.5%
Rent to Value Ratio
Active
$199,800
1
bds
|
0
ba
|
751
sqft
|
built
1982
1633 N Prospect Ave, Milwaukee, WI 53202
$-403
Cash flow
-10.5%
Cash-on-Cash Return
3.7%
Cap rate
0.7%
Rent to Value Ratio

Active
$369,900
2
bds
|
0
ba
|
1,328
sqft
|
built
1931
1830 E Kane Pl, Milwaukee, WI 53202
$-1,176
Cash flow
-16.6%
Cash-on-Cash Return
2.3%
Cap rate
0.5%
Rent to Value Ratio

Active
$1,150,000
2
bds
|
0
ba
|
2,415
sqft
|
built
2005
923 E Kilbourn Ave, Milwaukee, WI 53202
$-5,026
Cash flow
-22.8%
Cash-on-Cash Return
0.9%
Cap rate
0.3%
Rent to Value Ratio
Active
$374,900
1
bds
|
0
ba
|
789
sqft
|
built
2006
106 W Seeboth St, Milwaukee, WI 53204
$-1,206
Cash flow
-16.8%
Cash-on-Cash Return
2.3%
Cap rate
0.5%
Rent to Value Ratio
Active
$70,000
6
bds
|
0
ba
|
2,338
sqft
|
built
1911
2877 N 23rd St, Milwaukee, WI 53206
$705
Cash flow
11.7%
Cash-on-Cash Return
12.1%
Cap rate
1.6%
Rent to Value Ratio
Active
$124,900
1
bds
|
0
ba
|
643
sqft
|
built
1969
2025 E Greenwich Ave, Milwaukee, WI 53211
$-164
Cash flow
-6.9%
Cash-on-Cash Return
4.6%
Cap rate
0.8%
Rent to Value Ratio
Active
$80,000
5
bds
|
0
ba
|
2,724
sqft
|
built
1890
1919 N 17th St, Milwaukee, WI 53205
$463
Cash flow
30.2%
Cash-on-Cash Return
13.1%
Cap rate
1.8%
Rent to Value Ratio
Active
$179,900
4
bds
|
0
ba
|
1,498
sqft
|
built
1900
1639 S 7th St, Milwaukee, WI 53204
$23
Cash flow
0.7%
Cash-on-Cash Return
6.3%
Cap rate
0.9%
Rent to Value Ratio
Active
$109,900
4
bds
|
0
ba
|
1,773
sqft
|
built
1921
3036 N 24th Pl, Milwaukee, WI 53206
$237
Cash flow
11.3%
Cash-on-Cash Return
8.7%
Cap rate
1.2%
Rent to Value Ratio
Active
$294,000
3
bds
|
0
ba
|
996
sqft
|
built
1962
7140 N 48th St, Milwaukee, WI 53223
$-812
Cash flow
-14.4%
Cash-on-Cash Return
2.8%
Cap rate
0.5%
Rent to Value Ratio
Active
$199,900
3
bds
|
0
ba
|
1,067
sqft
|
built
1965
6683 N 58th St, Milwaukee, WI 53223
$-503
Cash flow
-13.1%
Cash-on-Cash Return
3.1%
Cap rate
0.6%
Rent to Value Ratio

Active
$474,900
1
bds
|
0
ba
|
1,125
sqft
|
built
1968
929 N Astor St, Milwaukee, WI 53202
$-1,982
Cash flow
-21.8%
Cash-on-Cash Return
1.1%
Cap rate
0.4%
Rent to Value Ratio
Active
$219,000
1
bds
|
0
ba
|
755
sqft
|
built
1982
1633 N Prospect Ave, Milwaukee, WI 53202
$-511
Cash flow
-12.2%
Cash-on-Cash Return
3.3%
Cap rate
0.6%
Rent to Value Ratio

Active
$450,000
bds
|
0
ba
|
0
sqft
|
built
1949
2740 N 61st St, Milwaukee, WI 53210
$-1,912
Cash flow
-22.2%
Cash-on-Cash Return
1.0%
Cap rate
0.3%
Rent to Value Ratio