Milwaukee County Investment Properties for Sale
Browse homes for sale and investment properties in Milwaukee County. Refine your search by price, property type, or more.
Best cash flowing properties in Milwaukee County
Active
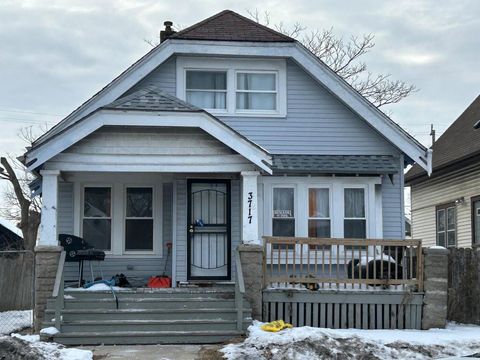
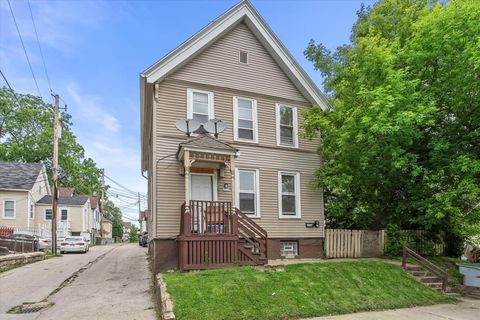
$69,900
2
bds
|
0
ba
|
912
sqft
|
built
1916
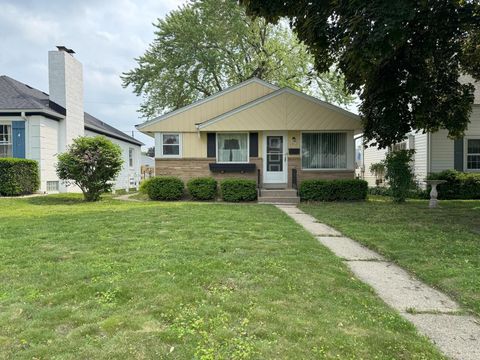
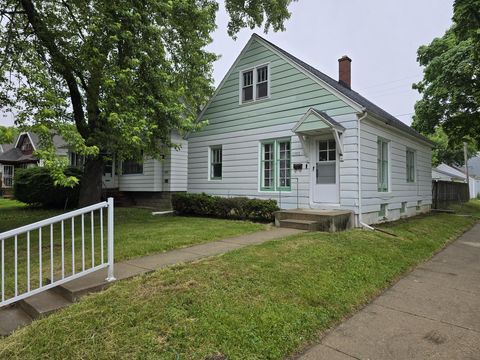
3717 N 27th St, Milwaukee, WI 53216
$584
Cash flow
9.7%
Cash-on-Cash Return
10.0%
Cap rate
1.4%
Rent to Value Ratio
Active
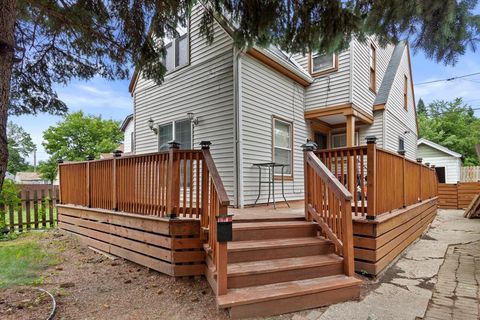
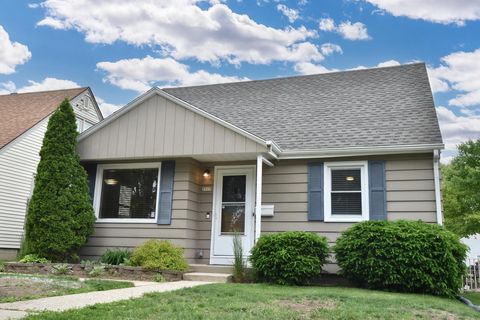
$89,900
2
bds
|
0
ba
|
1,042
sqft
|
built
1924
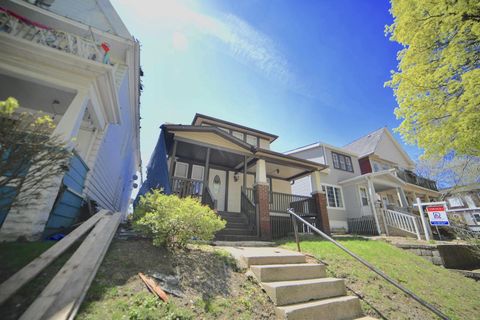
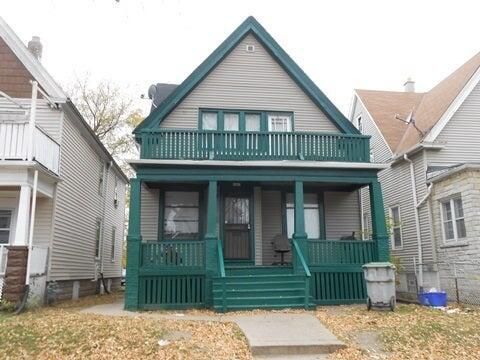
3252 N 40th St, Milwaukee, WI 53216
$154
Cash flow
8.9%
Cash-on-Cash Return
8.2%
Cap rate
1.1%
Rent to Value Ratio
1,166 out of 1,793 properties for sale in Milwaukee County
Limited Results Shown
Create a free account, or log in to reveal all property listings and enjoy the complete experience.
Active
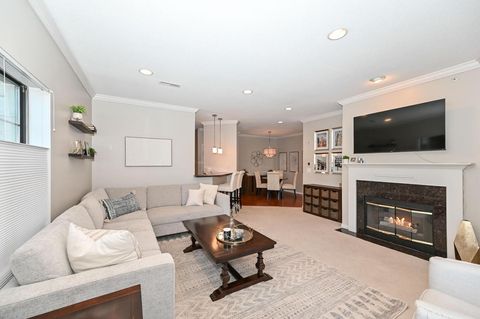
$389,900
2
bds
|
0
ba
|
1,091
sqft
|
built
1998
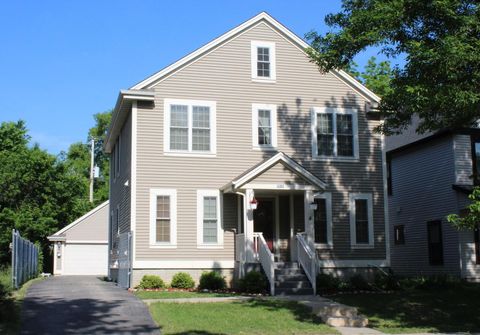
1300 N Prospect Ave, Milwaukee, WI 53202
$-1,038
Cash flow
-13.9%
Cash-on-Cash Return
3.0%
Cap rate
0.6%
Rent to Value Ratio
Active
$69,900
2
bds
|
0
ba
|
912
sqft
|
built
1916
3717 N 27th St, Milwaukee, WI 53216
$584
Cash flow
9.7%
Cash-on-Cash Return
10.0%
Cap rate
1.4%
Rent to Value Ratio

Active
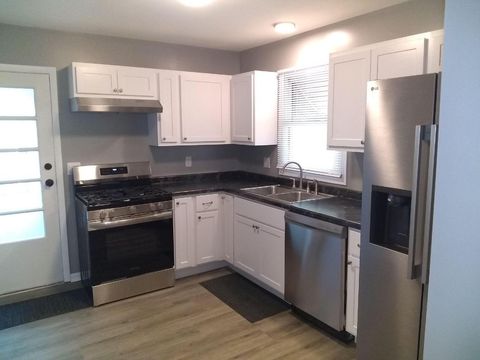
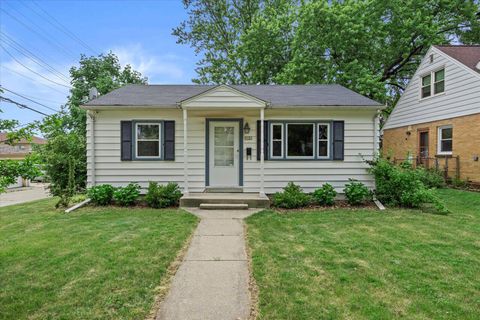
$108,000
2
bds
|
0
ba
|
944
sqft
|
built
1926
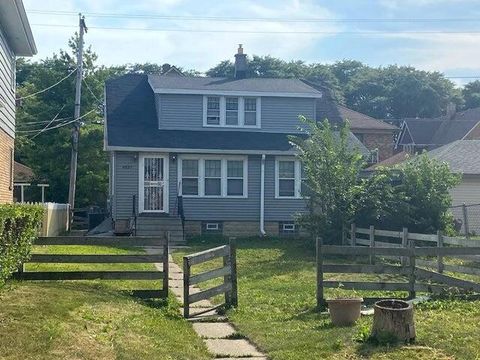
4415 N 36th St, Milwaukee, WI 53209
$64
Cash flow
3.1%
Cash-on-Cash Return
6.9%
Cap rate
1.0%
Rent to Value Ratio

Active
$399,900
bds
|
0
ba
|
4,100
sqft
|
built
1951
3838 W Capitol Dr, Milwaukee, WI 53216
$-1,451
Cash flow
-18.9%
Cash-on-Cash Return
1.8%
Cap rate
0.4%
Rent to Value Ratio
Active
$179,900
3
bds
|
0
ba
|
864
sqft
|
built
1954
3609 N 77th St, Milwaukee, WI 53222
$-266
Cash flow
-7.7%
Cash-on-Cash Return
4.4%
Cap rate
0.7%
Rent to Value Ratio
Active
$249,900
3
bds
|
0
ba
|
1,324
sqft
|
built
1955
10615 W Manor Park Dr, West Allis, WI 53227
$-350
Cash flow
-7.3%
Cash-on-Cash Return
4.5%
Cap rate
0.7%
Rent to Value Ratio
Active
$219,900
5
bds
|
0
ba
|
1,687
sqft
|
built
1924
3021 W Pierce St, Milwaukee, WI 53215
$-782
Cash flow
-18.6%
Cash-on-Cash Return
1.9%
Cap rate
0.4%
Rent to Value Ratio
Active
$174,900
5
bds
|
0
ba
|
2,077
sqft
|
built
1961
5723 N 97th St, Milwaukee, WI 53225
$-435
Cash flow
-13.0%
Cash-on-Cash Return
3.2%
Cap rate
0.6%
Rent to Value Ratio

Active
$2,095,000
2
bds
|
0
ba
|
4,021
sqft
|
built
2007
825 N Prospect Ave, Milwaukee, WI 53202
$-11,355
Cash flow
-28.3%
Cash-on-Cash Return
-0.4%
Cap rate
0.2%
Rent to Value Ratio

Active
$219,900
4
bds
|
0
ba
|
1,573
sqft
|
built
1890
923 E Clarke St, Milwaukee, WI 53212
$-282
Cash flow
-6.7%
Cash-on-Cash Return
4.6%
Cap rate
0.7%
Rent to Value Ratio

Active
$99,900
4
bds
|
0
ba
|
2,830
sqft
|
built
1893
2520 N Holton St, Milwaukee, WI 53212
$-98
Cash flow
-5.1%
Cash-on-Cash Return
5.0%
Cap rate
1.1%
Rent to Value Ratio

Active
$234,900
5
bds
|
0
ba
|
1,964
sqft
|
built
1944
4122 W Roosevelt Dr, Milwaukee, WI 53216
$-648
Cash flow
-14.4%
Cash-on-Cash Return
2.8%
Cap rate
0.5%
Rent to Value Ratio

Active
$1,495,000
2
bds
|
0
ba
|
2,747
sqft
|
built
2007
825 N Prospect Ave, Milwaukee, WI 53202
$-8,255
Cash flow
-28.8%
Cash-on-Cash Return
-0.5%
Cap rate
0.2%
Rent to Value Ratio
Active
$214,900
1
bds
|
0
ba
|
621
sqft
|
built
1921
215 W Maple St, Milwaukee, WI 53204
$-651
Cash flow
-15.8%
Cash-on-Cash Return
2.5%
Cap rate
0.5%
Rent to Value Ratio

Active
$150,000
3
bds
|
0
ba
|
1,269
sqft
|
built
1926
4119 N 25th St, Milwaukee, WI 53209
$61
Cash flow
2.1%
Cash-on-Cash Return
6.6%
Cap rate
0.9%
Rent to Value Ratio

Active
$179,000
3
bds
|
0
ba
|
1,460
sqft
|
built
1930
7126 W Congress St, Milwaukee, WI 53218
$-61
Cash flow
-1.8%
Cash-on-Cash Return
5.7%
Cap rate
0.9%
Rent to Value Ratio
Active
$89,900
2
bds
|
0
ba
|
1,042
sqft
|
built
1924
3252 N 40th St, Milwaukee, WI 53216
$154
Cash flow
8.9%
Cash-on-Cash Return
8.2%
Cap rate
1.1%
Rent to Value Ratio
Active
$269,999
2
bds
|
0
ba
|
676
sqft
|
built
1952
3350 S 26th St, Milwaukee, WI 53215
$-744
Cash flow
-14.4%
Cash-on-Cash Return
2.8%
Cap rate
0.5%
Rent to Value Ratio
Active
$224,900
3
bds
|
0
ba
|
879
sqft
|
built
1953
6560 W Ohio Ave, Milwaukee, WI 53219
$-620
Cash flow
-14.4%
Cash-on-Cash Return
2.8%
Cap rate
0.7%
Rent to Value Ratio
Active
$325,000
1
bds
|
0
ba
|
767
sqft
|
built
2006
106 W Seeboth St, Milwaukee, WI 53204
$-837
Cash flow
-13.4%
Cash-on-Cash Return
3.1%
Cap rate
0.6%
Rent to Value Ratio
Active
$199,900
4
bds
|
0
ba
|
2,058
sqft
|
built
1873
2030 W Pierce St, Milwaukee, WI 53204
$80
Cash flow
2.1%
Cash-on-Cash Return
6.6%
Cap rate
0.9%
Rent to Value Ratio
Active
$119,900
2
bds
|
0
ba
|
997
sqft
|
built
1947
5502 N 35th St, Milwaukee, WI 53209
$137
Cash flow
6.0%
Cash-on-Cash Return
7.5%
Cap rate
1.1%
Rent to Value Ratio
Active
$119,900
4
bds
|
0
ba
|
1,863
sqft
|
built
1907
2847 N 26th St, Milwaukee, WI 53206
$27
Cash flow
1.2%
Cash-on-Cash Return
6.4%
Cap rate
0.8%
Rent to Value Ratio
Active
$399,900
4
bds
|
0
ba
|
2,414
sqft
|
built
2008
2367 N Dr William Finlayson St, Milwaukee, WI 53212
$-1,226
Cash flow
-16.0%
Cash-on-Cash Return
2.5%
Cap rate
0.5%
Rent to Value Ratio
Active
$129,900
5
bds
|
0
ba
|
1,618
sqft
|
built
1923
4535 W Fond Du Lac Ave, Milwaukee, WI 53216
$140
Cash flow
5.6%
Cash-on-Cash Return
7.4%
Cap rate
1.1%
Rent to Value Ratio
Active
$200,000
4
bds
|
0
ba
|
1,220
sqft
|
built
1971
8750 W Hustis St, Milwaukee, WI 53224
$-239
Cash flow
-6.2%
Cash-on-Cash Return
4.7%
Cap rate
0.8%
Rent to Value Ratio
Active
$269,000
3
bds
|
0
ba
|
1,453
sqft
|
built
1959
3726 W Birchwood Ave, Milwaukee, WI 53221
$-700
Cash flow
-13.6%
Cash-on-Cash Return
3.0%
Cap rate
0.6%
Rent to Value Ratio
Active
$199,900
2
bds
|
0
ba
|
863
sqft
|
built
1949
2954 S 48th St, Milwaukee, WI 53219
$-390
Cash flow
-10.2%
Cash-on-Cash Return
3.8%
Cap rate
0.7%
Rent to Value Ratio
Active
$269,000
3
bds
|
0
ba
|
1,073
sqft
|
built
1951
4403 S Griffin Ave, Milwaukee, WI 53207
$-506
Cash flow
-9.8%
Cash-on-Cash Return
3.9%
Cap rate
0.7%
Rent to Value Ratio
Active
$575,000
4
bds
|
0
ba
|
2,854
sqft
|
built
1895
2003 N Bartlett Ave, Milwaukee, WI 53202
$-1,942
Cash flow
-17.6%
Cash-on-Cash Return
2.1%
Cap rate
0.4%
Rent to Value Ratio
Active
$200,000
1
bds
|
0
ba
|
536
sqft
|
built
1921
215 W Maple St, Milwaukee, WI 53204
$-355
Cash flow
-9.3%
Cash-on-Cash Return
4.0%
Cap rate
0.7%
Rent to Value Ratio
Active
$134,900
bds
|
0
ba
|
460
sqft
|
built
1927
1028 E Juneau Ave, Milwaukee, WI 53202
$86
Cash flow
3.3%
Cash-on-Cash Return
6.9%
Cap rate
1.0%
Rent to Value Ratio
Active
$140,000
4
bds
|
0
ba
|
2,252
sqft
|
built
1922
2611 N 48th St, Milwaukee, WI 53210
$-456
Cash flow
-17.0%
Cash-on-Cash Return
2.2%
Cap rate
0.8%
Rent to Value Ratio
Active
$194,500
3
bds
|
0
ba
|
971
sqft
|
built
1959
5082 N 108th St, Milwaukee, WI 53225
$-123
Cash flow
-3.3%
Cash-on-Cash Return
5.4%
Cap rate
0.9%
Rent to Value Ratio
Active
$219,900
3
bds
|
0
ba
|
1,238
sqft
|
built
1923
3161 N 24th St, Milwaukee, WI 53206
$-361
Cash flow
-8.6%
Cash-on-Cash Return
4.2%
Cap rate
0.5%
Rent to Value Ratio
Active
$135,900
4
bds
|
0
ba
|
2,102
sqft
|
built
1927
3152 N 38th St, Milwaukee, WI 53216
$-79
Cash flow
-3.0%
Cash-on-Cash Return
5.4%
Cap rate
1.0%
Rent to Value Ratio
Active
$150,000
3
bds
|
0
ba
|
1,080
sqft
|
built
1953
5700 N 60th St, Milwaukee, WI 53218
$-59
Cash flow
-2.1%
Cash-on-Cash Return
5.7%
Cap rate
0.9%
Rent to Value Ratio
Active
$180,000
5
bds
|
0
ba
|
1,900
sqft
|
built
1892
1116 W Mineral St, Milwaukee, WI 53204
$-400
Cash flow
-11.6%
Cash-on-Cash Return
3.5%
Cap rate
0.6%
Rent to Value Ratio
Active
$272,000
3
bds
|
0
ba
|
1,084
sqft
|
built
1953
2519 S 70th St, Milwaukee, WI 53219
$-603
Cash flow
-11.6%
Cash-on-Cash Return
3.5%
Cap rate
0.7%
Rent to Value Ratio
Active
$149,900
2
bds
|
0
ba
|
747
sqft
|
built
1952
3121 N 93rd St, Milwaukee, WI 53222
$-115
Cash flow
-4.0%
Cash-on-Cash Return
5.2%
Cap rate
0.9%
Rent to Value Ratio