Milwaukee County Investment Properties for Sale
Browse homes for sale and investment properties in Milwaukee County. Refine your search by price, property type, or more.
Best cash flowing properties in Milwaukee County
Active
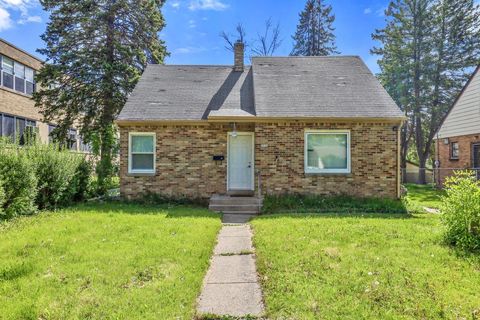
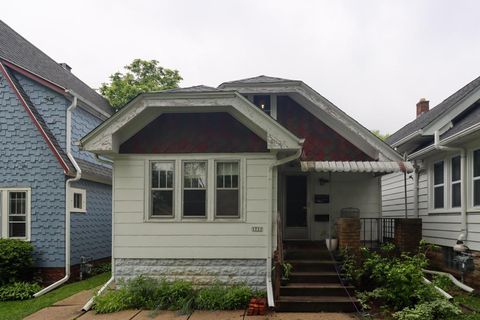
$49,900
2
bds
|
0
ba
|
800
sqft
|
built
1889
112 W Hadley St, Milwaukee, WI 53212
$709
Cash flow
16.6%
Cash-on-Cash Return
17.1%
Cap rate
2.2%
Rent to Value Ratio
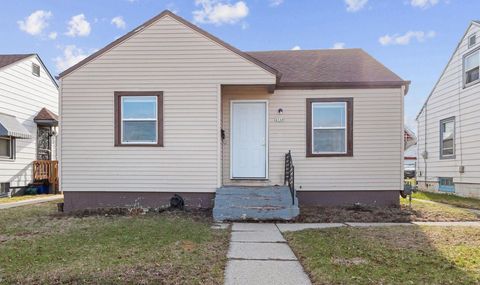
Active
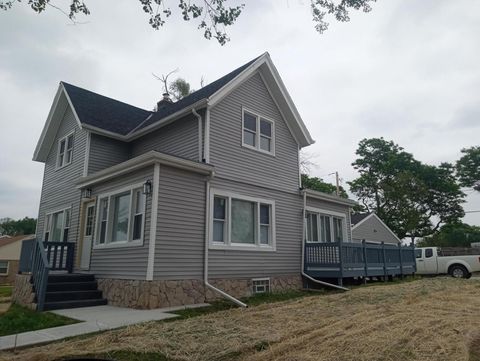
$69,900
4
bds
|
0
ba
|
1,500
sqft
|
built
1899
3039 N 10th Ln, Milwaukee, WI 53206
$632
Cash flow
10.5%
Cash-on-Cash Return
10.8%
Cap rate
1.4%
Rent to Value Ratio
1,199 out of 1,755 properties for sale in Milwaukee County
Limited Results Shown
Create a free account, or log in to reveal all property listings and enjoy the complete experience.
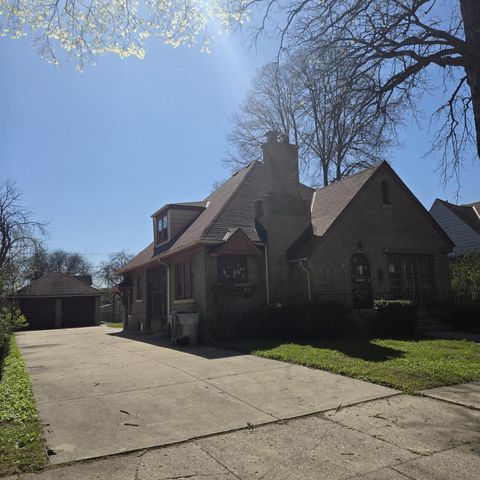
Active
$229,900
2
bds
|
0
ba
|
866
sqft
|
built
1880
2646 N Vel R Phillips Ave, Milwaukee, WI 53212
$-628
Cash flow
-14.3%
Cash-on-Cash Return
2.9%
Cap rate
0.4%
Rent to Value Ratio
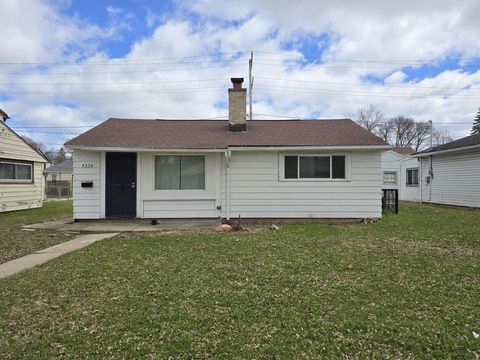
Active
$85,000
2
bds
|
0
ba
|
748
sqft
|
built
1936
4416 N Houston Ave, Milwaukee, WI 53218
$119
Cash flow
7.3%
Cash-on-Cash Return
7.8%
Cap rate
1.2%
Rent to Value Ratio
Active
$240,000
2
bds
|
0
ba
|
1,250
sqft
|
built
1959
4828 W Wisconsin Ave, Milwaukee, WI 53208
$-416
Cash flow
-9.0%
Cash-on-Cash Return
4.1%
Cap rate
0.8%
Rent to Value Ratio
Active
$99,000
2
bds
|
0
ba
|
710
sqft
|
built
1943
4348 N 30th St, Milwaukee, WI 53216
$35
Cash flow
1.8%
Cash-on-Cash Return
6.6%
Cap rate
1.0%
Rent to Value Ratio

Active
$519,900
2
bds
|
0
ba
|
1,514
sqft
|
built
1922
1325 N Van Buren St, Milwaukee, WI 53202
$-1,407
Cash flow
-14.1%
Cash-on-Cash Return
2.9%
Cap rate
0.6%
Rent to Value Ratio
Active
$99,900
4
bds
|
0
ba
|
1,405
sqft
|
built
1880
1941 N 21st St, Milwaukee, WI 53205
$279
Cash flow
14.6%
Cash-on-Cash Return
9.5%
Cap rate
1.3%
Rent to Value Ratio
Active
$109,900
3
bds
|
0
ba
|
823
sqft
|
built
1950
4334 N 42nd Pl, Milwaukee, WI 53216
$-1
Cash flow
0.0%
Cash-on-Cash Return
6.1%
Cap rate
0.9%
Rent to Value Ratio
Active
$267,500
1
bds
|
0
ba
|
1,182
sqft
|
built
1901
270 E Highland Ave, Milwaukee, WI 53202
$-663
Cash flow
-12.9%
Cash-on-Cash Return
3.2%
Cap rate
0.6%
Rent to Value Ratio
Active
$399,900
bds
|
0
ba
|
0
sqft
|
built
1960
5141 N 27th St, Milwaukee, WI 53209
$-1,616
Cash flow
-21.1%
Cash-on-Cash Return
1.3%
Cap rate
0.3%
Rent to Value Ratio
Active
$379,000
9
bds
|
0
ba
|
0
sqft
|
built
1892
2441 N 1st St, Milwaukee, WI 53212
$-1,178
Cash flow
-16.2%
Cash-on-Cash Return
2.4%
Cap rate
0.5%
Rent to Value Ratio
Active
$179,995
4
bds
|
0
ba
|
1,886
sqft
|
built
1957
4568 N 51st Blvd, Milwaukee, WI 53218
$-438
Cash flow
-12.7%
Cash-on-Cash Return
3.2%
Cap rate
0.6%
Rent to Value Ratio
Active
$249,900
2
bds
|
0
ba
|
983
sqft
|
built
1954
3776 S 16th St, Milwaukee, WI 53221
$-419
Cash flow
-8.7%
Cash-on-Cash Return
4.1%
Cap rate
0.6%
Rent to Value Ratio
Active
$175,000
6
bds
|
0
ba
|
2,652
sqft
|
built
1915
2477 N 37th St, Milwaukee, WI 53210
$-340
Cash flow
-10.1%
Cash-on-Cash Return
3.8%
Cap rate
0.6%
Rent to Value Ratio
Active
$69,900
4
bds
|
0
ba
|
1,500
sqft
|
built
1899
3039 N 10th Ln, Milwaukee, WI 53206
$632
Cash flow
10.5%
Cash-on-Cash Return
10.8%
Cap rate
1.4%
Rent to Value Ratio
Active
$110,000
3
bds
|
0
ba
|
1,521
sqft
|
built
1938
3914 W Hampton Ave, Milwaukee, WI 53209
$338
Cash flow
16.0%
Cash-on-Cash Return
9.8%
Cap rate
1.5%
Rent to Value Ratio
Active
$299,000
3
bds
|
0
ba
|
1,248
sqft
|
built
1967
5611 S 23rd St, Milwaukee, WI 53221
$-664
Cash flow
-11.6%
Cash-on-Cash Return
3.5%
Cap rate
0.6%
Rent to Value Ratio
Active
$200,000
5
bds
|
0
ba
|
1,942
sqft
|
built
1928
1728 W Capitol Dr, Milwaukee, WI 53206
$-139
Cash flow
-3.6%
Cash-on-Cash Return
5.3%
Cap rate
0.9%
Rent to Value Ratio
Active
$599,900
5
bds
|
0
ba
|
4,200
sqft
|
built
1959
4922 W Dean Rd, Brown Deer, WI 53223
$-585
Cash flow
-5.1%
Cash-on-Cash Return
5.0%
Cap rate
0.7%
Rent to Value Ratio
Active
$220,000
3
bds
|
0
ba
|
942
sqft
|
built
1959
1420 W Vogel Ave, Milwaukee, WI 53221
$-361
Cash flow
-8.6%
Cash-on-Cash Return
4.2%
Cap rate
0.7%
Rent to Value Ratio
Active
$49,900
2
bds
|
0
ba
|
800
sqft
|
built
1889
112 W Hadley St, Milwaukee, WI 53212
$709
Cash flow
16.6%
Cash-on-Cash Return
17.1%
Cap rate
2.2%
Rent to Value Ratio
Active
$190,000
3
bds
|
0
ba
|
1,014
sqft
|
built
1954
4941 N 63rd St, Milwaukee, WI 53218
$-286
Cash flow
-7.9%
Cash-on-Cash Return
4.3%
Cap rate
0.7%
Rent to Value Ratio

Active
$129,900
2
bds
|
0
ba
|
781
sqft
|
built
1938
4222 W Thurston Ave, Milwaukee, WI 53209
$-12
Cash flow
-0.5%
Cash-on-Cash Return
6.0%
Cap rate
0.8%
Rent to Value Ratio
Active
$110,000
2
bds
|
0
ba
|
1,344
sqft
|
built
1954
3819 W Douglas Ave, Milwaukee, WI 53209
$-22
Cash flow
-1.0%
Cash-on-Cash Return
5.9%
Cap rate
0.9%
Rent to Value Ratio
Active
$125,000
3
bds
|
0
ba
|
1,058
sqft
|
built
1924
4668 N 29th St, Milwaukee, WI 53209
$-122
Cash flow
-5.1%
Cash-on-Cash Return
5.0%
Cap rate
0.9%
Rent to Value Ratio
Active
$119,900
8
bds
|
0
ba
|
3,198
sqft
|
built
1894
2209 N 29th St, Milwaukee, WI 53208
$-20
Cash flow
-0.9%
Cash-on-Cash Return
5.9%
Cap rate
0.9%
Rent to Value Ratio
Active
$390,000
3
bds
|
0
ba
|
2,270
sqft
|
built
1969
1150 W Glen River Rd, Glendale, WI 53217
$-757
Cash flow
-10.1%
Cash-on-Cash Return
3.8%
Cap rate
0.6%
Rent to Value Ratio
Active
$439,900
3
bds
|
0
ba
|
1,635
sqft
|
built
1969
1001 W Fairfield Ct, Glendale, WI 53217
$-1,122
Cash flow
-13.3%
Cash-on-Cash Return
3.1%
Cap rate
0.6%
Rent to Value Ratio

Active
$214,900
6
bds
|
0
ba
|
2,766
sqft
|
built
1893
830 N 22nd St, Milwaukee, WI 53233
$-740
Cash flow
-18.0%
Cash-on-Cash Return
2.0%
Cap rate
0.6%
Rent to Value Ratio

Active
$359,900
4
bds
|
0
ba
|
2,528
sqft
|
built
2014
4229 W Howard Ave, Milwaukee, WI 53221
$-1,360
Cash flow
-19.7%
Cash-on-Cash Return
1.6%
Cap rate
0.4%
Rent to Value Ratio
Active
$385,000
6
bds
|
0
ba
|
1,300
sqft
|
built
1908
2832 S Logan Ave, Milwaukee, WI 53207
$-1,465
Cash flow
-19.9%
Cash-on-Cash Return
1.6%
Cap rate
0.4%
Rent to Value Ratio
Active
$165,000
3
bds
|
0
ba
|
1,664
sqft
|
built
1979
2741 N 56th St, Milwaukee, WI 53210
$-107
Cash flow
-3.4%
Cash-on-Cash Return
5.4%
Cap rate
1.0%
Rent to Value Ratio
Active
$290,000
3
bds
|
0
ba
|
1,114
sqft
|
built
1958
3345 S 79th St, Milwaukee, WI 53219
$-747
Cash flow
-13.4%
Cash-on-Cash Return
3.1%
Cap rate
0.6%
Rent to Value Ratio
Active
$175,500
3
bds
|
0
ba
|
1,358
sqft
|
built
1950
5936 N 35th St, Milwaukee, WI 53209
$-229
Cash flow
-6.8%
Cash-on-Cash Return
4.6%
Cap rate
0.8%
Rent to Value Ratio
Active
$150,000
3
bds
|
0
ba
|
938
sqft
|
built
1952
5107 N 24th St, Milwaukee, WI 53209
$-95
Cash flow
-3.3%
Cash-on-Cash Return
5.4%
Cap rate
0.9%
Rent to Value Ratio
Active
$329,900
4
bds
|
0
ba
|
1,500
sqft
|
built
1850
6460 N 91st St, Milwaukee, WI 53224
$-773
Cash flow
-12.2%
Cash-on-Cash Return
3.3%
Cap rate
0.5%
Rent to Value Ratio
Active
$134,000
4
bds
|
0
ba
|
2,023
sqft
|
built
1929
4537 W Spencer Pl, Milwaukee, WI 53216
$251
Cash flow
9.8%
Cash-on-Cash Return
8.4%
Cap rate
1.3%
Rent to Value Ratio
Active
$155,900
3
bds
|
0
ba
|
820
sqft
|
built
1929
1711 S 85th St, West Allis, WI 53214
$-127
Cash flow
-4.3%
Cash-on-Cash Return
5.2%
Cap rate
0.8%
Rent to Value Ratio
Active
$399,900
4
bds
|
0
ba
|
2,359
sqft
|
built
1968
9719 W Teresa Ln, Milwaukee, WI 53224
$-1,018
Cash flow
-13.3%
Cash-on-Cash Return
3.1%
Cap rate
0.6%
Rent to Value Ratio
Active
$265,000
5
bds
|
0
ba
|
2,364
sqft
|
built
1915
2430 N Grant Blvd, Milwaukee, WI 53210
$-475
Cash flow
-9.4%
Cash-on-Cash Return
4.0%
Cap rate
0.7%
Rent to Value Ratio
Active
$399,000
1
bds
|
0
ba
|
1,401
sqft
|
built
1870
2776 S Superior St, Milwaukee, WI 53207
$-1,204
Cash flow
-15.7%
Cash-on-Cash Return
2.5%
Cap rate
0.5%
Rent to Value Ratio