Milwaukee County Investment Properties for Sale
Browse homes for sale and investment properties in Milwaukee County. Refine your search by price, property type, or more.
Best cash flowing properties in Milwaukee County
Active
$98,500
6
bds
|
0
ba
|
2,304
sqft
|
built
1912
2504 W Burleigh St, Milwaukee, WI 53206
$122
Cash flow
6.5%
Cash-on-Cash Return
7.6%
Cap rate
1.0%
Rent to Value Ratio

Active
$99,900
3
bds
|
0
ba
|
1,596
sqft
|
built
1890
110 W Center St, Milwaukee, WI 53212
$94
Cash flow
4.9%
Cash-on-Cash Return
7.3%
Cap rate
1.1%
Rent to Value Ratio
1,166 out of 1,793 properties for sale in Milwaukee County
Limited Results Shown
Create a free account, or log in to reveal all property listings and enjoy the complete experience.
Active
$98,500
6
bds
|
0
ba
|
2,304
sqft
|
built
1912
2504 W Burleigh St, Milwaukee, WI 53206
$122
Cash flow
6.5%
Cash-on-Cash Return
7.6%
Cap rate
1.0%
Rent to Value Ratio
Active
$177,000
4
bds
|
0
ba
|
2,016
sqft
|
built
1920
3151 N 41st St, Milwaukee, WI 53216
$-402
Cash flow
-11.8%
Cash-on-Cash Return
3.4%
Cap rate
0.6%
Rent to Value Ratio

Active
$144,900
2
bds
|
0
ba
|
1,456
sqft
|
built
1895
1111 S 20th St, Milwaukee, WI 53204
$-98
Cash flow
-3.5%
Cash-on-Cash Return
5.3%
Cap rate
0.8%
Rent to Value Ratio

Active
$159,900
4
bds
|
0
ba
|
1,960
sqft
|
built
1929
3905 W Sheridan Ave, Milwaukee, WI 53209
$-270
Cash flow
-8.8%
Cash-on-Cash Return
4.1%
Cap rate
0.7%
Rent to Value Ratio
Active
$99,900
3
bds
|
0
ba
|
1,596
sqft
|
built
1890
110 W Center St, Milwaukee, WI 53212
$94
Cash flow
4.9%
Cash-on-Cash Return
7.3%
Cap rate
1.1%
Rent to Value Ratio
Active
$575,000
3
bds
|
0
ba
|
1,700
sqft
|
built
2019
2649 N Bremen St, Milwaukee, WI 53212
$-2,779
Cash flow
-25.2%
Cash-on-Cash Return
0.3%
Cap rate
0.2%
Rent to Value Ratio
Active
$432,000
2
bds
|
0
ba
|
1,100
sqft
|
built
1892
520 S 6th St, Milwaukee, WI 53204
$-1,638
Cash flow
-19.8%
Cash-on-Cash Return
1.6%
Cap rate
0.5%
Rent to Value Ratio

Active
$250,000
3
bds
|
0
ba
|
1,706
sqft
|
built
1961
3633 W Rogers St, Milwaukee, WI 53215
$-627
Cash flow
-13.1%
Cash-on-Cash Return
3.1%
Cap rate
0.6%
Rent to Value Ratio
Active
$142,000
1
bds
|
0
ba
|
1,000
sqft
|
built
1972
425 W Willow Ct, Milwaukee, WI 53217
$-39
Cash flow
-1.4%
Cash-on-Cash Return
5.8%
Cap rate
0.9%
Rent to Value Ratio

Active
$499,000
3
bds
|
0
ba
|
1,609
sqft
|
built
2019
2487 S Saint Clair St, Milwaukee, WI 53207
$-1,670
Cash flow
-17.5%
Cash-on-Cash Return
2.1%
Cap rate
0.5%
Rent to Value Ratio

Active
$334,900
1
bds
|
0
ba
|
858
sqft
|
built
2007
106 W Seeboth St, Milwaukee, WI 53204
$-1,218
Cash flow
-19.0%
Cash-on-Cash Return
1.8%
Cap rate
0.5%
Rent to Value Ratio

Active
$460,000
5
bds
|
0
ba
|
2,484
sqft
|
built
1954
812 S 121st St, West Allis, WI 53214
$-1,493
Cash flow
-16.9%
Cash-on-Cash Return
2.3%
Cap rate
0.5%
Rent to Value Ratio
Active
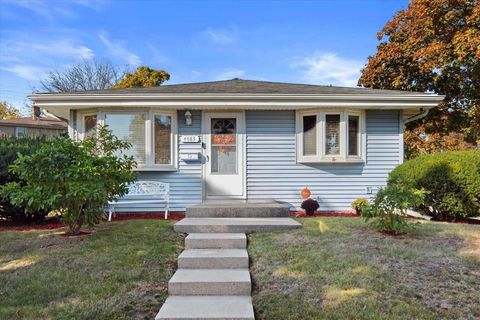
$255,000
3
bds
|
0
ba
|
1,284
sqft
|
built
1959
4683 N 80th St, Milwaukee, WI 53218
$-450
Cash flow
-9.2%
Cash-on-Cash Return
4.0%
Cap rate
0.7%
Rent to Value Ratio

Active
$229,900
3
bds
|
0
ba
|
1,156
sqft
|
built
1963
6437 N 47th St, Milwaukee, WI 53223
$-537
Cash flow
-12.2%
Cash-on-Cash Return
3.3%
Cap rate
0.6%
Rent to Value Ratio

Active
$239,000
4
bds
|
0
ba
|
1,200
sqft
|
built
1972
5709 N 73rd St, Milwaukee, WI 53218
$-452
Cash flow
-9.9%
Cash-on-Cash Return
3.9%
Cap rate
0.6%
Rent to Value Ratio

Active
$169,900
3
bds
|
0
ba
|
994
sqft
|
built
1948
3760 N 60th St, Milwaukee, WI 53216
$-111
Cash flow
-3.4%
Cash-on-Cash Return
5.4%
Cap rate
0.8%
Rent to Value Ratio

Active
$159,500
3
bds
|
0
ba
|
902
sqft
|
built
1957
5810 N 63rd St, Milwaukee, WI 53218
$-195
Cash flow
-6.4%
Cash-on-Cash Return
4.7%
Cap rate
0.8%
Rent to Value Ratio
Active
$164,999
2
bds
|
0
ba
|
925
sqft
|
built
1957
4300 N 73rd St, Milwaukee, WI 53216
$-217
Cash flow
-6.9%
Cash-on-Cash Return
4.6%
Cap rate
0.8%
Rent to Value Ratio

Active
$224,900
3
bds
|
0
ba
|
1,044
sqft
|
built
1953
3416 S 66th St, Milwaukee, WI 53219
$-392
Cash flow
-9.1%
Cash-on-Cash Return
4.1%
Cap rate
0.7%
Rent to Value Ratio

Active
$439,900
6
bds
|
0
ba
|
2,054
sqft
|
built
1978
3872 S Whitnall Ave, Milwaukee, WI 53207
$-1,947
Cash flow
-23.1%
Cash-on-Cash Return
0.8%
Cap rate
0.3%
Rent to Value Ratio

Active
$175,000
3
bds
|
0
ba
|
936
sqft
|
built
1971
5803 N 77th St, Milwaukee, WI 53218
$-307
Cash flow
-9.2%
Cash-on-Cash Return
4.0%
Cap rate
0.7%
Rent to Value Ratio

Active
$519,000
4
bds
|
0
ba
|
2,163
sqft
|
built
1928
1307 E Oklahoma Ave, Milwaukee, WI 53207
$-2,206
Cash flow
-22.2%
Cash-on-Cash Return
1.0%
Cap rate
0.3%
Rent to Value Ratio
Active
$119,900
2
bds
|
0
ba
|
1,000
sqft
|
built
1966
4141 W Cherrywood Ln, Brown Deer, WI 53209
$-68
Cash flow
-3.0%
Cash-on-Cash Return
5.5%
Cap rate
0.8%
Rent to Value Ratio

Active
$395,000
3
bds
|
0
ba
|
2,230
sqft
|
built
1973
9358 N Fairy Chasm Ln, Brown Deer, WI 53223
$-931
Cash flow
-12.3%
Cash-on-Cash Return
3.3%
Cap rate
0.6%
Rent to Value Ratio

Active
$237,000
4
bds
|
0
ba
|
1,573
sqft
|
built
1907
1009 S 35th St, Milwaukee, WI 53215
$-318
Cash flow
-7.0%
Cash-on-Cash Return
4.5%
Cap rate
0.7%
Rent to Value Ratio

Active
$374,900
4
bds
|
0
ba
|
1,848
sqft
|
built
1944
3113 W Oklahoma Ave, Milwaukee, WI 53215
$-1,428
Cash flow
-19.9%
Cash-on-Cash Return
1.6%
Cap rate
0.3%
Rent to Value Ratio

Active
$174,000
3
bds
|
0
ba
|
1,540
sqft
|
built
1902
2027 N 23rd St, Milwaukee, WI 53205
$-427
Cash flow
-12.8%
Cash-on-Cash Return
3.2%
Cap rate
0.6%
Rent to Value Ratio

Active
$268,000
4
bds
|
0
ba
|
1,386
sqft
|
built
1890
319 E Stewart St, Milwaukee, WI 53207
$-499
Cash flow
-9.7%
Cash-on-Cash Return
3.9%
Cap rate
0.7%
Rent to Value Ratio

Active
$219,000
3
bds
|
0
ba
|
1,158
sqft
|
built
1952
3530 N 61st St, Milwaukee, WI 53216
$-407
Cash flow
-9.7%
Cash-on-Cash Return
3.9%
Cap rate
0.6%
Rent to Value Ratio

Active
$320,000
3
bds
|
0
ba
|
1,813
sqft
|
built
1927
2230 N 60th St, Milwaukee, WI 53208
$-817
Cash flow
-13.3%
Cash-on-Cash Return
3.1%
Cap rate
0.6%
Rent to Value Ratio

Active
$109,999
3
bds
|
0
ba
|
1,104
sqft
|
built
1950
3448 N 41st St, Milwaukee, WI 53216
$40
Cash flow
1.9%
Cash-on-Cash Return
6.6%
Cap rate
1.1%
Rent to Value Ratio

Active
$208,000
3
bds
|
0
ba
|
1,512
sqft
|
built
1955
3606 N 61st St, Milwaukee, WI 53216
$-282
Cash flow
-7.1%
Cash-on-Cash Return
4.5%
Cap rate
0.8%
Rent to Value Ratio

Active
$374,900
3
bds
|
0
ba
|
2,076
sqft
|
built
1941
214 E Bolivar Ave, Milwaukee, WI 53207
$-855
Cash flow
-11.9%
Cash-on-Cash Return
3.4%
Cap rate
0.6%
Rent to Value Ratio

Active
$425,000
3
bds
|
0
ba
|
1,571
sqft
|
built
1920
3171 S 9th St, Milwaukee, WI 53215
$-1,466
Cash flow
-18.0%
Cash-on-Cash Return
2.0%
Cap rate
0.4%
Rent to Value Ratio
Active
$190,000
3
bds
|
0
ba
|
1,083
sqft
|
built
1949
3145 S 107th St, West Allis, WI 53227
$-141
Cash flow
-3.9%
Cash-on-Cash Return
5.3%
Cap rate
0.9%
Rent to Value Ratio
Active
$299,900
4
bds
|
0
ba
|
1,478
sqft
|
built
1930
224 E Van Beck Ave, Milwaukee, WI 53207
$-587
Cash flow
-10.2%
Cash-on-Cash Return
3.8%
Cap rate
0.7%
Rent to Value Ratio
Active
$310,000
4
bds
|
0
ba
|
1,567
sqft
|
built
1950
2108 S 93rd St, West Allis, WI 53227
$-536
Cash flow
-9.0%
Cash-on-Cash Return
4.1%
Cap rate
0.6%
Rent to Value Ratio

Active
$179,900
3
bds
|
0
ba
|
1,156
sqft
|
built
1925
813 S 17th St, Milwaukee, WI 53204
$-291
Cash flow
-8.4%
Cash-on-Cash Return
4.2%
Cap rate
0.7%
Rent to Value Ratio

Active
$169,900
2
bds
|
0
ba
|
1,776
sqft
|
built
1948
4804 W Roosevelt Dr, Milwaukee, WI 53216
$-145
Cash flow
-4.5%
Cash-on-Cash Return
5.1%
Cap rate
0.8%
Rent to Value Ratio

Active
$169,000
3
bds
|
0
ba
|
1,500
sqft
|
built
1899
3380 N 39th St, Milwaukee, WI 53216
$-212
Cash flow
-6.5%
Cash-on-Cash Return
4.6%
Cap rate
0.7%
Rent to Value Ratio