Milwaukee County Investment Properties for Sale
Browse homes for sale and investment properties in Milwaukee County. Refine your search by price, property type, or more.
Best cash flowing properties in Milwaukee County

Active
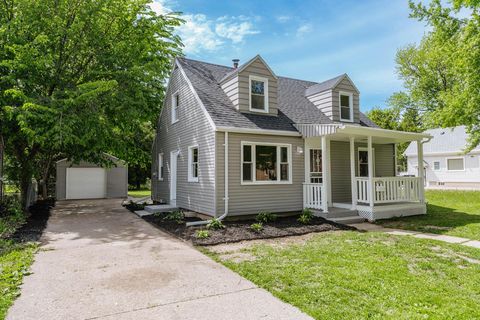
$60,000
3
bds
|
0
ba
|
1,174
sqft
|
built
1903
2468 N 35th St, Milwaukee, WI 53210
$872
Cash flow
16.9%
Cash-on-Cash Return
17.4%
Cap rate
2.3%
Rent to Value Ratio

Active
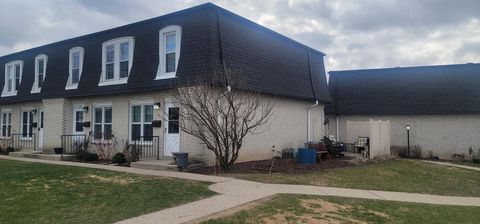
$69,900
2
bds
|
0
ba
|
1,056
sqft
|
built
1970
6054 W Port Ave, Milwaukee, WI 53223
$680
Cash flow
11.3%
Cash-on-Cash Return
11.7%
Cap rate
1.6%
Rent to Value Ratio
1,166 out of 1,793 properties for sale in Milwaukee County
Limited Results Shown
Create a free account, or log in to reveal all property listings and enjoy the complete experience.

Active
$255,000
3
bds
|
0
ba
|
1,575
sqft
|
built
1950
7509 W Burleigh St, Milwaukee, WI 53210
$-501
Cash flow
-10.3%
Cash-on-Cash Return
3.8%
Cap rate
0.7%
Rent to Value Ratio
Active
$279,900
3
bds
|
0
ba
|
1,091
sqft
|
built
1950
2829 N 90th St, Milwaukee, WI 53222
$-511
Cash flow
-9.5%
Cash-on-Cash Return
4.0%
Cap rate
0.6%
Rent to Value Ratio
Active
$98,500
6
bds
|
0
ba
|
2,304
sqft
|
built
1912
2504 W Burleigh St, Milwaukee, WI 53206
$122
Cash flow
6.5%
Cash-on-Cash Return
7.6%
Cap rate
1.0%
Rent to Value Ratio
Active
$177,000
4
bds
|
0
ba
|
2,016
sqft
|
built
1920
3151 N 41st St, Milwaukee, WI 53216
$-402
Cash flow
-11.8%
Cash-on-Cash Return
3.4%
Cap rate
0.6%
Rent to Value Ratio

Active
$144,900
2
bds
|
0
ba
|
1,456
sqft
|
built
1895
1111 S 20th St, Milwaukee, WI 53204
$-98
Cash flow
-3.5%
Cash-on-Cash Return
5.3%
Cap rate
0.8%
Rent to Value Ratio

Active
$159,900
4
bds
|
0
ba
|
1,960
sqft
|
built
1929
3905 W Sheridan Ave, Milwaukee, WI 53209
$-270
Cash flow
-8.8%
Cash-on-Cash Return
4.1%
Cap rate
0.7%
Rent to Value Ratio

Active
$99,900
3
bds
|
0
ba
|
1,596
sqft
|
built
1890
110 W Center St, Milwaukee, WI 53212
$94
Cash flow
4.9%
Cash-on-Cash Return
7.3%
Cap rate
1.1%
Rent to Value Ratio
Active
$575,000
3
bds
|
0
ba
|
1,700
sqft
|
built
2019
2649 N Bremen St, Milwaukee, WI 53212
$-2,779
Cash flow
-25.2%
Cash-on-Cash Return
0.3%
Cap rate
0.2%
Rent to Value Ratio
Active
$432,000
2
bds
|
0
ba
|
1,100
sqft
|
built
1892
520 S 6th St, Milwaukee, WI 53204
$-1,638
Cash flow
-19.8%
Cash-on-Cash Return
1.6%
Cap rate
0.5%
Rent to Value Ratio

Active
$237,000
4
bds
|
0
ba
|
1,573
sqft
|
built
1907
1009 S 35th St, Milwaukee, WI 53215
$-318
Cash flow
-7.0%
Cash-on-Cash Return
4.5%
Cap rate
0.7%
Rent to Value Ratio

Active
$374,900
4
bds
|
0
ba
|
1,848
sqft
|
built
1944
3113 W Oklahoma Ave, Milwaukee, WI 53215
$-1,428
Cash flow
-19.9%
Cash-on-Cash Return
1.6%
Cap rate
0.3%
Rent to Value Ratio

Active
$174,000
3
bds
|
0
ba
|
1,540
sqft
|
built
1902
2027 N 23rd St, Milwaukee, WI 53205
$-427
Cash flow
-12.8%
Cash-on-Cash Return
3.2%
Cap rate
0.6%
Rent to Value Ratio

Active
$268,000
4
bds
|
0
ba
|
1,386
sqft
|
built
1890
319 E Stewart St, Milwaukee, WI 53207
$-499
Cash flow
-9.7%
Cash-on-Cash Return
3.9%
Cap rate
0.7%
Rent to Value Ratio

Active
$219,000
3
bds
|
0
ba
|
1,158
sqft
|
built
1952
3530 N 61st St, Milwaukee, WI 53216
$-407
Cash flow
-9.7%
Cash-on-Cash Return
3.9%
Cap rate
0.6%
Rent to Value Ratio

Active
$320,000
3
bds
|
0
ba
|
1,813
sqft
|
built
1927
2230 N 60th St, Milwaukee, WI 53208
$-817
Cash flow
-13.3%
Cash-on-Cash Return
3.1%
Cap rate
0.6%
Rent to Value Ratio
Active
$209,000
3
bds
|
0
ba
|
1,374
sqft
|
built
1959
8447 W Denver Ave, Milwaukee, WI 53224
$-405
Cash flow
-10.1%
Cash-on-Cash Return
3.8%
Cap rate
0.7%
Rent to Value Ratio

Active
$399,900
3
bds
|
0
ba
|
2,322
sqft
|
built
1955
3100 N Menomonee River Pkwy, Milwaukee, WI 53222
$-1,006
Cash flow
-13.1%
Cash-on-Cash Return
3.1%
Cap rate
0.6%
Rent to Value Ratio
Active
$499,000
3
bds
|
0
ba
|
2,200
sqft
|
built
1993
140 E Stuart Dr, Oak Creek, WI 53154
$-1,154
Cash flow
-12.1%
Cash-on-Cash Return
3.4%
Cap rate
0.6%
Rent to Value Ratio
Active
$269,900
3
bds
|
0
ba
|
1,613
sqft
|
built
1954
8325 W Arthur Ave, West Allis, WI 53219
$-517
Cash flow
-10.0%
Cash-on-Cash Return
3.9%
Cap rate
0.7%
Rent to Value Ratio
Active
$60,000
3
bds
|
0
ba
|
1,174
sqft
|
built
1903
2468 N 35th St, Milwaukee, WI 53210
$872
Cash flow
16.9%
Cash-on-Cash Return
17.4%
Cap rate
2.3%
Rent to Value Ratio
Active
$199,900
3
bds
|
0
ba
|
1,454
sqft
|
built
1951
4709 N 44th St, Milwaukee, WI 53218
$-19,729
Cash flow
-514.9%
Cash-on-Cash Return
-112.3%
Cap rate
0.7%
Rent to Value Ratio

Active
$695,000
4
bds
|
0
ba
|
4,113
sqft
|
built
1905
117 E Lloyd St, Milwaukee, WI 53212
$-2,177
Cash flow
-16.3%
Cash-on-Cash Return
2.4%
Cap rate
0.5%
Rent to Value Ratio

Active
$374,900
3
bds
|
0
ba
|
2,076
sqft
|
built
1941
214 E Bolivar Ave, Milwaukee, WI 53207
$-855
Cash flow
-11.9%
Cash-on-Cash Return
3.4%
Cap rate
0.6%
Rent to Value Ratio

Active
$299,900
3
bds
|
0
ba
|
1,209
sqft
|
built
1959
7926 W Thurston Ave, Milwaukee, WI 53218
$-1,045
Cash flow
-18.2%
Cash-on-Cash Return
2.0%
Cap rate
0.4%
Rent to Value Ratio

Active
$425,000
3
bds
|
0
ba
|
1,571
sqft
|
built
1920
3171 S 9th St, Milwaukee, WI 53215
$-1,466
Cash flow
-18.0%
Cash-on-Cash Return
2.0%
Cap rate
0.4%
Rent to Value Ratio

Active
$519,000
4
bds
|
0
ba
|
2,163
sqft
|
built
1928
1307 E Oklahoma Ave, Milwaukee, WI 53207
$-2,206
Cash flow
-22.2%
Cash-on-Cash Return
1.0%
Cap rate
0.3%
Rent to Value Ratio
Active
$119,900
2
bds
|
0
ba
|
1,000
sqft
|
built
1966
4141 W Cherrywood Ln, Brown Deer, WI 53209
$-68
Cash flow
-3.0%
Cash-on-Cash Return
5.5%
Cap rate
0.8%
Rent to Value Ratio

Active
$395,000
3
bds
|
0
ba
|
2,230
sqft
|
built
1973
9358 N Fairy Chasm Ln, Brown Deer, WI 53223
$-931
Cash flow
-12.3%
Cash-on-Cash Return
3.3%
Cap rate
0.6%
Rent to Value Ratio

Active
$250,000
3
bds
|
0
ba
|
1,706
sqft
|
built
1961
3633 W Rogers St, Milwaukee, WI 53215
$-627
Cash flow
-13.1%
Cash-on-Cash Return
3.1%
Cap rate
0.6%
Rent to Value Ratio

Active
$460,000
5
bds
|
0
ba
|
2,484
sqft
|
built
1954
812 S 121st St, West Allis, WI 53214
$-1,493
Cash flow
-16.9%
Cash-on-Cash Return
2.3%
Cap rate
0.5%
Rent to Value Ratio

Active
$449,000
bds
|
0
ba
|
3,546
sqft
|
built
1890
905 E Clarke St, Milwaukee, WI 53212
$-1,777
Cash flow
-20.6%
Cash-on-Cash Return
1.4%
Cap rate
0.4%
Rent to Value Ratio

Active
$249,900
3
bds
|
0
ba
|
1,646
sqft
|
built
1936
6229 N 118th St, Milwaukee, WI 53225
$-234
Cash flow
-4.9%
Cash-on-Cash Return
5.0%
Cap rate
0.8%
Rent to Value Ratio
Active
$142,000
1
bds
|
0
ba
|
1,000
sqft
|
built
1972
425 W Willow Ct, Milwaukee, WI 53217
$-39
Cash flow
-1.4%
Cash-on-Cash Return
5.8%
Cap rate
0.9%
Rent to Value Ratio

Active
$175,000
3
bds
|
0
ba
|
936
sqft
|
built
1971
5803 N 77th St, Milwaukee, WI 53218
$-307
Cash flow
-9.2%
Cash-on-Cash Return
4.0%
Cap rate
0.7%
Rent to Value Ratio
Active
$445,000
4
bds
|
0
ba
|
2,088
sqft
|
built
1991
1081 E Elm Rd, Oak Creek, WI 53154
$-1,218
Cash flow
-14.3%
Cash-on-Cash Return
2.9%
Cap rate
0.5%
Rent to Value Ratio

Active
$269,900
3
bds
|
0
ba
|
1,585
sqft
|
built
1951
3667 S 21st St, Milwaukee, WI 53221
$-658
Cash flow
-12.7%
Cash-on-Cash Return
3.2%
Cap rate
0.6%
Rent to Value Ratio

Active
$119,900
3
bds
|
0
ba
|
1,477
sqft
|
built
1928
4046 N 6th St, Milwaukee, WI 53212
$203
Cash flow
8.8%
Cash-on-Cash Return
8.2%
Cap rate
1.2%
Rent to Value Ratio

Active
$4,900,000
6
bds
|
0
ba
|
8,544
sqft
|
built
1890
3432 N Lake Dr, Milwaukee, WI 53211
$-30,120
Cash flow
-32.1%
Cash-on-Cash Return
-1.2%
Cap rate
0.0%
Rent to Value Ratio

Active
$324,900
1
bds
|
0
ba
|
918
sqft
|
built
1998
1300 N Prospect Ave, Milwaukee, WI 53202
$-880
Cash flow
-14.1%
Cash-on-Cash Return
2.9%
Cap rate
0.6%
Rent to Value Ratio
Active
$69,900
2
bds
|
0
ba
|
1,056
sqft
|
built
1970
6054 W Port Ave, Milwaukee, WI 53223
$680
Cash flow
11.3%
Cash-on-Cash Return
11.7%
Cap rate
1.6%
Rent to Value Ratio