Milwaukee County Investment Properties for Sale
Browse homes for sale and investment properties in Milwaukee County. Refine your search by price, property type, or more.
Best cash flowing properties in Milwaukee County

Active
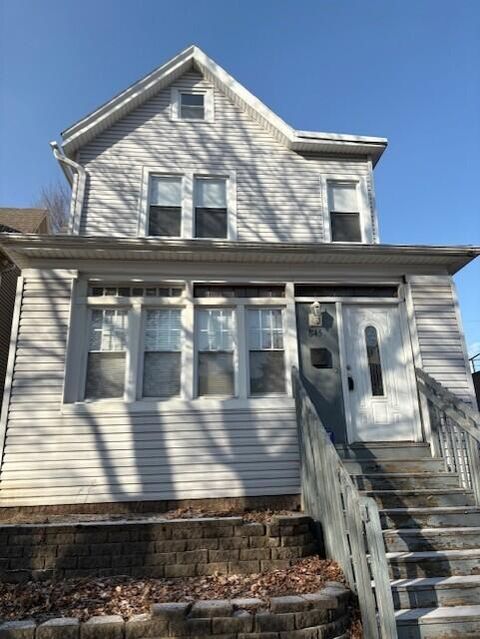
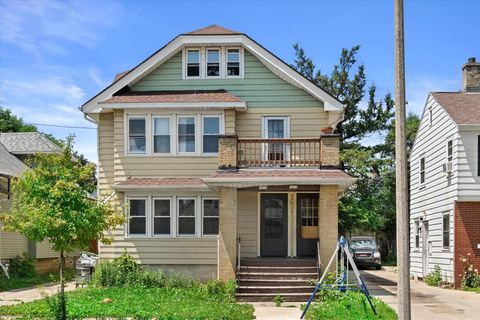
$69,900
3
bds
|
0
ba
|
1,166
sqft
|
built
1893
2021 W Hadley St, Milwaukee, WI 53206
$727
Cash flow
12.1%
Cash-on-Cash Return
12.5%
Cap rate
1.6%
Rent to Value Ratio

Active
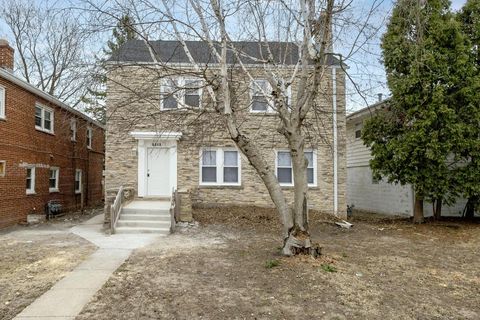
$35,000
3
bds
|
0
ba
|
890
sqft
|
built
1892
2966 N 23rd St, Milwaukee, WI 53206
$629
Cash flow
20.9%
Cash-on-Cash Return
21.6%
Cap rate
2.9%
Rent to Value Ratio
1,166 out of 1,793 properties for sale in Milwaukee County
Limited Results Shown
Create a free account, or log in to reveal all property listings and enjoy the complete experience.

Active
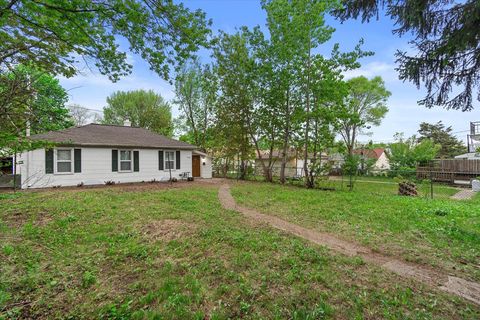
$124,900
3
bds
|
0
ba
|
945
sqft
|
built
1922
3925 N 14th St, Milwaukee, WI 53206
$217
Cash flow
9.1%
Cash-on-Cash Return
8.2%
Cap rate
1.1%
Rent to Value Ratio

Active
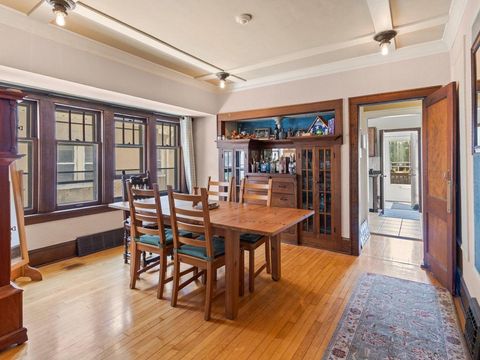
$249,900
4
bds
|
0
ba
|
1,770
sqft
|
built
1877
2636 N Richards St, Milwaukee, WI 53212
$-697
Cash flow
-14.6%
Cash-on-Cash Return
2.8%
Cap rate
0.5%
Rent to Value Ratio

Active
$240,000
3
bds
|
0
ba
|
1,414
sqft
|
built
1959
4743 N 79th St, Milwaukee, WI 53218
$-149
Cash flow
-3.2%
Cash-on-Cash Return
5.4%
Cap rate
0.8%
Rent to Value Ratio

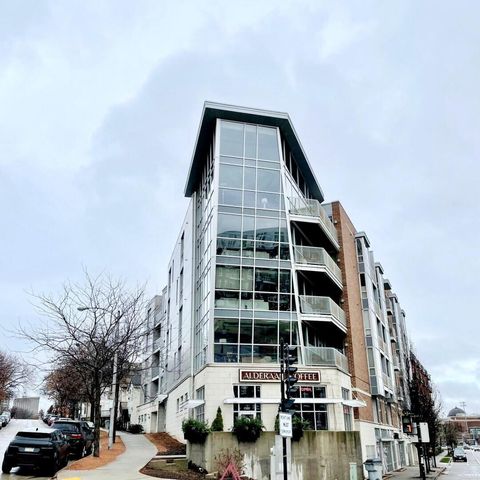
Active
$484,900
2
bds
|
0
ba
|
1,783
sqft
|
built
1916
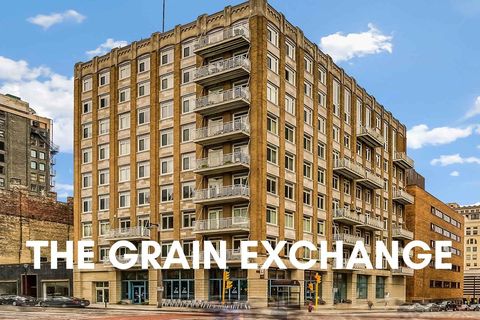
730 N Plankinton Ave, Milwaukee, WI 53203
$-1,134
Cash flow
-12.2%
Cash-on-Cash Return
3.3%
Cap rate
0.6%
Rent to Value Ratio

Active
$349,000
2
bds
|
0
ba
|
1,530
sqft
|
built
2008
1541 N Jefferson St, Milwaukee, WI 53202
$-791
Cash flow
-11.8%
Cash-on-Cash Return
3.4%
Cap rate
0.7%
Rent to Value Ratio

Active
$229,900
2
bds
|
0
ba
|
1,112
sqft
|
built
1870
912 E Pleasant St, Milwaukee, WI 53202
$-537
Cash flow
-12.2%
Cash-on-Cash Return
3.3%
Cap rate
0.7%
Rent to Value Ratio
Active
$69,900
3
bds
|
0
ba
|
1,166
sqft
|
built
1893
2021 W Hadley St, Milwaukee, WI 53206
$727
Cash flow
12.1%
Cash-on-Cash Return
12.5%
Cap rate
1.6%
Rent to Value Ratio

Active
$179,999
3
bds
|
0
ba
|
1,254
sqft
|
built
1915
5555 N 39th St, Milwaukee, WI 53209
$-337
Cash flow
-9.8%
Cash-on-Cash Return
3.9%
Cap rate
0.6%
Rent to Value Ratio

Active
$239,000
3
bds
|
0
ba
|
1,733
sqft
|
built
1948
5002 N 24th Pl, Milwaukee, WI 53209
$-689
Cash flow
-15.0%
Cash-on-Cash Return
2.7%
Cap rate
0.5%
Rent to Value Ratio

Active
$92,800
4
bds
|
0
ba
|
1,666
sqft
|
built
1915
1006 W Nash St, Milwaukee, WI 53206
$312
Cash flow
17.5%
Cash-on-Cash Return
10.2%
Cap rate
1.3%
Rent to Value Ratio
Active
$249,900
5
bds
|
0
ba
|
2,470
sqft
|
built
1890
845 N 22nd St, Milwaukee, WI 53233
$-359
Cash flow
-7.5%
Cash-on-Cash Return
4.4%
Cap rate
0.8%
Rent to Value Ratio

Active
$113,900
2
bds
|
0
ba
|
672
sqft
|
built
1954
5750 N 62nd St, Milwaukee, WI 53218
$-77
Cash flow
-3.5%
Cash-on-Cash Return
5.3%
Cap rate
0.8%
Rent to Value Ratio
Active
$35,000
3
bds
|
0
ba
|
890
sqft
|
built
1892
2966 N 23rd St, Milwaukee, WI 53206
$629
Cash flow
20.9%
Cash-on-Cash Return
21.6%
Cap rate
2.9%
Rent to Value Ratio

Active
$215,000
4
bds
|
0
ba
|
2,289
sqft
|
built
1930
4302 N 65th St, Milwaukee, WI 53216
$-273
Cash flow
-6.6%
Cash-on-Cash Return
4.6%
Cap rate
0.6%
Rent to Value Ratio
Active
$239,000
4
bds
|
0
ba
|
1,800
sqft
|
built
1933
6819 W Hampton Ave, Milwaukee, WI 53218
$-291
Cash flow
-6.4%
Cash-on-Cash Return
4.7%
Cap rate
0.7%
Rent to Value Ratio

Active
$414,900
4
bds
|
0
ba
|
2,416
sqft
|
built
1976
10500 W Good Hope Rd, Milwaukee, WI 53224
$-1,069
Cash flow
-13.4%
Cash-on-Cash Return
3.1%
Cap rate
0.6%
Rent to Value Ratio

Active
$595,000
4
bds
|
0
ba
|
0
sqft
|
built
1914
2518 N 41st St, Milwaukee, WI 53210
$-2,361
Cash flow
-20.7%
Cash-on-Cash Return
1.4%
Cap rate
0.2%
Rent to Value Ratio

Active
$399,000
9
bds
|
0
ba
|
3,380
sqft
|
built
1973
5246 N 54th St, Milwaukee, WI 53218
$-1,346
Cash flow
-17.6%
Cash-on-Cash Return
2.1%
Cap rate
0.5%
Rent to Value Ratio

Active
$102,800
5
bds
|
0
ba
|
1,700
sqft
|
built
1915
3252 N 29th St, Milwaukee, WI 53216
$347
Cash flow
17.6%
Cash-on-Cash Return
10.2%
Cap rate
1.4%
Rent to Value Ratio

Active
$145,000
bds
|
0
ba
|
0
sqft
|
built
1904
2237 N 33rd St, Milwaukee, WI 53208
$59
Cash flow
2.1%
Cash-on-Cash Return
6.6%
Cap rate
1.0%
Rent to Value Ratio
Active
$109,000
2
bds
|
0
ba
|
600
sqft
|
built
1925
5015 N 25th St, Milwaukee, WI 53209
$-42
Cash flow
-2.0%
Cash-on-Cash Return
5.7%
Cap rate
0.9%
Rent to Value Ratio

Active
$150,000
4
bds
|
0
ba
|
2,032
sqft
|
built
1914
2832 W Meinecke Ave, Milwaukee, WI 53210
$-298
Cash flow
-10.4%
Cash-on-Cash Return
3.8%
Cap rate
0.5%
Rent to Value Ratio

Active
$499,000
3
bds
|
0
ba
|
1,609
sqft
|
built
2019
2487 S Saint Clair St, Milwaukee, WI 53207
$-1,670
Cash flow
-17.5%
Cash-on-Cash Return
2.1%
Cap rate
0.5%
Rent to Value Ratio

Active
$109,999
3
bds
|
0
ba
|
1,104
sqft
|
built
1950
3448 N 41st St, Milwaukee, WI 53216
$40
Cash flow
1.9%
Cash-on-Cash Return
6.6%
Cap rate
1.1%
Rent to Value Ratio

Active
$208,000
3
bds
|
0
ba
|
1,512
sqft
|
built
1955
3606 N 61st St, Milwaukee, WI 53216
$-282
Cash flow
-7.1%
Cash-on-Cash Return
4.5%
Cap rate
0.8%
Rent to Value Ratio
Active
$320,000
3
bds
|
0
ba
|
1,574
sqft
|
built
1923
2221 N 60th St, Milwaukee, WI 53208
$-390
Cash flow
-6.4%
Cash-on-Cash Return
4.7%
Cap rate
0.8%
Rent to Value Ratio
Active
$219,000
3
bds
|
0
ba
|
1,012
sqft
|
built
1953
4951 N 49th St, Milwaukee, WI 53218
$-516
Cash flow
-12.3%
Cash-on-Cash Return
3.3%
Cap rate
0.6%
Rent to Value Ratio
Active
$279,900
2
bds
|
0
ba
|
934
sqft
|
built
1926
3265 S Swain Ct, Milwaukee, WI 53207
$-705
Cash flow
-13.1%
Cash-on-Cash Return
3.1%
Cap rate
0.6%
Rent to Value Ratio
Active
$410,000
3
bds
|
0
ba
|
2,175
sqft
|
built
1958
5542 W Jerelyn Pl, Milwaukee, WI 53219
$-985
Cash flow
-12.5%
Cash-on-Cash Return
3.3%
Cap rate
0.5%
Rent to Value Ratio
Active
$284,900
3
bds
|
0
ba
|
1,012
sqft
|
built
1950
2750 N 86th St, Milwaukee, WI 53222
$-434
Cash flow
-7.9%
Cash-on-Cash Return
4.3%
Cap rate
0.7%
Rent to Value Ratio
Active
$239,900
3
bds
|
0
ba
|
1,502
sqft
|
built
1955
2316 W Rohr Ave, Milwaukee, WI 53209
$-361
Cash flow
-7.9%
Cash-on-Cash Return
4.3%
Cap rate
0.7%
Rent to Value Ratio
Active
$193,000
2
bds
|
0
ba
|
857
sqft
|
built
1949
2807 S 49th St, Milwaukee, WI 53219
$-357
Cash flow
-9.7%
Cash-on-Cash Return
3.9%
Cap rate
0.7%
Rent to Value Ratio
Active
$194,900
2
bds
|
0
ba
|
1,248
sqft
|
built
1956
7838 W Lynmar Ct, Milwaukee, WI 53222
$-112
Cash flow
-3.0%
Cash-on-Cash Return
5.5%
Cap rate
0.9%
Rent to Value Ratio
Active
$155,000
3
bds
|
0
ba
|
1,045
sqft
|
built
1890
2820 N Palmer St, Milwaukee, WI 53212
$3
Cash flow
0.1%
Cash-on-Cash Return
6.2%
Cap rate
0.9%
Rent to Value Ratio
Active
$165,000
6
bds
|
0
ba
|
2,700
sqft
|
built
1910
1614 W Becher St, Milwaukee, WI 53215
$-286
Cash flow
-9.0%
Cash-on-Cash Return
4.1%
Cap rate
0.7%
Rent to Value Ratio
Active
$424,900
2
bds
|
0
ba
|
1,354
sqft
|
built
1926
741 N Milwaukee St, Milwaukee, WI 53202
$-967
Cash flow
-11.9%
Cash-on-Cash Return
3.4%
Cap rate
0.6%
Rent to Value Ratio
Active
$260,000
3
bds
|
0
ba
|
1,350
sqft
|
built
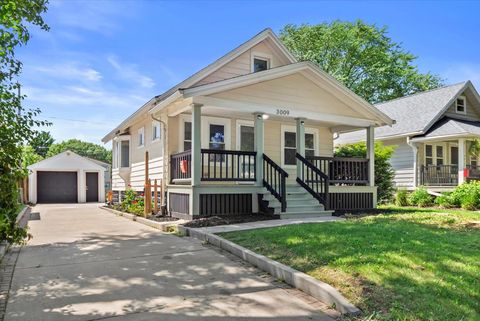
1924
3009 N 72nd St, Milwaukee, WI 53210
$-787
Cash flow
-15.8%
Cash-on-Cash Return
2.5%
Cap rate
0.4%
Rent to Value Ratio
Active
$230,000
4
bds
|
0
ba
|
2,461
sqft
|
built
1937
2754 N 56th St, Milwaukee, WI 53210
$-821
Cash flow
-18.6%
Cash-on-Cash Return
1.9%
Cap rate
0.5%
Rent to Value Ratio
Active
$130,000
4
bds
|
0
ba
|
2,563
sqft
|
built
1929
3013 N 57th St, Milwaukee, WI 53210
$-145
Cash flow
-5.8%
Cash-on-Cash Return
4.8%
Cap rate
0.9%
Rent to Value Ratio
Active
$315,000
2
bds
|
0
ba
|
1,140
sqft
|
built
2008
1541 N Jefferson St, Milwaukee, WI 53202
$-831
Cash flow
-13.8%
Cash-on-Cash Return
3.0%
Cap rate
0.6%
Rent to Value Ratio