Milwaukee County Investment Properties for Sale
Browse homes for sale and investment properties in Milwaukee County. Refine your search by price, property type, or more.
Best cash flowing properties in Milwaukee County
Active
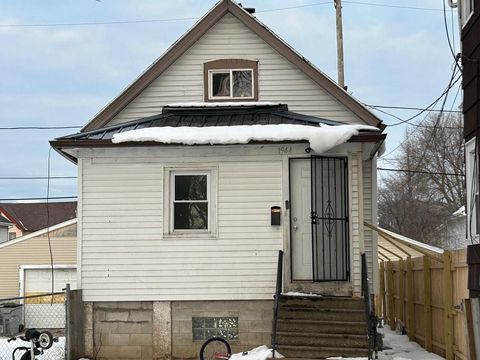
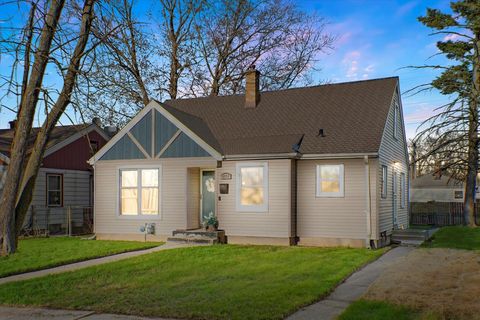
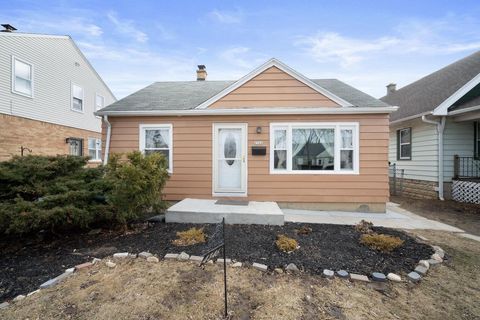
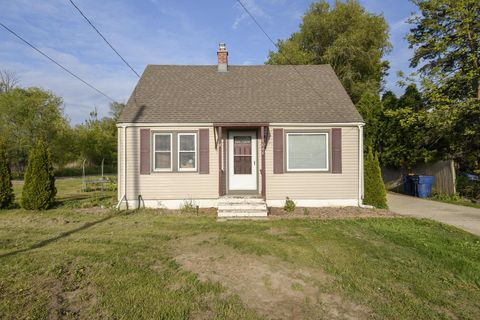
$69,900
4
bds
|
0
ba
|
720
sqft
|
built
1892
1944 N 26th St, Milwaukee, WI 53205
$557
Cash flow
9.3%
Cash-on-Cash Return
9.6%
Cap rate
1.3%
Rent to Value Ratio
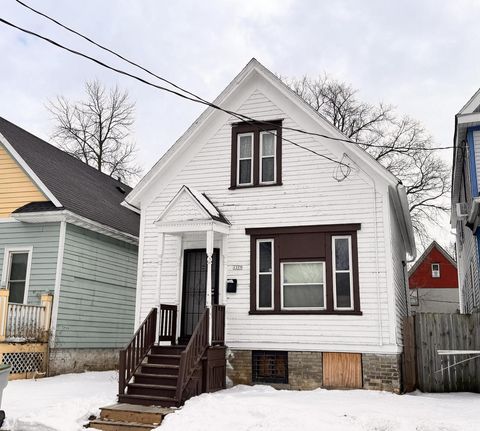
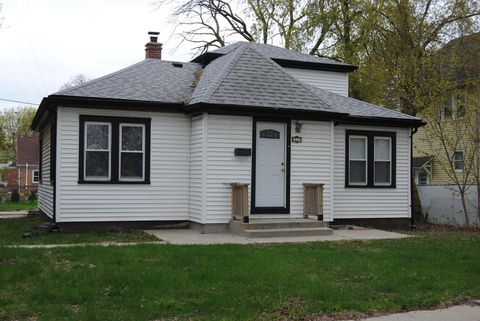
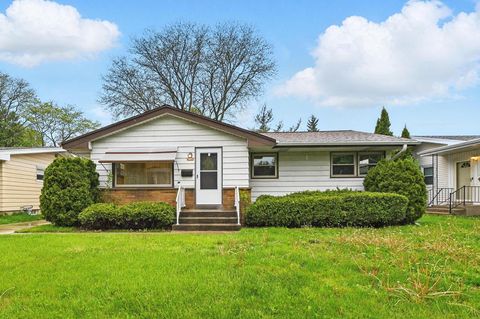
Active
$69,900
2
bds
|
0
ba
|
790
sqft
|
built
1896
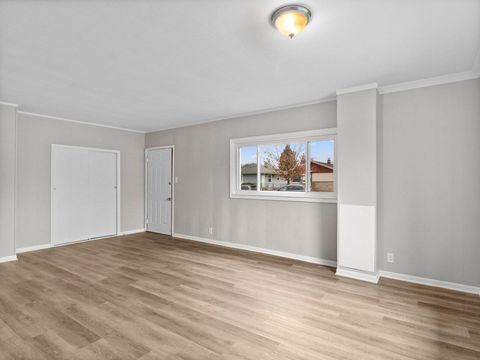
1319 W Groeling Ave, Milwaukee, WI 53206
$542
Cash flow
9.0%
Cash-on-Cash Return
9.3%
Cap rate
1.3%
Rent to Value Ratio
1,166 out of 1,793 properties for sale in Milwaukee County
Limited Results Shown
Create a free account, or log in to reveal all property listings and enjoy the complete experience.
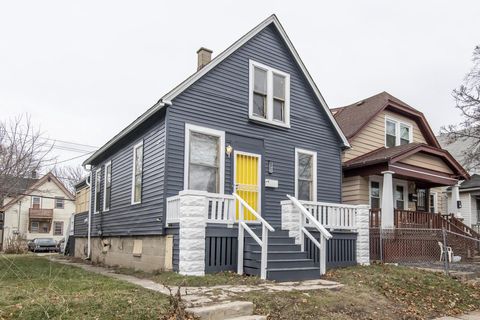
Active
$449,900
4
bds
|
0
ba
|
2,501
sqft
|
built
1988
9502 N 45th St, Brown Deer, WI 53223
$-1,097
Cash flow
-12.7%
Cash-on-Cash Return
3.2%
Cap rate
0.6%
Rent to Value Ratio

Active
$679,900
4
bds
|
0
ba
|
2,800
sqft
|
built
1911
2627 N Farwell Ave, Milwaukee, WI 53211
$-3,322
Cash flow
-25.5%
Cash-on-Cash Return
0.3%
Cap rate
0.2%
Rent to Value Ratio
Active
$99,000
3
bds
|
0
ba
|
888
sqft
|
built
1900
3513 N 25th St, Milwaukee, WI 53206
$83
Cash flow
4.4%
Cash-on-Cash Return
7.2%
Cap rate
1.0%
Rent to Value Ratio
Active
$175,000
3
bds
|
0
ba
|
1,176
sqft
|
built
1953
4820 N 65th St, Milwaukee, WI 53218
$-140
Cash flow
-4.2%
Cash-on-Cash Return
5.2%
Cap rate
0.8%
Rent to Value Ratio
Active
$178,000
3
bds
|
0
ba
|
1,176
sqft
|
built
1955
8051 W Herbert Ave, Milwaukee, WI 53218
$-266
Cash flow
-7.8%
Cash-on-Cash Return
4.4%
Cap rate
0.7%
Rent to Value Ratio
Active
$125,000
2
bds
|
0
ba
|
1,400
sqft
|
built
1980
8900 N Park Plaza Ct, Brown Deer, WI 53223
$80
Cash flow
3.3%
Cash-on-Cash Return
6.9%
Cap rate
1.0%
Rent to Value Ratio
Active
$400,000
4
bds
|
0
ba
|
3,530
sqft
|
built
1972
6538 N Bethmaur Ln, Glendale, WI 53209
$-846
Cash flow
-11.0%
Cash-on-Cash Return
3.6%
Cap rate
0.7%
Rent to Value Ratio
Active
$450,000
1
bds
|
0
ba
|
880
sqft
|
built
2004
601 E Erie St, Milwaukee, WI 53202
$-1,677
Cash flow
-19.4%
Cash-on-Cash Return
1.7%
Cap rate
0.4%
Rent to Value Ratio
Active
$359,900
3
bds
|
0
ba
|
1,632
sqft
|
built
1960
10544 S Nicholson Rd, Oak Creek, WI 53154
$-1,464
Cash flow
-21.2%
Cash-on-Cash Return
1.3%
Cap rate
0.3%
Rent to Value Ratio
Active
$434,900
5
bds
|
0
ba
|
2,464
sqft
|
built
1918
1829 N 52nd St, Milwaukee, WI 53208
$-1,246
Cash flow
-14.9%
Cash-on-Cash Return
2.7%
Cap rate
0.5%
Rent to Value Ratio

Active
$97,500
2
bds
|
0
ba
|
1,040
sqft
|
built
1974
8619 N Servite Dr, Milwaukee, WI 53223
$320
Cash flow
17.1%
Cash-on-Cash Return
10.1%
Cap rate
1.4%
Rent to Value Ratio
Active
$389,622
3
bds
|
0
ba
|
1,989
sqft
|
built
1991
9312 W Clovernook St, Milwaukee, WI 53224
$-1,062
Cash flow
-14.2%
Cash-on-Cash Return
2.9%
Cap rate
0.6%
Rent to Value Ratio
Active
$175,000
3
bds
|
0
ba
|
1,227
sqft
|
built
1951
4950 N 21st St, Milwaukee, WI 53209
$-171
Cash flow
-5.1%
Cash-on-Cash Return
5.0%
Cap rate
0.8%
Rent to Value Ratio

Active
$131,500
5
bds
|
0
ba
|
1,909
sqft
|
built
1963
5957 N 64th St, Milwaukee, WI 53218
$-273
Cash flow
-10.8%
Cash-on-Cash Return
3.7%
Cap rate
0.8%
Rent to Value Ratio
Active
$269,900
3
bds
|
0
ba
|
1,360
sqft
|
built
1947
809 S 113th St, West Allis, WI 53214
$-429
Cash flow
-8.3%
Cash-on-Cash Return
4.2%
Cap rate
0.7%
Rent to Value Ratio

Active
$668,000
bds
|
0
ba
|
4,804
sqft
|
built
1958
8017 W Hampton Ave, Milwaukee, WI 53218
$-3,628
Cash flow
-28.3%
Cash-on-Cash Return
-0.4%
Cap rate
0.1%
Rent to Value Ratio

Active
$259,900
3
bds
|
0
ba
|
1,594
sqft
|
built
1967
7100 W Acacia St, Milwaukee, WI 53223
$-548
Cash flow
-11.0%
Cash-on-Cash Return
3.6%
Cap rate
0.6%
Rent to Value Ratio
Active
$217,900
1
bds
|
0
ba
|
653
sqft
|
built
1968
929 N Astor St, Milwaukee, WI 53202
$-324
Cash flow
-7.8%
Cash-on-Cash Return
4.4%
Cap rate
0.7%
Rent to Value Ratio

Active
$399,900
4
bds
|
0
ba
|
1,638
sqft
|
built
1905
4118 S Austin St, Milwaukee, WI 53207
$-1,722
Cash flow
-22.5%
Cash-on-Cash Return
1.0%
Cap rate
0.3%
Rent to Value Ratio
Active
$144,900
3
bds
|
0
ba
|
1,035
sqft
|
built
1939
1631 W Custer Ave, Milwaukee, WI 53209
$-163
Cash flow
-5.9%
Cash-on-Cash Return
4.8%
Cap rate
0.9%
Rent to Value Ratio
Active
$69,900
4
bds
|
0
ba
|
720
sqft
|
built
1892
1944 N 26th St, Milwaukee, WI 53205
$557
Cash flow
9.3%
Cash-on-Cash Return
9.6%
Cap rate
1.3%
Rent to Value Ratio
Active
$204,900
3
bds
|
0
ba
|
1,125
sqft
|
built
1953
4346 N 63rd St, Milwaukee, WI 53216
$-111
Cash flow
-2.8%
Cash-on-Cash Return
5.5%
Cap rate
0.8%
Rent to Value Ratio
Active
$179,900
3
bds
|
0
ba
|
1,457
sqft
|
built
1949
5833 N 75th St, Milwaukee, WI 53218
$-202
Cash flow
-5.9%
Cash-on-Cash Return
4.8%
Cap rate
0.8%
Rent to Value Ratio
Active
$520,000
bds
|
0
ba
|
0
sqft
|
built
1907
1341 S Layton Blvd, Milwaukee, WI 53215
$-2,843
Cash flow
-28.5%
Cash-on-Cash Return
-0.4%
Cap rate
0.2%
Rent to Value Ratio

Active
$113,900
2
bds
|
0
ba
|
672
sqft
|
built
1954
5733 N 60th St, Milwaukee, WI 53218
$94
Cash flow
4.3%
Cash-on-Cash Return
7.1%
Cap rate
1.0%
Rent to Value Ratio
Active
$129,900
4
bds
|
0
ba
|
2,330
sqft
|
built
1916
2544 N 35th St, Milwaukee, WI 53210
$4
Cash flow
0.2%
Cash-on-Cash Return
6.2%
Cap rate
0.8%
Rent to Value Ratio

Active
$399,999
5
bds
|
0
ba
|
2,180
sqft
|
built
1968
9530 W Debbie Ln, Milwaukee, WI 53224
$-1,162
Cash flow
-15.2%
Cash-on-Cash Return
2.7%
Cap rate
0.5%
Rent to Value Ratio
Active
$499,900
5
bds
|
0
ba
|
2,336
sqft
|
built
1961
7420 N Redwood Rd, Glendale, WI 53209
$-1,271
Cash flow
-13.3%
Cash-on-Cash Return
3.1%
Cap rate
0.6%
Rent to Value Ratio
Active
$375,000
3
bds
|
0
ba
|
1,710
sqft
|
built
1940
2912 N 67th St, Milwaukee, WI 53210
$-928
Cash flow
-12.9%
Cash-on-Cash Return
3.2%
Cap rate
0.6%
Rent to Value Ratio

Active
$259,900
3
bds
|
0
ba
|
912
sqft
|
built
1949
2775 S 53rd St, Milwaukee, WI 53219
$-592
Cash flow
-11.9%
Cash-on-Cash Return
3.4%
Cap rate
0.7%
Rent to Value Ratio
Active
$224,900
2
bds
|
0
ba
|
689
sqft
|
built
1953
3411 S 63rd St, Milwaukee, WI 53219
$-479
Cash flow
-11.1%
Cash-on-Cash Return
3.6%
Cap rate
0.6%
Rent to Value Ratio

Active
$224,900
2
bds
|
0
ba
|
936
sqft
|
built
1949
2951 S 50th St, Milwaukee, WI 53219
$-567
Cash flow
-13.2%
Cash-on-Cash Return
3.1%
Cap rate
0.5%
Rent to Value Ratio

Active
$149,900
2
bds
|
0
ba
|
688
sqft
|
built
1949
8330 W Auer Ave, Milwaukee, WI 53222
$-116
Cash flow
-4.0%
Cash-on-Cash Return
5.2%
Cap rate
0.8%
Rent to Value Ratio
Active
$429,900
4
bds
|
0
ba
|
2,865
sqft
|
built
1966
3310 S 121st St, West Allis, WI 53227
$-1,080
Cash flow
-13.1%
Cash-on-Cash Return
3.1%
Cap rate
0.6%
Rent to Value Ratio
Active
$299,900
3
bds
|
0
ba
|
1,179
sqft
|
built
1946
8646 S Chicago Rd, Oak Creek, WI 53154
$-525
Cash flow
-9.1%
Cash-on-Cash Return
4.0%
Cap rate
0.6%
Rent to Value Ratio
Active
$219,900
3
bds
|
0
ba
|
1,026
sqft
|
built
1955
4349 N 80th St, Milwaukee, WI 53222
$-282
Cash flow
-6.7%
Cash-on-Cash Return
4.6%
Cap rate
0.7%
Rent to Value Ratio

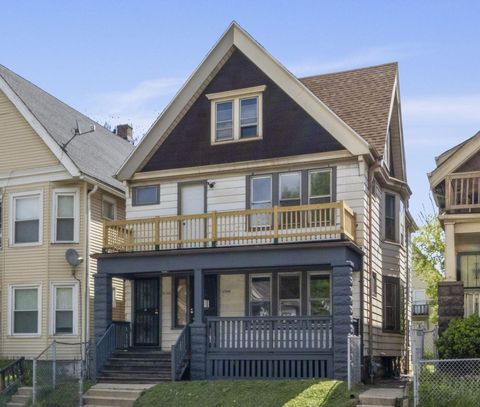
Active
$190,000
7
bds
|
0
ba
|
2,884
sqft
|
built
1902
2018 S 28th St, Milwaukee, WI 53215
$-359
Cash flow
-9.9%
Cash-on-Cash Return
3.9%
Cap rate
0.7%
Rent to Value Ratio
Active
$69,900
2
bds
|
0
ba
|
790
sqft
|
built
1896
1319 W Groeling Ave, Milwaukee, WI 53206
$542
Cash flow
9.0%
Cash-on-Cash Return
9.3%
Cap rate
1.3%
Rent to Value Ratio
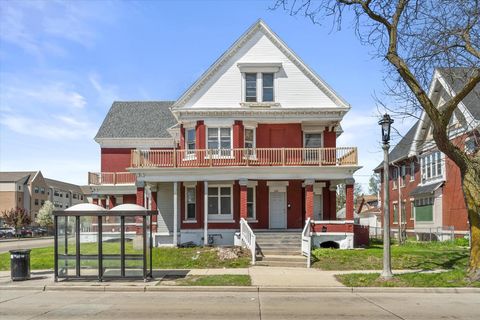
Active
$129,900
8
bds
|
0
ba
|
3,146
sqft
|
built
1913
2931 N 2nd St, Milwaukee, WI 53212
$290
Cash flow
11.6%
Cash-on-Cash Return
8.8%
Cap rate
1.2%
Rent to Value Ratio

Active
$265,000
2
bds
|
0
ba
|
980
sqft
|
built
1901
270 E Highland Ave, Milwaukee, WI 53202
$-404
Cash flow
-8.0%
Cash-on-Cash Return
4.3%
Cap rate
0.8%
Rent to Value Ratio