Windsor, CO Investment Properties for Sale
Browse homes for sale and investment properties in Windsor, CO. Refine your search by price, property type, or more.
Best cash flowing properties in Windsor, CO
Active
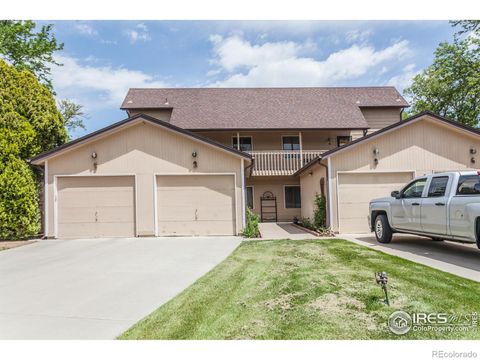
$275,000
2
bds
|
1
ba
|
826
sqft
|
built
1980
909 Conifer Ct, Windsor, CO 80550
$-616
Cash flow
-11.7%
Cash-on-Cash Return
3.6%
Cap rate
0.7%
Rent to Value Ratio
Active
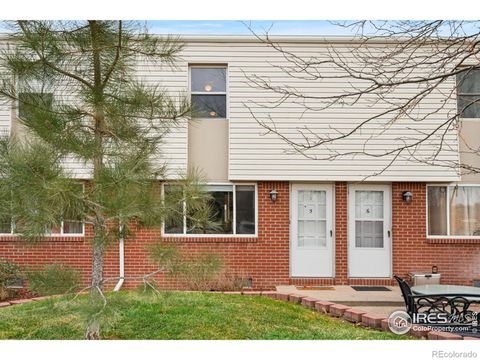
$269,000
2
bds
|
2
ba
|
928
sqft
|
built
1971
707 3rd St, Windsor, CO 80550
$-701
Cash flow
-13.6%
Cash-on-Cash Return
3.1%
Cap rate
0.6%
Rent to Value Ratio
184 out of 224 properties for sale in Windsor, CO
Limited Results Shown
Create a free account, or log in to reveal all property listings and enjoy the complete experience.
Active
$930,000
5
bds
|
5
ba
|
4,993
sqft
|
built
2007
1999 Bayfront Dr, Windsor, CO 80550
$-2,428
Cash flow
-13.6%
Cash-on-Cash Return
3.1%
Cap rate
0.5%
Rent to Value Ratio
Active
$420,000
2
bds
|
3
ba
|
1,522
sqft
|
built
2016
2167 Montauk Ln, Windsor, CO 80550
$-1,196
Cash flow
-14.9%
Cash-on-Cash Return
2.8%
Cap rate
0.5%
Rent to Value Ratio
Active
$755,000
4
bds
|
4
ba
|
2,745
sqft
|
built
2022
2031 Moon Rise Dr, Windsor, CO 80550
$-1,959
Cash flow
-13.5%
Cash-on-Cash Return
3.2%
Cap rate
0.5%
Rent to Value Ratio
Active
$575,000
4
bds
|
3
ba
|
2,534
sqft
|
built
2018
2283 Stonefish Dr, Windsor, CO 80550
$-1,430
Cash flow
-13.0%
Cash-on-Cash Return
3.3%
Cap rate
0.5%
Rent to Value Ratio
Active
$615,000
5
bds
|
3
ba
|
2,733
sqft
|
built
2018
1686 Whiteley Dr, Windsor, CO 80550
$-1,608
Cash flow
-13.6%
Cash-on-Cash Return
3.1%
Cap rate
0.5%
Rent to Value Ratio
Active
$575,000
4
bds
|
3
ba
|
2,526
sqft
|
built
2021
1743 Floret Dr, Windsor, CO 80550
$-1,268
Cash flow
-11.5%
Cash-on-Cash Return
3.6%
Cap rate
0.6%
Rent to Value Ratio
Active
$379,000
2
bds
|
2
ba
|
1,002
sqft
|
built
2020
6510 Crystal Downs Dr, Windsor, CO 80550
$-1,084
Cash flow
-14.9%
Cash-on-Cash Return
2.8%
Cap rate
0.6%
Rent to Value Ratio
Active
$600,000
5
bds
|
3
ba
|
2,960
sqft
|
built
2016
614 Park Edge Cir, Windsor, CO 80550
$-1,265
Cash flow
-11.0%
Cash-on-Cash Return
3.7%
Cap rate
0.5%
Rent to Value Ratio
Active
$275,000
2
bds
|
1
ba
|
826
sqft
|
built
1980
909 Conifer Ct, Windsor, CO 80550
$-616
Cash flow
-11.7%
Cash-on-Cash Return
3.6%
Cap rate
0.7%
Rent to Value Ratio
Active
$920,000
5
bds
|
5
ba
|
3,984
sqft
|
built
2008
6741 Bandon Dunes Dr, Windsor, CO 80550
$-2,854
Cash flow
-16.2%
Cash-on-Cash Return
2.5%
Cap rate
0.4%
Rent to Value Ratio
Active
$525,000
4
bds
|
4
ba
|
1,794
sqft
|
built
2012
484 Wind River Dr, Windsor, CO 80550
$-1,143
Cash flow
-11.4%
Cash-on-Cash Return
3.7%
Cap rate
0.5%
Rent to Value Ratio
Active
$650,000
5
bds
|
3
ba
|
2,770
sqft
|
built
2021
1576 Illingworth Dr, Windsor, CO 80550
$-1,636
Cash flow
-13.1%
Cash-on-Cash Return
3.2%
Cap rate
0.5%
Rent to Value Ratio

Active
$694,900
5
bds
|
3
ba
|
2,981
sqft
|
built
2020
4586 Binfield Dr, Windsor, CO 80550
$-2,139
Cash flow
-16.1%
Cash-on-Cash Return
2.6%
Cap rate
0.4%
Rent to Value Ratio
Active
$674,900
3
bds
|
3
ba
|
2,182
sqft
|
built
2011
7401 Pimlico Dr, Windsor, CO 80550
$-1,689
Cash flow
-13.1%
Cash-on-Cash Return
3.3%
Cap rate
0.5%
Rent to Value Ratio
Active
$850,000
5
bds
|
3
ba
|
3,498
sqft
|
built
2021
356 Boxwood Dr, Windsor, CO 80550
$-2,523
Cash flow
-15.5%
Cash-on-Cash Return
2.7%
Cap rate
0.4%
Rent to Value Ratio
Active
$934,900
4
bds
|
4
ba
|
3,251
sqft
|
built
2020
6712 Olympia Fields Ct, Windsor, CO 80550
$-2,797
Cash flow
-15.6%
Cash-on-Cash Return
2.7%
Cap rate
0.4%
Rent to Value Ratio
Active
$730,000
3
bds
|
3
ba
|
3,407
sqft
|
built
2005
1992 Vineyard Dr, Windsor, CO 80550
$-2,277
Cash flow
-16.3%
Cash-on-Cash Return
2.5%
Cap rate
0.4%
Rent to Value Ratio
Active
$879,900
7
bds
|
6
ba
|
6,000
sqft
|
built
2014
1997 Cayman Dr, Windsor, CO 80550
$-3,083
Cash flow
-18.3%
Cash-on-Cash Return
2.1%
Cap rate
0.4%
Rent to Value Ratio
Active
$735,000
5
bds
|
3
ba
|
3,034
sqft
|
built
2021
4521 Devereux Dr, Windsor, CO 80550
$-2,127
Cash flow
-15.1%
Cash-on-Cash Return
2.8%
Cap rate
0.4%
Rent to Value Ratio
Active
$460,000
2
bds
|
3
ba
|
1,484
sqft
|
built
2021
5111 Longshaw Ct, Windsor, CO 80528
$-1,252
Cash flow
-14.2%
Cash-on-Cash Return
3.0%
Cap rate
0.5%
Rent to Value Ratio
Active
$759,000
4
bds
|
3
ba
|
2,772
sqft
|
built
2006
453 Harbor Ct, Windsor, CO 80550
$-2,101
Cash flow
-14.4%
Cash-on-Cash Return
2.9%
Cap rate
0.5%
Rent to Value Ratio
Active
$900,000
4
bds
|
4
ba
|
3,698
sqft
|
built
2015
2050 Vineyard Dr, Windsor, CO 80550
$-3,406
Cash flow
-19.7%
Cash-on-Cash Return
1.7%
Cap rate
0.3%
Rent to Value Ratio
Active
$407,000
2
bds
|
2
ba
|
1,179
sqft
|
built
2022
1788 Iron Wheel Dr, Windsor, CO 80550
$-1,255
Cash flow
-16.1%
Cash-on-Cash Return
2.6%
Cap rate
0.5%
Rent to Value Ratio
Active
$820,000
4
bds
|
4
ba
|
3,384
sqft
|
built
2000
5442 Tiller Ct, Windsor, CO 80528
$-2,273
Cash flow
-14.5%
Cash-on-Cash Return
2.9%
Cap rate
0.4%
Rent to Value Ratio
Active
$699,900
4
bds
|
3
ba
|
2,728
sqft
|
built
2000
116 Cobble Ct, Windsor, CO 80550
$-1,652
Cash flow
-12.3%
Cash-on-Cash Return
3.4%
Cap rate
0.5%
Rent to Value Ratio
Active
$775,000
5
bds
|
4
ba
|
3,448
sqft
|
built
2023
5544 Shady Oaks Dr, Windsor, CO 80528
$-1,887
Cash flow
-12.7%
Cash-on-Cash Return
3.3%
Cap rate
0.5%
Rent to Value Ratio
Active
$475,000
2
bds
|
2
ba
|
1,419
sqft
|
built
2016
1604 Sorenson Dr, Windsor, CO 80550
$-1,009
Cash flow
-11.1%
Cash-on-Cash Return
3.7%
Cap rate
0.5%
Rent to Value Ratio
Active
$1,225,000
3
bds
|
4
ba
|
3,896
sqft
|
built
2002
8943 Gander Valley Ln, Windsor, CO 80550
$-4,433
Cash flow
-18.9%
Cash-on-Cash Return
1.9%
Cap rate
0.3%
Rent to Value Ratio
Active
$659,000
6
bds
|
4
ba
|
2,726
sqft
|
built
2012
189 Kitty Hawk Ct, Windsor, CO 80550
$-1,844
Cash flow
-14.6%
Cash-on-Cash Return
2.9%
Cap rate
0.4%
Rent to Value Ratio
Active
$825,000
4
bds
|
4
ba
|
3,480
sqft
|
built
2014
8199 White Owl Ct, Windsor, CO 80550
$-2,430
Cash flow
-15.4%
Cash-on-Cash Return
2.7%
Cap rate
0.4%
Rent to Value Ratio
Active
$1,125,000
6
bds
|
4
ba
|
3,848
sqft
|
built
1971
7790 County Road 72, Windsor, CO 80550
$-2,837
Cash flow
-13.2%
Cash-on-Cash Return
3.2%
Cap rate
0.4%
Rent to Value Ratio
Active
$1,155,000
5
bds
|
3
ba
|
3,656
sqft
|
built
2014
6747 Murano Ct, Windsor, CO 80550
$-4,460
Cash flow
-20.1%
Cash-on-Cash Return
1.6%
Cap rate
0.3%
Rent to Value Ratio
Active
$699,000
5
bds
|
4
ba
|
3,776
sqft
|
built
2016
830 Corn Stalk Dr, Windsor, CO 80550
$-1,709
Cash flow
-12.8%
Cash-on-Cash Return
3.3%
Cap rate
0.5%
Rent to Value Ratio
Active
$799,900
4
bds
|
4
ba
|
3,788
sqft
|
built
2009
641 Denali Ct, Windsor, CO 80550
$-2,461
Cash flow
-16.1%
Cash-on-Cash Return
2.6%
Cap rate
0.4%
Rent to Value Ratio
Active
$499,000
3
bds
|
2
ba
|
1,319
sqft
|
built
2021
1766 Country Sun Dr, Windsor, CO 80550
$-1,162
Cash flow
-12.1%
Cash-on-Cash Return
3.5%
Cap rate
0.5%
Rent to Value Ratio
Active
$445,000
3
bds
|
2
ba
|
1,365
sqft
|
built
2020
6556 Crystal Downs Dr, Windsor, CO 80550
$-1,306
Cash flow
-15.3%
Cash-on-Cash Return
2.7%
Cap rate
0.6%
Rent to Value Ratio
Active
$899,000
6
bds
|
4
ba
|
4,128
sqft
|
built
2012
8101 Wynstone Dr, Windsor, CO 80550
$-2,598
Cash flow
-15.1%
Cash-on-Cash Return
2.8%
Cap rate
0.4%
Rent to Value Ratio
Active
$875,000
3
bds
|
3
ba
|
3,900
sqft
|
built
2015
2038 Vineyard Dr, Windsor, CO 80550
$-3,266
Cash flow
-19.5%
Cash-on-Cash Return
1.8%
Cap rate
0.3%
Rent to Value Ratio
Active
$695,000
3
bds
|
3
ba
|
2,456
sqft
|
built
1999
1421 Canal Dr, Windsor, CO 80550
$-2,039
Cash flow
-15.3%
Cash-on-Cash Return
2.7%
Cap rate
0.4%
Rent to Value Ratio
Active
$269,000
2
bds
|
2
ba
|
928
sqft
|
built
1971
707 3rd St, Windsor, CO 80550
$-701
Cash flow
-13.6%
Cash-on-Cash Return
3.1%
Cap rate
0.6%
Rent to Value Ratio