Windsor, CO Investment Properties for Sale
Browse homes for sale and investment properties in Windsor, CO. Refine your search by price, property type, or more.
Best cash flowing properties in Windsor, CO
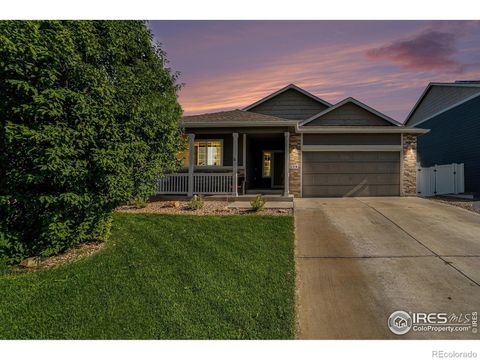
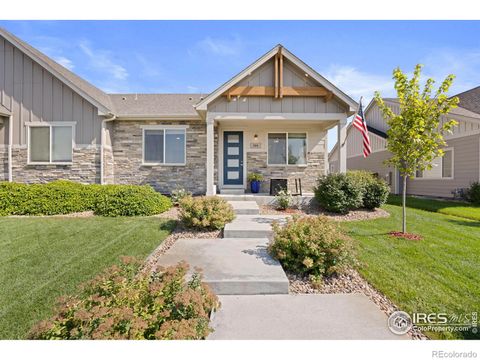
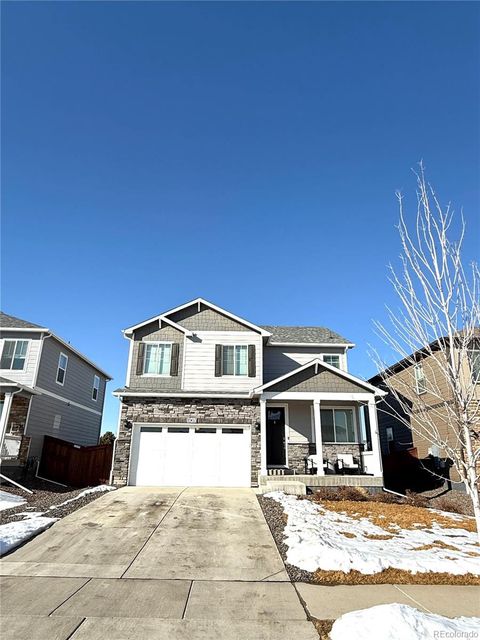
Active
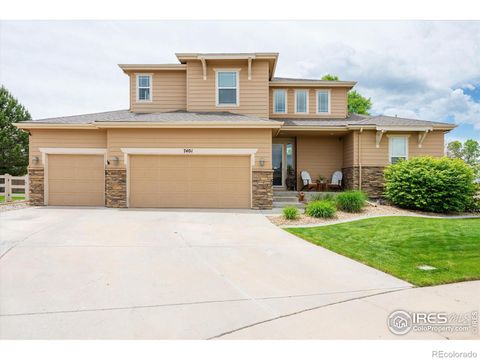
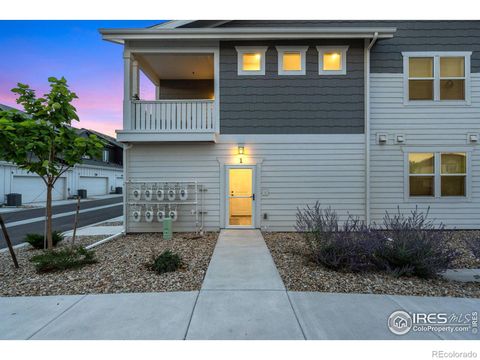
$269,900
2
bds
|
1
ba
|
826
sqft
|
built
1980
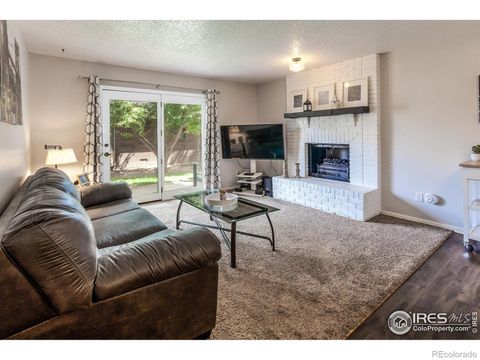
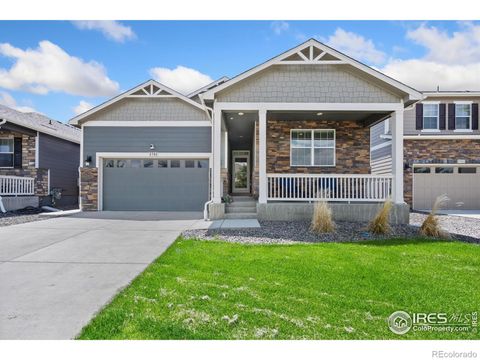
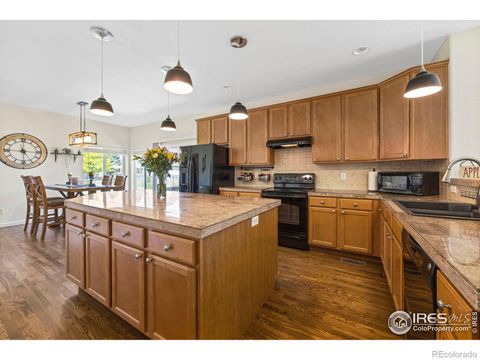
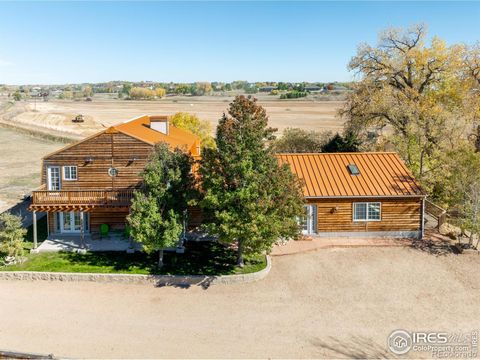
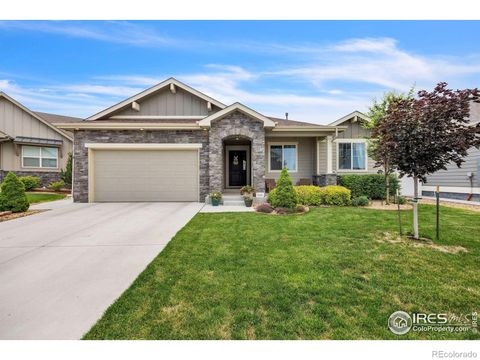
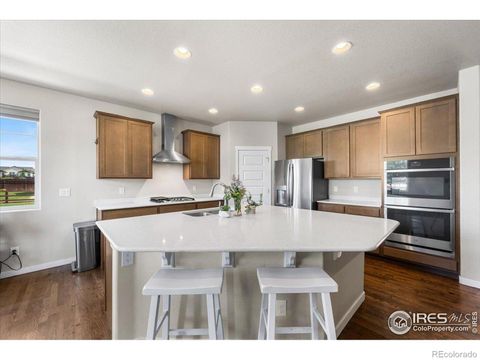
909 Conifer Ct, Windsor, CO 80550
$-457
Cash flow
-8.8%
Cash-on-Cash Return
3.6%
Cap rate
0.7%
Rent to Value Ratio
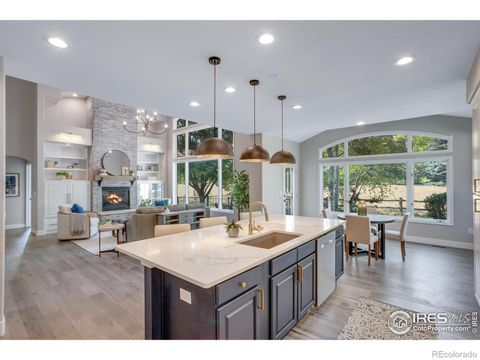
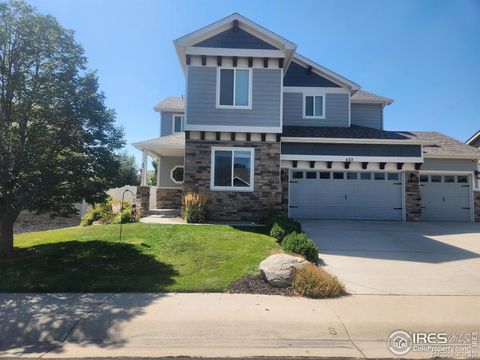
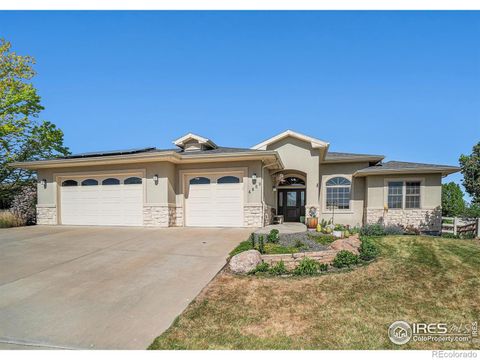
Active
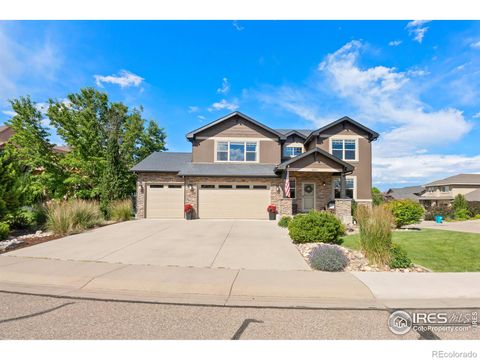
$495,000
3
bds
|
3
ba
|
1,790
sqft
|
built
2020
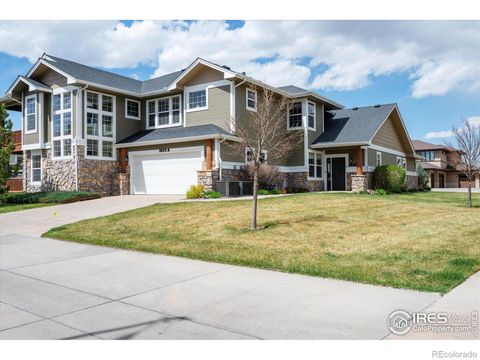
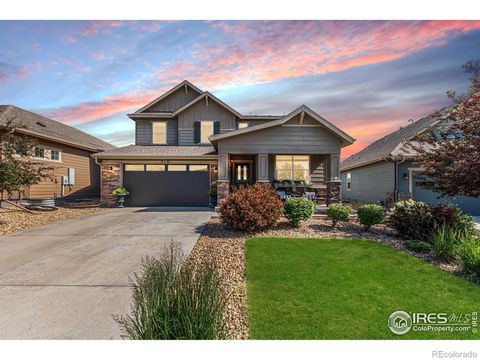
1781 Summer Bloom Dr, Windsor, CO 80550
$-744
Cash flow
-7.8%
Cash-on-Cash Return
3.9%
Cap rate
0.6%
Rent to Value Ratio
141 out of 155 properties for sale in Windsor, CO
Limited Results Shown
Create a free account, or log in to reveal all property listings and enjoy the complete experience.
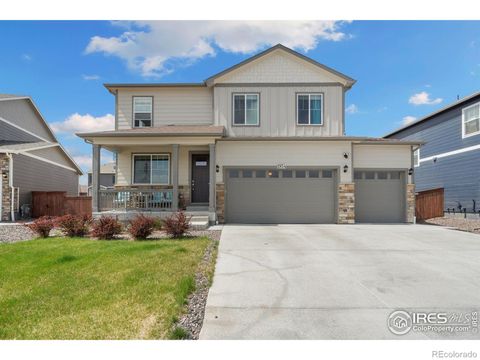
Active
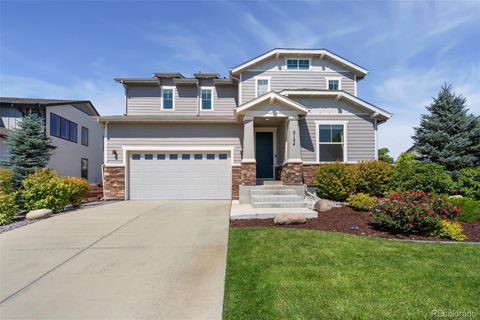
$420,000
2
bds
|
3
ba
|
1,522
sqft
|
built
2016
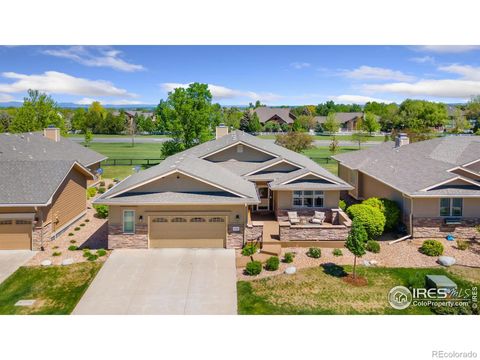
2167 Montauk Ln, Windsor, CO 80550
$-991
Cash flow
-12.3%
Cash-on-Cash Return
2.8%
Cap rate
0.5%
Rent to Value Ratio
Active
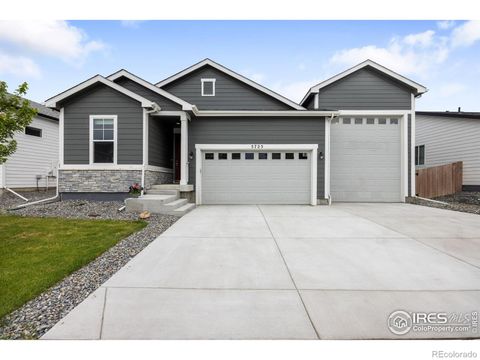
$759,000
4
bds
|
3
ba
|
2,772
sqft
|
built
2006
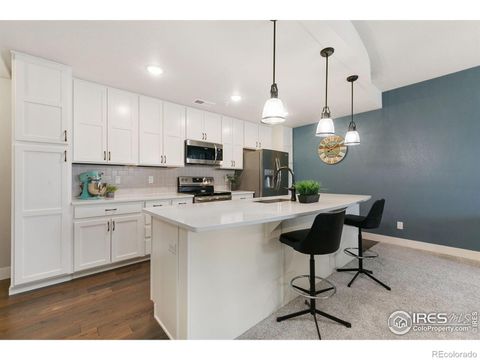
453 Harbor Ct, Windsor, CO 80550
$-1,730
Cash flow
-11.9%
Cash-on-Cash Return
2.9%
Cap rate
0.5%
Rent to Value Ratio
Active
$670,000
3
bds
|
3
ba
|
2,182
sqft
|
built
2011
7401 Pimlico Dr, Windsor, CO 80550
$-1,337
Cash flow
-10.4%
Cash-on-Cash Return
3.3%
Cap rate
0.5%
Rent to Value Ratio
Active
$899,900
4
bds
|
4
ba
|
3,251
sqft
|
built
2020
6712 Olympia Fields Ct, Windsor, CO 80550
$-2,175
Cash flow
-12.6%
Cash-on-Cash Return
2.8%
Cap rate
0.4%
Rent to Value Ratio
Active
$825,000
7
bds
|
6
ba
|
6,041
sqft
|
built
2014
1997 Cayman Dr, Windsor, CO 80550
$-2,393
Cash flow
-15.1%
Cash-on-Cash Return
2.2%
Cap rate
0.4%
Rent to Value Ratio
Active
$650,000
5
bds
|
3
ba
|
2,770
sqft
|
built
2021
1576 Illingworth Dr, Windsor, CO 80550
$-1,319
Cash flow
-10.6%
Cash-on-Cash Return
3.2%
Cap rate
0.5%
Rent to Value Ratio

Active
$649,999
5
bds
|
3
ba
|
2,981
sqft
|
built
2020
4586 Binfield Dr, Windsor, CO 80550
$-1,587
Cash flow
-12.7%
Cash-on-Cash Return
2.7%
Cap rate
0.4%
Rent to Value Ratio
Active
$369,000
2
bds
|
2
ba
|
1,002
sqft
|
built
2020
6510 Crystal Downs Dr, Windsor, CO 80550
$-890
Cash flow
-12.6%
Cash-on-Cash Return
2.8%
Cap rate
0.6%
Rent to Value Ratio
Active
$475,500
3
bds
|
3
ba
|
1,648
sqft
|
built
2022
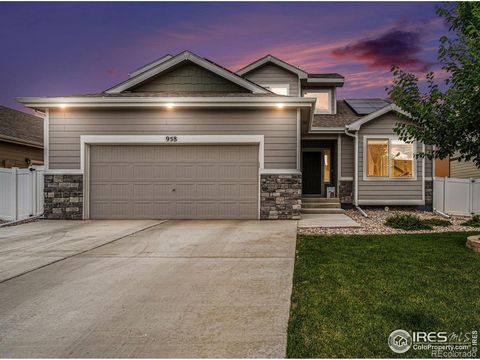
958 Greenbrook Dr, Windsor, CO 80550
$-945
Cash flow
-10.4%
Cash-on-Cash Return
3.3%
Cap rate
0.5%
Rent to Value Ratio
Active
$555,000
4
bds
|
3
ba
|
2,534
sqft
|
built
2017
2283 Stonefish Dr, Windsor, CO 80550
$-1,071
Cash flow
-10.1%
Cash-on-Cash Return
3.4%
Cap rate
0.5%
Rent to Value Ratio
Active
$709,000
4
bds
|
4
ba
|
2,980
sqft
|
built
1999
238 Wood Duck Ct, Windsor, CO 80550
$-1,612
Cash flow
-11.9%
Cash-on-Cash Return
3.0%
Cap rate
0.5%
Rent to Value Ratio
Active
$410,000
2
bds
|
2
ba
|
1,175
sqft
|
built
2023
1800 Iron Wheel Dr, Windsor, CO 80550
$-945
Cash flow
-12.0%
Cash-on-Cash Return
2.9%
Cap rate
0.5%
Rent to Value Ratio
Active
$809,500
5
bds
|
4
ba
|
3,433
sqft
|
built
2013
5504 Fairmount Dr, Windsor, CO 80550
$-2,074
Cash flow
-13.4%
Cash-on-Cash Return
2.6%
Cap rate
0.4%
Rent to Value Ratio
Active
$715,000
4
bds
|
4
ba
|
2,408
sqft
|
built
2020
2124 Glean Ct, Windsor, CO 80550
$-1,091
Cash flow
-8.0%
Cash-on-Cash Return
3.8%
Cap rate
0.6%
Rent to Value Ratio
Active
$590,000
3
bds
|
2
ba
|
1,726
sqft
|
built
2022
5725 Bay Hill Dr, Windsor, CO 80528
$-1,335
Cash flow
-11.8%
Cash-on-Cash Return
3.0%
Cap rate
0.5%
Rent to Value Ratio
Active
$475,000
3
bds
|
2
ba
|
1,453
sqft
|
built
2016
586 Cherryridge Dr, Windsor, CO 80550
$-915
Cash flow
-10.1%
Cash-on-Cash Return
3.4%
Cap rate
0.5%
Rent to Value Ratio
Active
$899,900
5
bds
|
4
ba
|
4,511
sqft
|
built
2000
2143 River West Dr, Windsor, CO 80550
$-1,989
Cash flow
-11.5%
Cash-on-Cash Return
3.0%
Cap rate
0.4%
Rent to Value Ratio
Active
$559,000
4
bds
|
3
ba
|
2,122
sqft
|
built
2022
1018 Kendalbrook Dr, Windsor, CO 80550
$-1,128
Cash flow
-10.5%
Cash-on-Cash Return
3.3%
Cap rate
0.5%
Rent to Value Ratio
Active
$948,900
4
bds
|
5
ba
|
2,658
sqft
|
built
2014
8181 Wynstone Dr, Windsor, CO 80550
$-2,596
Cash flow
-14.3%
Cash-on-Cash Return
2.4%
Cap rate
0.4%
Rent to Value Ratio
Active
$1,125,000
6
bds
|
4
ba
|
3,848
sqft
|
built
1971
7790 County Road 72, Windsor, CO 80550
$-2,288
Cash flow
-10.6%
Cash-on-Cash Return
3.2%
Cap rate
0.4%
Rent to Value Ratio
Active
$555,000
2
bds
|
3
ba
|
1,906
sqft
|
built
2007
1820 E Seadrift Dr, Windsor, CO 80550
$-1,474
Cash flow
-13.9%
Cash-on-Cash Return
2.5%
Cap rate
0.5%
Rent to Value Ratio
Active
$499,000
3
bds
|
2
ba
|
1,319
sqft
|
built
2021
1766 Country Sun Dr, Windsor, CO 80550
$-918
Cash flow
-9.6%
Cash-on-Cash Return
3.5%
Cap rate
0.5%
Rent to Value Ratio
Active
$830,000
4
bds
|
3
ba
|
2,693
sqft
|
built
2004
1591 Landon Ct, Windsor, CO 80550
$-1,691
Cash flow
-10.6%
Cash-on-Cash Return
3.2%
Cap rate
0.5%
Rent to Value Ratio
Active
$810,000
4
bds
|
3
ba
|
3,450
sqft
|
built
2019
1897 Holloway Dr, Windsor, CO 80550
$-2,089
Cash flow
-13.5%
Cash-on-Cash Return
2.6%
Cap rate
0.4%
Rent to Value Ratio
Active
$745,000
4
bds
|
4
ba
|
3,561
sqft
|
built
2009
641 Denali Ct, Windsor, CO 80550
$-1,811
Cash flow
-12.7%
Cash-on-Cash Return
2.8%
Cap rate
0.4%
Rent to Value Ratio
Active
$659,000
6
bds
|
4
ba
|
2,726
sqft
|
built
2012
189 Kitty Hawk Ct, Windsor, CO 80550
$-1,523
Cash flow
-12.1%
Cash-on-Cash Return
2.9%
Cap rate
0.4%
Rent to Value Ratio
Active
$407,000
2
bds
|
2
ba
|
1,179
sqft
|
built
2022
1788 Iron Wheel Dr, Windsor, CO 80550
$-1,056
Cash flow
-13.5%
Cash-on-Cash Return
2.6%
Cap rate
0.5%
Rent to Value Ratio
Active
$515,000
2
bds
|
2
ba
|
1,273
sqft
|
built
2019
244 Veronica Dr, Windsor, CO 80550
$-1,366
Cash flow
-13.8%
Cash-on-Cash Return
2.5%
Cap rate
0.4%
Rent to Value Ratio
Active
$699,900
5
bds
|
4
ba
|
3,400
sqft
|
built
2011
633 Shoshone Ct, Windsor, CO 80550
$-1,544
Cash flow
-11.5%
Cash-on-Cash Return
3.0%
Cap rate
0.5%
Rent to Value Ratio
Active
$740,000
5
bds
|
3
ba
|
3,127
sqft
|
built
2020
2057 Covered Bridge Pkwy, Windsor, CO 80550
$-1,943
Cash flow
-13.7%
Cash-on-Cash Return
2.5%
Cap rate
0.4%
Rent to Value Ratio
Active
$975,000
6
bds
|
4
ba
|
5,327
sqft
|
built
2014
1976 Cayman Dr, Windsor, CO 80550
$-2,242
Cash flow
-12.0%
Cash-on-Cash Return
2.9%
Cap rate
0.5%
Rent to Value Ratio
Active
$774,000
6
bds
|
5
ba
|
4,061
sqft
|
built
2019
2150 Crop Row Dr, Windsor, CO 80550
$-2,022
Cash flow
-13.6%
Cash-on-Cash Return
2.5%
Cap rate
0.4%
Rent to Value Ratio
Active
$799,900
5
bds
|
4
ba
|
3,008
sqft
|
built
2015
310 Baja Dr, Windsor, CO 80550
$-1,815
Cash flow
-11.8%
Cash-on-Cash Return
3.0%
Cap rate
0.5%
Rent to Value Ratio
Active
$795,000
3
bds
|
3
ba
|
3,066
sqft
|
built
2006
6728 Spanish Bay Dr, Windsor, CO 80550
$-2,201
Cash flow
-14.4%
Cash-on-Cash Return
2.4%
Cap rate
0.4%
Rent to Value Ratio
Active
$355,000
1
bds
|
1
ba
|
938
sqft
|
built
2019
6582 Crystal Downs Dr, Windsor, CO 80550
$-921
Cash flow
-13.5%
Cash-on-Cash Return
2.6%
Cap rate
0.6%
Rent to Value Ratio
Active
$569,999
4
bds
|
3
ba
|
2,180
sqft
|
built
2021
1903 Rolling Wind Dr, Windsor, CO 80550
$-997
Cash flow
-9.1%
Cash-on-Cash Return
3.6%
Cap rate
0.5%
Rent to Value Ratio
Active
$839,000
4
bds
|
3
ba
|
3,594
sqft
|
built
2009
4609 Freehold Dr, Windsor, CO 80550
$-1,897
Cash flow
-11.8%
Cash-on-Cash Return
3.0%
Cap rate
0.4%
Rent to Value Ratio
Active
$610,000
3
bds
|
3
ba
|
2,278
sqft
|
built
2021
1954 Covered Bridge Pkwy, Windsor, CO 80550
$-1,111
Cash flow
-9.5%
Cash-on-Cash Return
3.5%
Cap rate
0.5%
Rent to Value Ratio