Windsor, CO Investment Properties for Sale
Browse homes for sale and investment properties in Windsor, CO. Refine your search by price, property type, or more.
Best cash flowing properties in Windsor, CO
Active
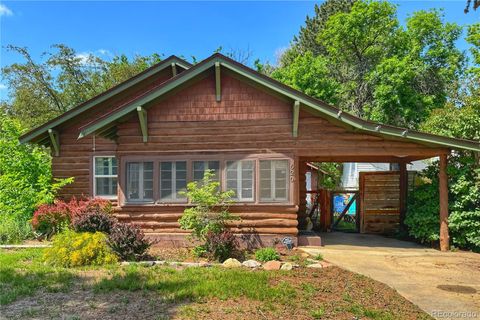
$385,000
2
bds
|
1
ba
|
880
sqft
|
built
1928
620 Walnut St, Windsor, CO 80550
$-481
Cash flow
-6.5%
Cash-on-Cash Return
4.2%
Cap rate
0.6%
Rent to Value Ratio
Active
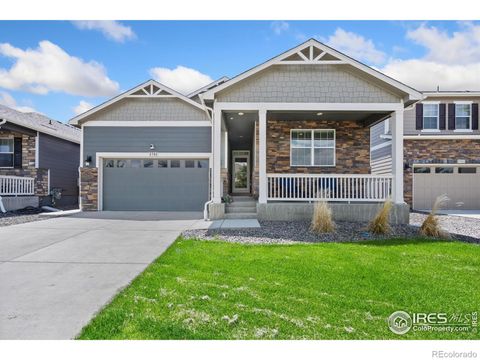
$495,000
3
bds
|
3
ba
|
1,790
sqft
|
built
2020
1781 Summer Bloom Dr, Windsor, CO 80550
$-744
Cash flow
-7.8%
Cash-on-Cash Return
3.9%
Cap rate
0.6%
Rent to Value Ratio
187 out of 200 properties for sale in Windsor, CO
Limited Results Shown
Create a free account, or log in to reveal all property listings and enjoy the complete experience.
Active
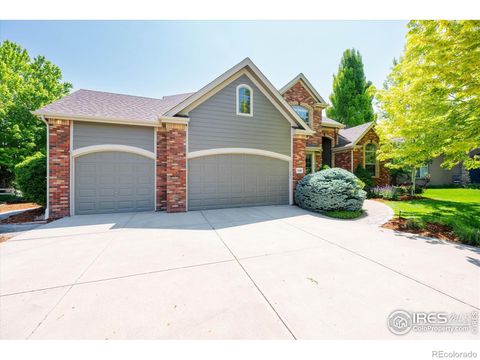
$1,050,000
5
bds
|
4
ba
|
4,947
sqft
|
built
2004
8416 Starfish Ct, Windsor, CO 80528
$-2,171
Cash flow
-10.8%
Cash-on-Cash Return
3.2%
Cap rate
0.5%
Rent to Value Ratio
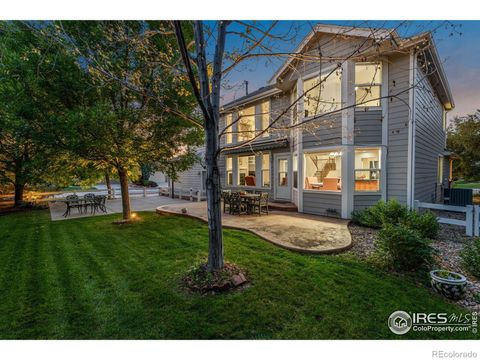
Active
$825,000
6
bds
|
5
ba
|
4,108
sqft
|
built
2005
8383 Castaway Dr, Windsor, CO 80528
$-2,027
Cash flow
-12.8%
Cash-on-Cash Return
3.3%
Cap rate
0.5%
Rent to Value Ratio
Active
$388,000
2
bds
|
2
ba
|
1,383
sqft
|
built
2022
2290 Setting Sun Dr, Windsor, CO 80550
$-958
Cash flow
-12.9%
Cash-on-Cash Return
3.3%
Cap rate
0.6%
Rent to Value Ratio
Active
$979,000
7
bds
|
6
ba
|
6,132
sqft
|
built
2017
2163 Longfin Dr, Windsor, CO 80550
$-3,594
Cash flow
-19.2%
Cash-on-Cash Return
1.9%
Cap rate
0.3%
Rent to Value Ratio
Active
$863,000
4
bds
|
3
ba
|
3,594
sqft
|
built
2009
4609 Freehold Dr, Windsor, CO 80550
$-2,432
Cash flow
-14.7%
Cash-on-Cash Return
2.9%
Cap rate
0.4%
Rent to Value Ratio

Active
$685,000
5
bds
|
4
ba
|
3,338
sqft
|
built
2016
848 Shirttail Peak Dr, Windsor, CO 80550
$-1,879
Cash flow
-14.3%
Cash-on-Cash Return
3.0%
Cap rate
0.5%
Rent to Value Ratio
Active
$749,000
5
bds
|
4
ba
|
3,787
sqft
|
built
2000
112 Cobble Ct, Windsor, CO 80550
$-1,957
Cash flow
-13.6%
Cash-on-Cash Return
3.1%
Cap rate
0.5%
Rent to Value Ratio
Active
$875,000
4
bds
|
3
ba
|
2,830
sqft
|
built
2004
1578 Landon Ct, Windsor, CO 80550
$-1,923
Cash flow
-11.5%
Cash-on-Cash Return
3.6%
Cap rate
0.4%
Rent to Value Ratio
Active
$995,000
6
bds
|
4
ba
|
5,327
sqft
|
built
2014
1976 Cayman Dr, Windsor, CO 80550
$-2,823
Cash flow
-14.8%
Cash-on-Cash Return
2.9%
Cap rate
0.4%
Rent to Value Ratio
Active
$529,500
3
bds
|
2
ba
|
1,540
sqft
|
built
2020
1867 Abundance Dr, Windsor, CO 80550
$-1,189
Cash flow
-11.7%
Cash-on-Cash Return
3.6%
Cap rate
0.5%
Rent to Value Ratio
Active
$825,000
3
bds
|
3
ba
|
3,066
sqft
|
built
2006
6728 Spanish Bay Dr, Windsor, CO 80550
$-2,746
Cash flow
-17.4%
Cash-on-Cash Return
2.3%
Cap rate
0.4%
Rent to Value Ratio
Active
$335,000
1
bds
|
1
ba
|
971
sqft
|
built
2019
6634 Crystal Downs Dr, Windsor, CO 80550
$-848
Cash flow
-13.2%
Cash-on-Cash Return
3.2%
Cap rate
0.7%
Rent to Value Ratio
Active
$1,350,000
4
bds
|
5
ba
|
4,815
sqft
|
built
2004
1426 Bison Run Dr, Windsor, CO 80550
$-3,939
Cash flow
-15.2%
Cash-on-Cash Return
2.8%
Cap rate
0.4%
Rent to Value Ratio
Active
$1,000,000
5
bds
|
4
ba
|
3,905
sqft
|
built
2022
346 Blue Fortune Dr, Windsor, CO 80550
$-2,014
Cash flow
-10.5%
Cash-on-Cash Return
3.8%
Cap rate
0.5%
Rent to Value Ratio
Active
$1,035,000
4
bds
|
3
ba
|
3,158
sqft
|
built
2021
2025 Orchard Bloom Dr, Windsor, CO 80550
$-3,533
Cash flow
-17.8%
Cash-on-Cash Return
2.2%
Cap rate
0.3%
Rent to Value Ratio
Active
$610,000
3
bds
|
3
ba
|
2,278
sqft
|
built
2021
1954 Covered Bridge Pkwy, Windsor, CO 80550
$-1,409
Cash flow
-12.1%
Cash-on-Cash Return
3.5%
Cap rate
0.5%
Rent to Value Ratio
Active
$1,030,000
5
bds
|
5
ba
|
5,009
sqft
|
built
2005
6582 Spanish Bay Dr, Windsor, CO 80550
$-2,848
Cash flow
-14.4%
Cash-on-Cash Return
2.4%
Cap rate
0.4%
Rent to Value Ratio
Active
$750,000
3
bds
|
2
ba
|
1,816
sqft
|
built
1948
35779 County Road 21, Windsor, CO 80550
$-2,050
Cash flow
-14.3%
Cash-on-Cash Return
2.4%
Cap rate
0.3%
Rent to Value Ratio
Active
$820,000
5
bds
|
4
ba
|
3,008
sqft
|
built
2015
310 Baja Dr, Windsor, CO 80550
$-1,910
Cash flow
-12.2%
Cash-on-Cash Return
2.9%
Cap rate
0.4%
Rent to Value Ratio
Active
$514,900
4
bds
|
4
ba
|
2,847
sqft
|
built
2001
128 Bayside Cir, Windsor, CO 80550
$-1,465
Cash flow
-14.8%
Cash-on-Cash Return
2.9%
Cap rate
0.5%
Rent to Value Ratio
Active
$599,900
6
bds
|
4
ba
|
3,016
sqft
|
built
2012
548 Dakota Way, Windsor, CO 80550
$-1,559
Cash flow
-13.6%
Cash-on-Cash Return
3.1%
Cap rate
0.5%
Rent to Value Ratio
Active
$510,000
5
bds
|
3
ba
|
2,542
sqft
|
built
1998
404 Meadow Dr, Windsor, CO 80550
$-1,174
Cash flow
-12.0%
Cash-on-Cash Return
3.5%
Cap rate
0.5%
Rent to Value Ratio
Active
$1,200,000
5
bds
|
5
ba
|
4,126
sqft
|
built
2022
1716 Branching Canopy Dr, Windsor, CO 80550
$-4,181
Cash flow
-18.2%
Cash-on-Cash Return
2.1%
Cap rate
0.3%
Rent to Value Ratio
Active
$505,000
4
bds
|
3
ba
|
2,103
sqft
|
built
1998
304 Hemlock Dr, Windsor, CO 80550
$-1,111
Cash flow
-11.5%
Cash-on-Cash Return
3.6%
Cap rate
0.5%
Rent to Value Ratio
Active
$834,000
4
bds
|
5
ba
|
3,458
sqft
|
built
2020
2096 Glean Dr, Windsor, CO 80550
$-2,405
Cash flow
-15.0%
Cash-on-Cash Return
2.8%
Cap rate
0.4%
Rent to Value Ratio
Active
$425,000
2
bds
|
2
ba
|
1,394
sqft
|
built
2022
1805 Bounty Dr, Windsor, CO 80550
$-1,134
Cash flow
-13.9%
Cash-on-Cash Return
3.1%
Cap rate
0.6%
Rent to Value Ratio
Active
$565,000
3
bds
|
2
ba
|
1,583
sqft
|
built
2022
5483 Shadow Creek Ct, Windsor, CO 80528
$-1,460
Cash flow
-13.5%
Cash-on-Cash Return
3.2%
Cap rate
0.5%
Rent to Value Ratio
Active
$669,500
4
bds
|
3
ba
|
2,611
sqft
|
built
2020
2093 Gather Ct, Windsor, CO 80550
$-1,767
Cash flow
-13.8%
Cash-on-Cash Return
3.1%
Cap rate
0.5%
Rent to Value Ratio
Active
$525,000
4
bds
|
3
ba
|
1,775
sqft
|
built
2019
1848 Castle Hill Dr, Windsor, CO 80550
$-1,177
Cash flow
-11.7%
Cash-on-Cash Return
3.6%
Cap rate
0.5%
Rent to Value Ratio
Active
$785,000
4
bds
|
4
ba
|
3,661
sqft
|
built
2007
1879 Seadrift Dr, Windsor, CO 80550
$-2,448
Cash flow
-16.3%
Cash-on-Cash Return
2.5%
Cap rate
0.4%
Rent to Value Ratio
Active
$530,000
4
bds
|
3
ba
|
2,364
sqft
|
built
1995
1202 Creekwood Ct, Windsor, CO 80550
$-1,126
Cash flow
-11.1%
Cash-on-Cash Return
3.7%
Cap rate
0.5%
Rent to Value Ratio
Active
$599,000
3
bds
|
2
ba
|
1,708
sqft
|
built
2012
129 Tidewater Dr, Windsor, CO 80550
$-1,475
Cash flow
-12.8%
Cash-on-Cash Return
3.3%
Cap rate
0.5%
Rent to Value Ratio
Active
$500,000
3
bds
|
3
ba
|
2,210
sqft
|
built
2004
1403 Boardwalk Dr, Windsor, CO 80550
$-1,380
Cash flow
-14.4%
Cash-on-Cash Return
3.0%
Cap rate
0.5%
Rent to Value Ratio
Active
$630,000
4
bds
|
4
ba
|
2,411
sqft
|
built
1999
1108 Basin Ct, Windsor, CO 80550
$-1,592
Cash flow
-13.2%
Cash-on-Cash Return
3.2%
Cap rate
0.4%
Rent to Value Ratio
Active
$1,349,900
5
bds
|
6
ba
|
3,662
sqft
|
built
2022
1720 Branching Canopy Dr, Windsor, CO 80550
$-5,002
Cash flow
-19.3%
Cash-on-Cash Return
1.8%
Cap rate
0.3%
Rent to Value Ratio
Active
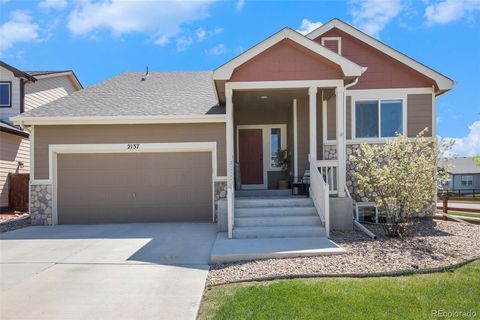
$510,000
3
bds
|
3
ba
|
1,604
sqft
|
built
2019
2137 Day Spring Dr, Windsor, CO 80550
$-1,117
Cash flow
-11.4%
Cash-on-Cash Return
3.6%
Cap rate
0.5%
Rent to Value Ratio
Active
$579,000
4
bds
|
4
ba
|
2,520
sqft
|
built
2022
597 Red Jewel Dr, Windsor, CO 80550
$-1,473
Cash flow
-13.3%
Cash-on-Cash Return
3.2%
Cap rate
0.5%
Rent to Value Ratio
Active
$970,000
4
bds
|
4
ba
|
2,700
sqft
|
built
2011
6682 Crooked Stick Dr, Windsor, CO 80550
$-3,192
Cash flow
-17.2%
Cash-on-Cash Return
2.3%
Cap rate
0.4%
Rent to Value Ratio