Windsor, CO Investment Properties for Sale
Browse homes for sale and investment properties in Windsor, CO. Refine your search by price, property type, or more.
Best cash flowing properties in Windsor, CO
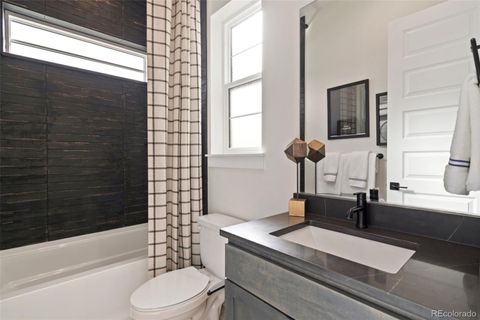
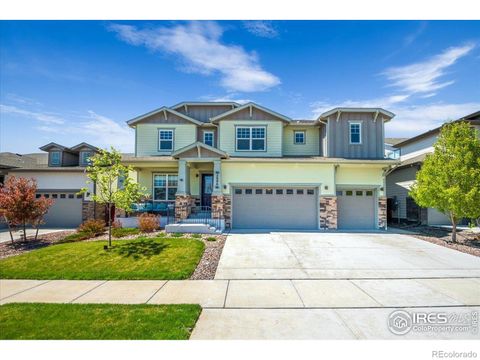
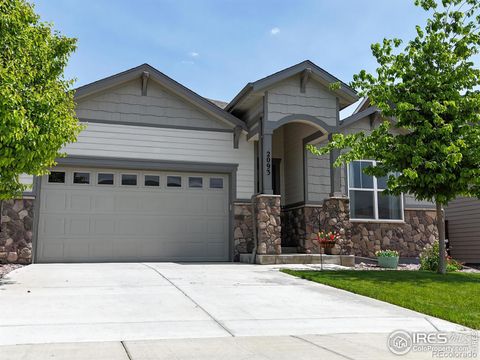
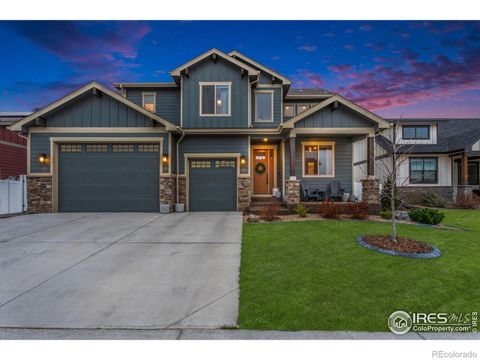
Active
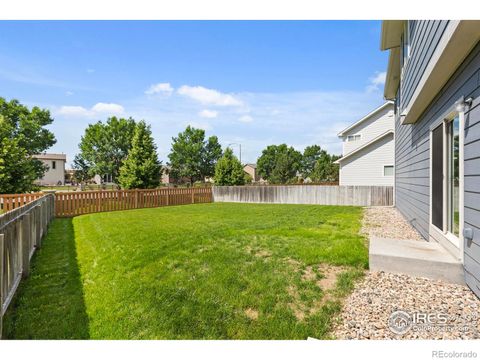
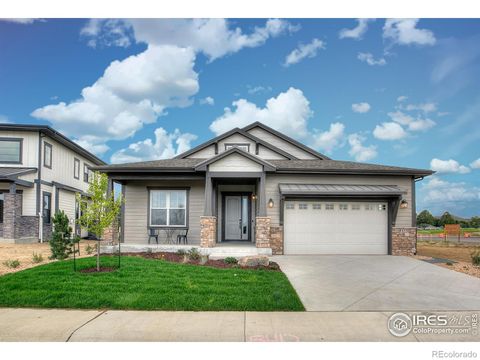
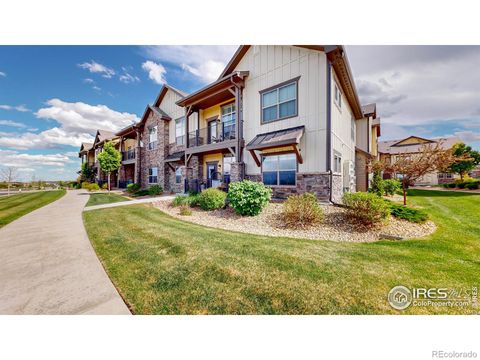
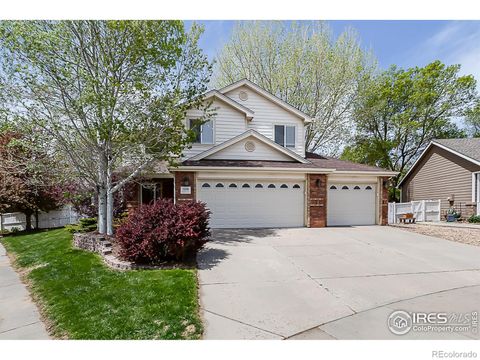
$490,000
3
bds
|
2
ba
|
1,705
sqft
|
built
2010
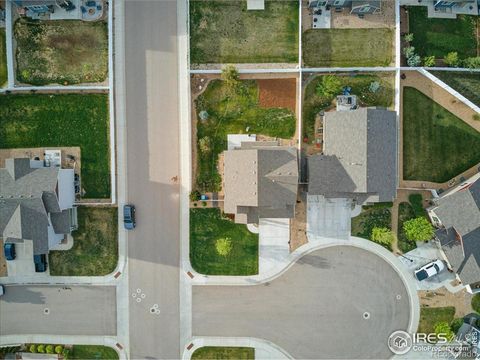
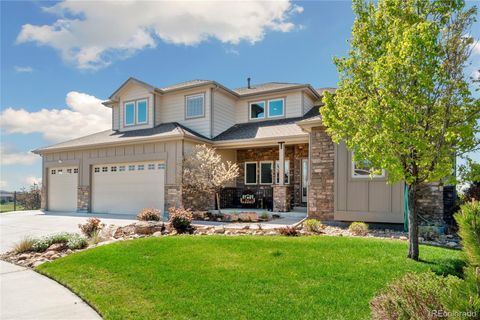
1587 Edenbridge Dr, Windsor, CO 80550
$-935
Cash flow
-10.0%
Cash-on-Cash Return
4.0%
Cap rate
0.6%
Rent to Value Ratio
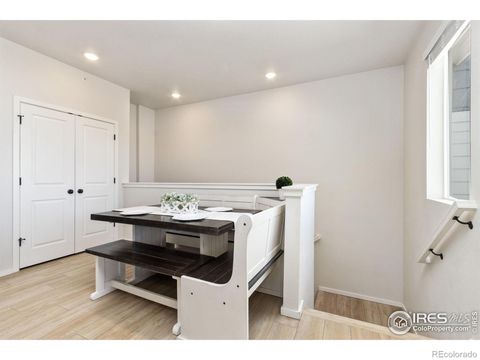
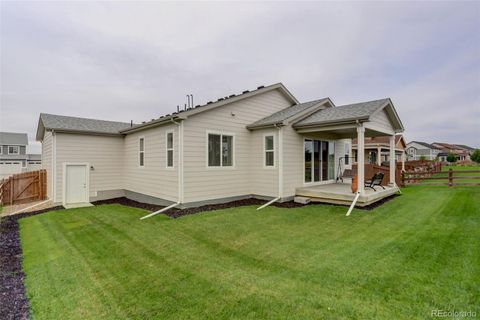
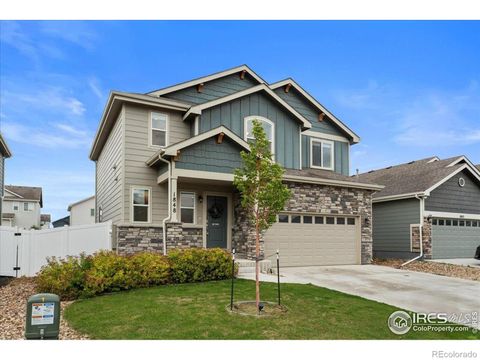
Active
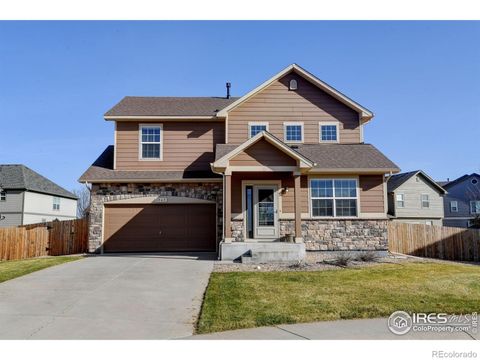
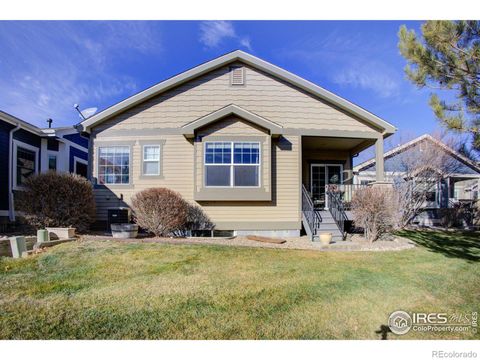
$489,900
3
bds
|
4
ba
|
2,300
sqft
|
built
2012
1565 Harpendon Ct, Windsor, CO 80550
$-969
Cash flow
-10.3%
Cash-on-Cash Return
3.9%
Cap rate
0.6%
Rent to Value Ratio
157 out of 169 properties for sale in Windsor, CO
Limited Results Shown
Create a free account, or log in to reveal all property listings and enjoy the complete experience.
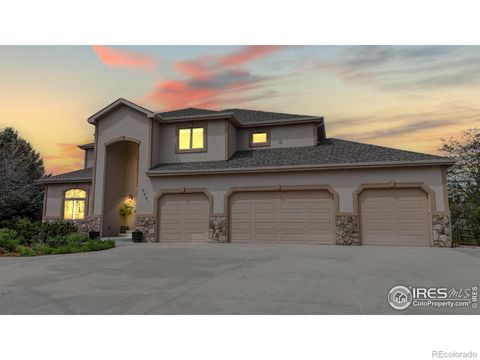
Active
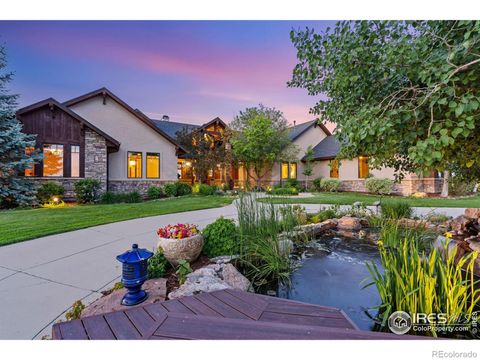
$3,650,000
6
bds
|
7
ba
|
9,378
sqft
|
built
2006
8236 County Road 74, Windsor, CO 80550
$-15,627
Cash flow
-22.3%
Cash-on-Cash Return
1.1%
Cap rate
0.2%
Rent to Value Ratio
Active
$350,000
2
bds
|
2
ba
|
1,529
sqft
|
built
2006
2178 Cape Hatteras Dr, Windsor, CO 80550
$-1,010
Cash flow
-15.1%
Cash-on-Cash Return
2.8%
Cap rate
0.6%
Rent to Value Ratio
Active
$643,900
5
bds
|
4
ba
|
3,051
sqft
|
built
2017
5816 Osbourne Ct, Windsor, CO 80550
$-1,591
Cash flow
-12.9%
Cash-on-Cash Return
3.3%
Cap rate
0.5%
Rent to Value Ratio
Active
$1,379,000
4
bds
|
5
ba
|
4,864
sqft
|
built
2015
5954 Black Lion Ct, Windsor, CO 80550
$-5,112
Cash flow
-19.3%
Cash-on-Cash Return
1.8%
Cap rate
0.3%
Rent to Value Ratio
Active
$715,000
4
bds
|
3
ba
|
2,520
sqft
|
built
2021
1746 Long Shadow Dr, Windsor, CO 80550
$-1,789
Cash flow
-13.1%
Cash-on-Cash Return
3.3%
Cap rate
0.5%
Rent to Value Ratio
Active
$415,000
2
bds
|
2
ba
|
1,395
sqft
|
built
2021
2078 Autumn Moon Dr, Windsor, CO 80550
$-1,326
Cash flow
-16.7%
Cash-on-Cash Return
2.4%
Cap rate
0.5%
Rent to Value Ratio
Active
$839,000
4
bds
|
4
ba
|
3,209
sqft
|
built
2020
8412 Cromwell Cir, Windsor, CO 80528
$-2,315
Cash flow
-14.4%
Cash-on-Cash Return
3.0%
Cap rate
0.5%
Rent to Value Ratio
Active
$635,000
2
bds
|
3
ba
|
3,209
sqft
|
built
2010
1515 Waterfront Dr, Windsor, CO 80550
$-1,814
Cash flow
-14.9%
Cash-on-Cash Return
2.8%
Cap rate
0.5%
Rent to Value Ratio
Active
$495,000
3
bds
|
2
ba
|
1,453
sqft
|
built
2018
1484 First Light Dr, Windsor, CO 80550
$-970
Cash flow
-10.2%
Cash-on-Cash Return
3.9%
Cap rate
0.6%
Rent to Value Ratio
Active
$1,225,000
3
bds
|
4
ba
|
3,137
sqft
|
built
2017
2147 Picture Pointe Dr, Windsor, CO 80550
$-2,776
Cash flow
-11.8%
Cash-on-Cash Return
3.0%
Cap rate
0.5%
Rent to Value Ratio
Active
$459,000
3
bds
|
2
ba
|
1,427
sqft
|
built
2018
6634 Crystal Downs Dr, Windsor, CO 80550
$-1,100
Cash flow
-12.5%
Cash-on-Cash Return
2.8%
Cap rate
0.6%
Rent to Value Ratio
Active
$999,000
6
bds
|
4
ba
|
4,241
sqft
|
built
2004
1443 Folsum Dr, Windsor, CO 80550
$-2,511
Cash flow
-13.1%
Cash-on-Cash Return
2.7%
Cap rate
0.4%
Rent to Value Ratio
Active
$599,900
6
bds
|
4
ba
|
3,016
sqft
|
built
2012
548 Dakota Way, Windsor, CO 80550
$-1,559
Cash flow
-13.6%
Cash-on-Cash Return
3.1%
Cap rate
0.5%
Rent to Value Ratio
Active
$510,000
5
bds
|
3
ba
|
2,542
sqft
|
built
1998
404 Meadow Dr, Windsor, CO 80550
$-1,174
Cash flow
-12.0%
Cash-on-Cash Return
3.5%
Cap rate
0.5%
Rent to Value Ratio
Active
$1,200,000
5
bds
|
5
ba
|
4,126
sqft
|
built
2022
1716 Branching Canopy Dr, Windsor, CO 80550
$-4,181
Cash flow
-18.2%
Cash-on-Cash Return
2.1%
Cap rate
0.3%
Rent to Value Ratio
Active
$834,000
4
bds
|
5
ba
|
3,458
sqft
|
built
2020
2096 Glean Dr, Windsor, CO 80550
$-2,405
Cash flow
-15.0%
Cash-on-Cash Return
2.8%
Cap rate
0.4%
Rent to Value Ratio
Active
$425,000
2
bds
|
2
ba
|
1,394
sqft
|
built
2022
1805 Bounty Dr, Windsor, CO 80550
$-1,134
Cash flow
-13.9%
Cash-on-Cash Return
3.1%
Cap rate
0.6%
Rent to Value Ratio
Active
$565,000
3
bds
|
2
ba
|
1,583
sqft
|
built
2022
5483 Shadow Creek Ct, Windsor, CO 80528
$-1,460
Cash flow
-13.5%
Cash-on-Cash Return
3.2%
Cap rate
0.5%
Rent to Value Ratio
Active
$669,500
4
bds
|
3
ba
|
2,611
sqft
|
built
2020
2093 Gather Ct, Windsor, CO 80550
$-1,767
Cash flow
-13.8%
Cash-on-Cash Return
3.1%
Cap rate
0.5%
Rent to Value Ratio
Active
$525,000
4
bds
|
3
ba
|
1,775
sqft
|
built
2019
1848 Castle Hill Dr, Windsor, CO 80550
$-1,177
Cash flow
-11.7%
Cash-on-Cash Return
3.6%
Cap rate
0.5%
Rent to Value Ratio
Active
$785,000
4
bds
|
4
ba
|
3,661
sqft
|
built
2007
1879 Seadrift Dr, Windsor, CO 80550
$-2,448
Cash flow
-16.3%
Cash-on-Cash Return
2.5%
Cap rate
0.4%
Rent to Value Ratio
Active
$599,000
3
bds
|
2
ba
|
1,708
sqft
|
built
2012
129 Tidewater Dr, Windsor, CO 80550
$-1,475
Cash flow
-12.8%
Cash-on-Cash Return
3.3%
Cap rate
0.5%
Rent to Value Ratio
Active
$630,000
4
bds
|
4
ba
|
2,411
sqft
|
built
1999
1108 Basin Ct, Windsor, CO 80550
$-1,592
Cash flow
-13.2%
Cash-on-Cash Return
3.2%
Cap rate
0.4%
Rent to Value Ratio
Active
$1,349,900
5
bds
|
6
ba
|
3,662
sqft
|
built
2022
1720 Branching Canopy Dr, Windsor, CO 80550
$-5,002
Cash flow
-19.3%
Cash-on-Cash Return
1.8%
Cap rate
0.3%
Rent to Value Ratio
Active
$579,000
4
bds
|
4
ba
|
2,520
sqft
|
built
2022
597 Red Jewel Dr, Windsor, CO 80550
$-1,473
Cash flow
-13.3%
Cash-on-Cash Return
3.2%
Cap rate
0.5%
Rent to Value Ratio
Active
$970,000
4
bds
|
4
ba
|
2,700
sqft
|
built
2011
6682 Crooked Stick Dr, Windsor, CO 80550
$-3,192
Cash flow
-17.2%
Cash-on-Cash Return
2.3%
Cap rate
0.4%
Rent to Value Ratio
Active
$795,000
5
bds
|
3
ba
|
2,669
sqft
|
built
2021
1646 Marbeck Dr, Windsor, CO 80550
$-2,476
Cash flow
-16.2%
Cash-on-Cash Return
2.5%
Cap rate
0.4%
Rent to Value Ratio
Active
$1,350,000
5
bds
|
5
ba
|
4,801
sqft
|
built
2005
8881 Longs Peak Cir, Windsor, CO 80550
$-3,862
Cash flow
-14.9%
Cash-on-Cash Return
2.8%
Cap rate
0.4%
Rent to Value Ratio
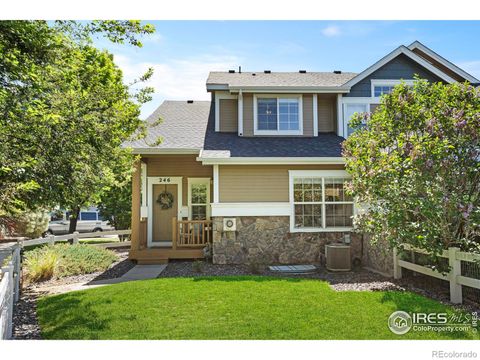
Active
$442,000
2
bds
|
4
ba
|
1,706
sqft
|
built
2000
246 Rock Bridge Ln, Windsor, CO 80550
$-1,323
Cash flow
-15.6%
Cash-on-Cash Return
2.7%
Cap rate
0.5%
Rent to Value Ratio
Active
$750,000
5
bds
|
3
ba
|
3,128
sqft
|
built
2021
2028 Moon Rise Dr, Windsor, CO 80550
$-2,275
Cash flow
-15.8%
Cash-on-Cash Return
2.6%
Cap rate
0.4%
Rent to Value Ratio

Active
$700,000
5
bds
|
4
ba
|
3,373
sqft
|
built
2012
641 Babine Ct, Windsor, CO 80550
$-2,054
Cash flow
-15.3%
Cash-on-Cash Return
2.7%
Cap rate
0.4%
Rent to Value Ratio
Active
$1,550,000
4
bds
|
4
ba
|
3,683
sqft
|
built
1996
7755 Valleyview Cir, Windsor, CO 80550
$-4,002
Cash flow
-13.5%
Cash-on-Cash Return
2.6%
Cap rate
0.4%
Rent to Value Ratio
Active
$490,000
3
bds
|
3
ba
|
2,344
sqft
|
built
1991
1250 Honeysuckle Ct, Windsor, CO 80550
$-1,240
Cash flow
-13.2%
Cash-on-Cash Return
2.6%
Cap rate
0.5%
Rent to Value Ratio
Active
$549,900
3
bds
|
3
ba
|
2,001
sqft
|
built
2018
5287 Clarence Dr, Windsor, CO 80550
$-1,065
Cash flow
-10.1%
Cash-on-Cash Return
3.4%
Cap rate
0.5%
Rent to Value Ratio
Active
$899,900
5
bds
|
4
ba
|
4,442
sqft
|
built
2016
8541 Allenbrook Dr, Windsor, CO 80550
$-2,420
Cash flow
-14.0%
Cash-on-Cash Return
2.5%
Cap rate
0.4%
Rent to Value Ratio