Windsor, CO Investment Properties for Sale
Browse homes for sale and investment properties in Windsor, CO. Refine your search by price, property type, or more.
Best cash flowing properties in Windsor, CO
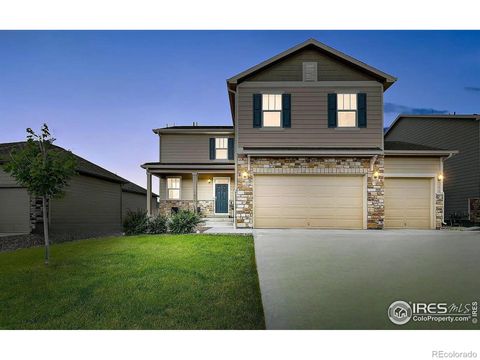
Active
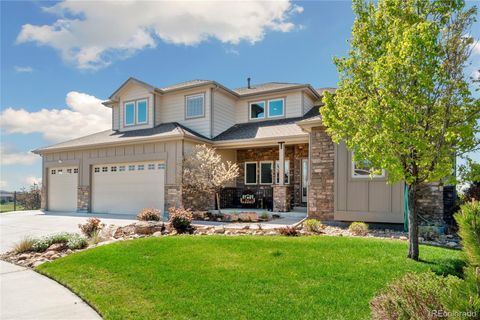
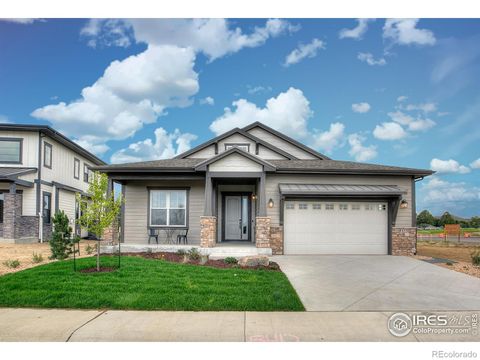
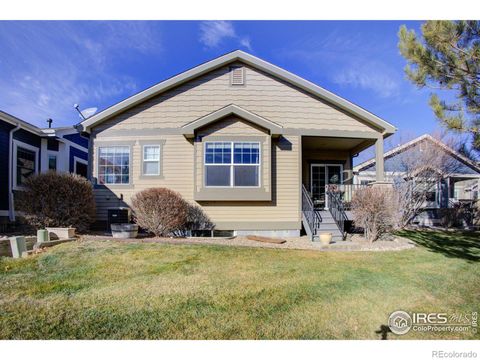
$439,000
4
bds
|
2
ba
|
1,863
sqft
|
built
2004
135 Beacon Way, Windsor, CO 80550
$-742
Cash flow
-8.8%
Cash-on-Cash Return
4.2%
Cap rate
0.6%
Rent to Value Ratio
Active
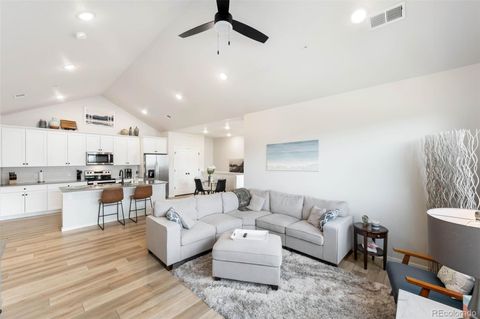
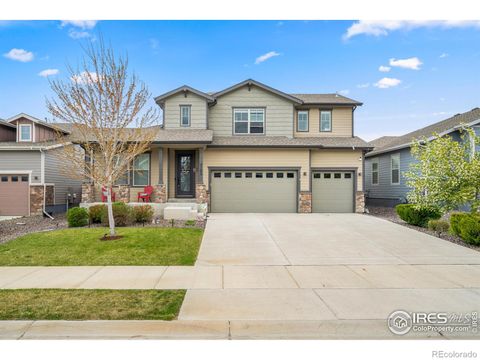
$370,000
2
bds
|
2
ba
|
1,132
sqft
|
built
2017
6690 Crystal Downs Dr, Windsor, CO 80550
$-879
Cash flow
-12.4%
Cash-on-Cash Return
3.4%
Cap rate
0.7%
Rent to Value Ratio
184 out of 224 properties for sale in Windsor, CO
Limited Results Shown
Create a free account, or log in to reveal all property listings and enjoy the complete experience.
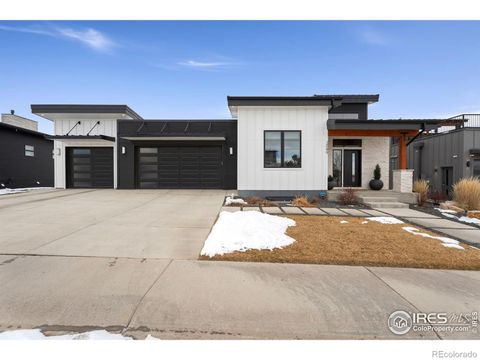
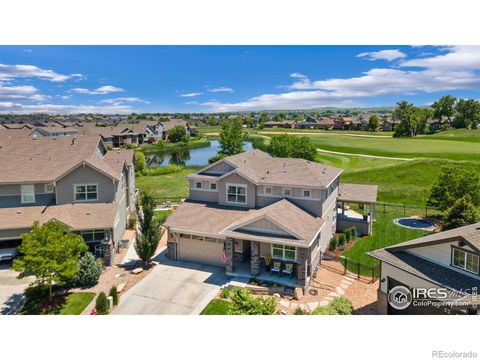
Active
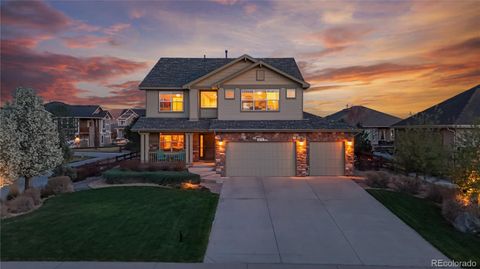
$795,000
5
bds
|
3
ba
|
2,669
sqft
|
built
2021
1646 Marbeck Dr, Windsor, CO 80550
$-2,476
Cash flow
-16.2%
Cash-on-Cash Return
2.5%
Cap rate
0.4%
Rent to Value Ratio
Active
$370,000
2
bds
|
2
ba
|
1,132
sqft
|
built
2017
6690 Crystal Downs Dr, Windsor, CO 80550
$-879
Cash flow
-12.4%
Cash-on-Cash Return
3.4%
Cap rate
0.7%
Rent to Value Ratio
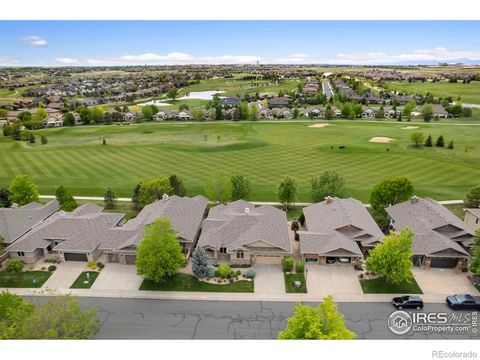
Active
$1,350,000
5
bds
|
5
ba
|
4,801
sqft
|
built
2005
8881 Longs Peak Cir, Windsor, CO 80550
$-3,862
Cash flow
-14.9%
Cash-on-Cash Return
2.8%
Cap rate
0.4%
Rent to Value Ratio
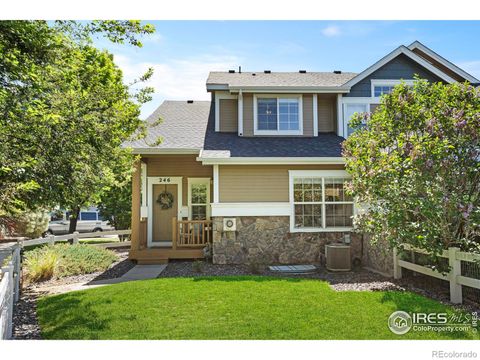
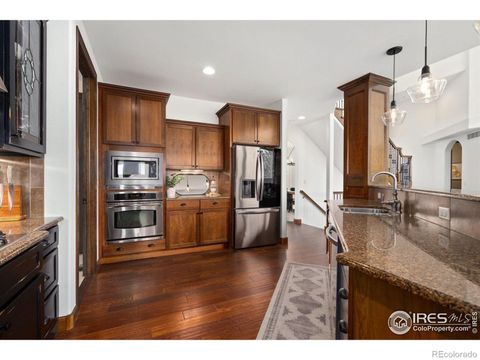
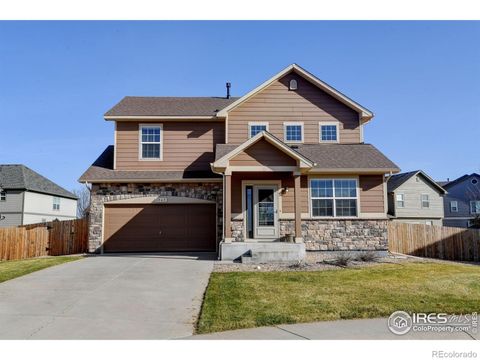
Active
$442,000
2
bds
|
4
ba
|
1,706
sqft
|
built
2000
246 Rock Bridge Ln, Windsor, CO 80550
$-1,323
Cash flow
-15.6%
Cash-on-Cash Return
2.7%
Cap rate
0.5%
Rent to Value Ratio

Active
$999,000
4
bds
|
5
ba
|
4,830
sqft
|
built
2013
2025 Seagrove Ct, Windsor, CO 80550
$-3,269
Cash flow
-17.1%
Cash-on-Cash Return
2.3%
Cap rate
0.4%
Rent to Value Ratio
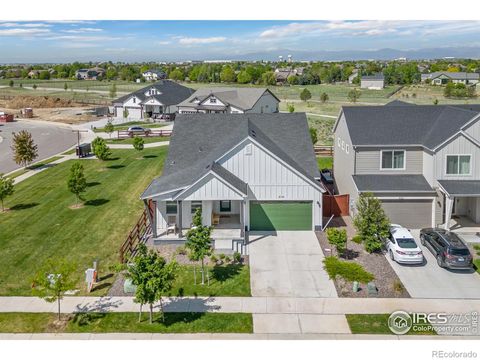
Active
$750,000
5
bds
|
3
ba
|
3,128
sqft
|
built
2021
2028 Moon Rise Dr, Windsor, CO 80550
$-2,275
Cash flow
-15.8%
Cash-on-Cash Return
2.6%
Cap rate
0.4%
Rent to Value Ratio
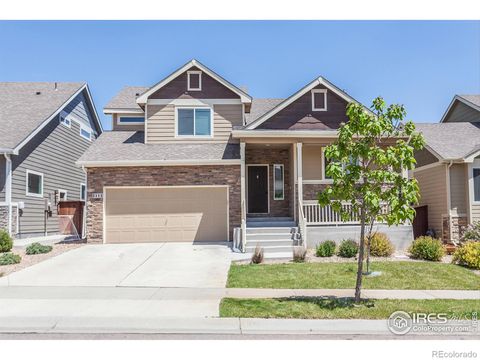
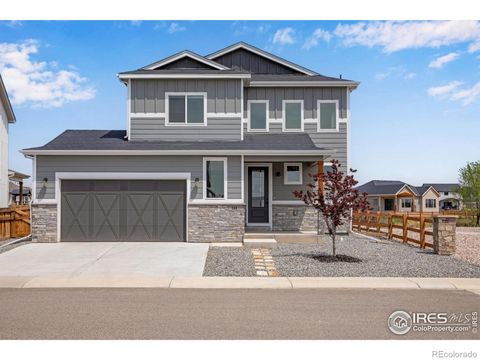
Active
$485,000
4
bds
|
3
ba
|
1,823
sqft
|
built
2019
2113 Day Spring Dr, Windsor, CO 80550
$-893
Cash flow
-9.6%
Cash-on-Cash Return
4.1%
Cap rate
0.6%
Rent to Value Ratio
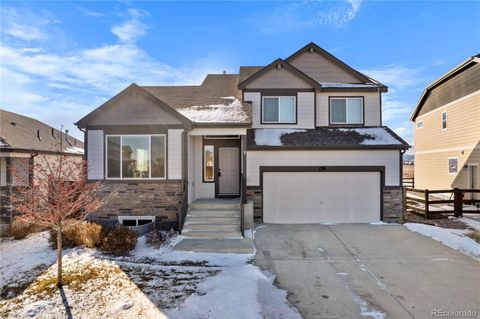
Active
$550,000
3
bds
|
3
ba
|
1,888
sqft
|
built
2020
1781 Long Shadow Dr, Windsor, CO 80550
$-1,320
Cash flow
-12.5%
Cash-on-Cash Return
3.4%
Cap rate
0.5%
Rent to Value Ratio
Active
$1,225,000
4
bds
|
4
ba
|
3,009
sqft
|
built
2021
2089 Picture Pointe Dr, Windsor, CO 80550
$-3,860
Cash flow
-16.4%
Cash-on-Cash Return
2.5%
Cap rate
0.4%
Rent to Value Ratio
Active
$520,000
3
bds
|
3
ba
|
2,306
sqft
|
built
2019
1675 Highfield Dr, Windsor, CO 80550
$-1,275
Cash flow
-12.8%
Cash-on-Cash Return
3.3%
Cap rate
0.5%
Rent to Value Ratio
Active
$895,000
4
bds
|
4
ba
|
3,631
sqft
|
built
2006
6787 Spanish Bay Dr, Windsor, CO 80550
$-3,074
Cash flow
-17.9%
Cash-on-Cash Return
2.1%
Cap rate
0.4%
Rent to Value Ratio
Active
$1,325,000
4
bds
|
5
ba
|
4,601
sqft
|
built
2005
7225 Royal Country Down Dr, Windsor, CO 80550
$-5,059
Cash flow
-19.9%
Cash-on-Cash Return
1.7%
Cap rate
0.3%
Rent to Value Ratio
Active
$760,000
4
bds
|
3
ba
|
2,229
sqft
|
built
2021
2004 Day Spring Dr, Windsor, CO 80550
$-2,242
Cash flow
-15.4%
Cash-on-Cash Return
2.7%
Cap rate
0.4%
Rent to Value Ratio
Active
$900,000
5
bds
|
4
ba
|
3,701
sqft
|
built
2011
7007 Spanish Bay Dr, Windsor, CO 80550
$-2,655
Cash flow
-15.4%
Cash-on-Cash Return
2.7%
Cap rate
0.4%
Rent to Value Ratio
Active
$490,000
3
bds
|
2
ba
|
1,705
sqft
|
built
2010
1587 Edenbridge Dr, Windsor, CO 80550
$-935
Cash flow
-10.0%
Cash-on-Cash Return
4.0%
Cap rate
0.6%
Rent to Value Ratio
Active
$785,000
4
bds
|
4
ba
|
4,238
sqft
|
built
2021
1954 Raindrop Dr, Windsor, CO 80550
$-2,165
Cash flow
-14.4%
Cash-on-Cash Return
3.0%
Cap rate
0.5%
Rent to Value Ratio
Active
$3,650,000
6
bds
|
7
ba
|
9,378
sqft
|
built
2006
8236 County Road 74, Windsor, CO 80550
$-15,627
Cash flow
-22.3%
Cash-on-Cash Return
1.1%
Cap rate
0.2%
Rent to Value Ratio
Active
$1,075,000
6
bds
|
4
ba
|
4,241
sqft
|
built
2004
1443 Folsum Dr, Windsor, CO 80550
$-3,395
Cash flow
-16.5%
Cash-on-Cash Return
2.5%
Cap rate
0.4%
Rent to Value Ratio
Active
$350,000
2
bds
|
2
ba
|
1,529
sqft
|
built
2006
2178 Cape Hatteras Dr, Windsor, CO 80550
$-1,010
Cash flow
-15.1%
Cash-on-Cash Return
2.8%
Cap rate
0.6%
Rent to Value Ratio
Active
$643,900
5
bds
|
4
ba
|
3,051
sqft
|
built
2017
5816 Osbourne Ct, Windsor, CO 80550
$-1,591
Cash flow
-12.9%
Cash-on-Cash Return
3.3%
Cap rate
0.5%
Rent to Value Ratio

Active
$830,000
5
bds
|
4
ba
|
3,685
sqft
|
built
2015
107 Ibiza Ct, Windsor, CO 80550
$-2,623
Cash flow
-16.5%
Cash-on-Cash Return
2.5%
Cap rate
0.4%
Rent to Value Ratio
Active
$1,379,000
4
bds
|
5
ba
|
4,864
sqft
|
built
2015
5954 Black Lion Ct, Windsor, CO 80550
$-5,112
Cash flow
-19.3%
Cash-on-Cash Return
1.8%
Cap rate
0.3%
Rent to Value Ratio
Active
$715,000
4
bds
|
3
ba
|
2,520
sqft
|
built
2021
1746 Long Shadow Dr, Windsor, CO 80550
$-1,789
Cash flow
-13.1%
Cash-on-Cash Return
3.3%
Cap rate
0.5%
Rent to Value Ratio
Active
$415,000
2
bds
|
2
ba
|
1,395
sqft
|
built
2021
2078 Autumn Moon Dr, Windsor, CO 80550
$-1,326
Cash flow
-16.7%
Cash-on-Cash Return
2.4%
Cap rate
0.5%
Rent to Value Ratio
Active
$769,500
4
bds
|
4
ba
|
3,222
sqft
|
built
2014
1874 E Seadrift Dr, Windsor, CO 80550
$-2,165
Cash flow
-14.7%
Cash-on-Cash Return
2.9%
Cap rate
0.5%
Rent to Value Ratio
Active
$839,000
4
bds
|
4
ba
|
3,209
sqft
|
built
2020
8412 Cromwell Cir, Windsor, CO 80528
$-2,315
Cash flow
-14.4%
Cash-on-Cash Return
3.0%
Cap rate
0.5%
Rent to Value Ratio
Active
$899,990
6
bds
|
4
ba
|
3,672
sqft
|
built
2018
1977 Shadow Lake Dr, Windsor, CO 80550
$-3,492
Cash flow
-20.2%
Cash-on-Cash Return
1.6%
Cap rate
0.3%
Rent to Value Ratio
Active
$489,900
3
bds
|
4
ba
|
2,300
sqft
|
built
2012
1565 Harpendon Ct, Windsor, CO 80550
$-969
Cash flow
-10.3%
Cash-on-Cash Return
3.9%
Cap rate
0.6%
Rent to Value Ratio
Active
$670,000
5
bds
|
4
ba
|
2,709
sqft
|
built
2022
244 Hillspire Dr, Windsor, CO 80550
$-1,739
Cash flow
-13.5%
Cash-on-Cash Return
3.2%
Cap rate
0.5%
Rent to Value Ratio
Active
$635,000
2
bds
|
3
ba
|
3,209
sqft
|
built
2010
1515 Waterfront Dr, Windsor, CO 80550
$-1,814
Cash flow
-14.9%
Cash-on-Cash Return
2.8%
Cap rate
0.5%
Rent to Value Ratio
Active
$630,000
3
bds
|
2
ba
|
1,992
sqft
|
built
2001
7747 Promontory Dr, Windsor, CO 80528
$-1,673
Cash flow
-13.9%
Cash-on-Cash Return
3.1%
Cap rate
0.5%
Rent to Value Ratio
Active
$495,000
3
bds
|
2
ba
|
1,453
sqft
|
built
2018
1484 First Light Dr, Windsor, CO 80550
$-970
Cash flow
-10.2%
Cash-on-Cash Return
3.9%
Cap rate
0.6%
Rent to Value Ratio
Active
$815,000
4
bds
|
3
ba
|
3,171
sqft
|
built
2019
2102 Bouquet Dr, Windsor, CO 80550
$-2,302
Cash flow
-14.7%
Cash-on-Cash Return
2.9%
Cap rate
0.4%
Rent to Value Ratio
Active
$469,000
3
bds
|
2
ba
|
1,427
sqft
|
built
2018
6634 Crystal Downs Dr, Windsor, CO 80550
$-1,371
Cash flow
-15.3%
Cash-on-Cash Return
2.8%
Cap rate
0.6%
Rent to Value Ratio
Active
$439,000
4
bds
|
2
ba
|
1,863
sqft
|
built
2004
135 Beacon Way, Windsor, CO 80550
$-742
Cash flow
-8.8%
Cash-on-Cash Return
4.2%
Cap rate
0.6%
Rent to Value Ratio
Active
$625,000
4
bds
|
4
ba
|
2,526
sqft
|
built
2016
1908 Los Cabos Dr, Windsor, CO 80550
$-1,473
Cash flow
-12.3%
Cash-on-Cash Return
3.4%
Cap rate
0.5%
Rent to Value Ratio
Active
$619,900
4
bds
|
3
ba
|
2,476
sqft
|
built
2022
1932 Thundercloud Dr, Windsor, CO 80550
$-1,014
Cash flow
-8.5%
Cash-on-Cash Return
4.3%
Cap rate
0.6%
Rent to Value Ratio
Active
$490,000
3
bds
|
2
ba
|
1,419
sqft
|
built
2022
944 Maplebrook Dr, Windsor, CO 80550
$-1,191
Cash flow
-12.7%
Cash-on-Cash Return
3.3%
Cap rate
0.5%
Rent to Value Ratio
Active
$850,000
5
bds
|
5
ba
|
3,894
sqft
|
built
2022
5966 Indian Wells Ct, Windsor, CO 80528
$-1,678
Cash flow
-10.3%
Cash-on-Cash Return
3.9%
Cap rate
0.5%
Rent to Value Ratio
Active
$2,400,000
6
bds
|
8
ba
|
8,172
sqft
|
built
2002
1496 Eagle Ct, Windsor, CO 80550
$-9,413
Cash flow
-20.5%
Cash-on-Cash Return
1.6%
Cap rate
0.3%
Rent to Value Ratio