Windsor, CO Investment Properties for Sale
Browse homes for sale and investment properties in Windsor, CO. Refine your search by price, property type, or more.
Best cash flowing properties in Windsor, CO
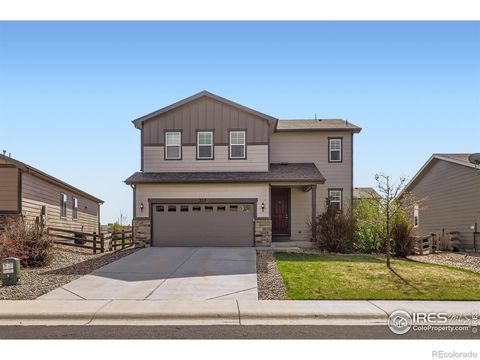
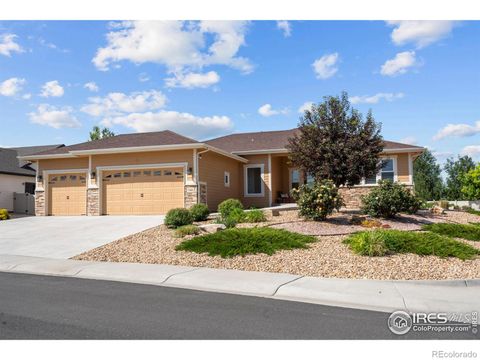
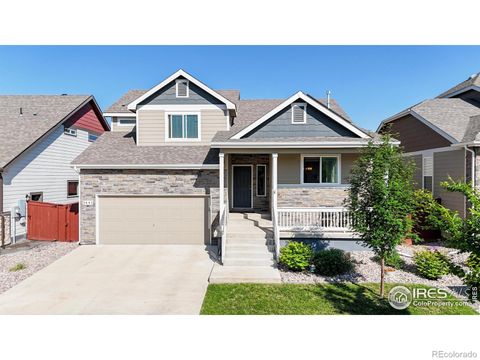
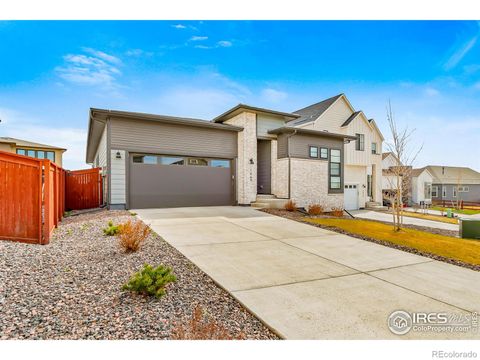
Active
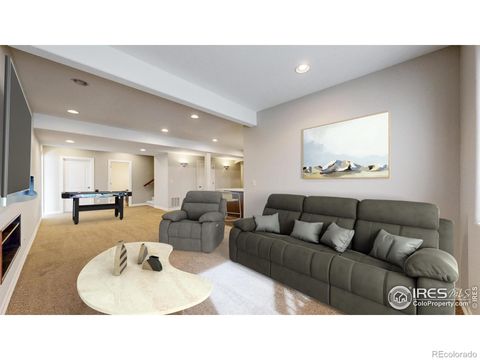
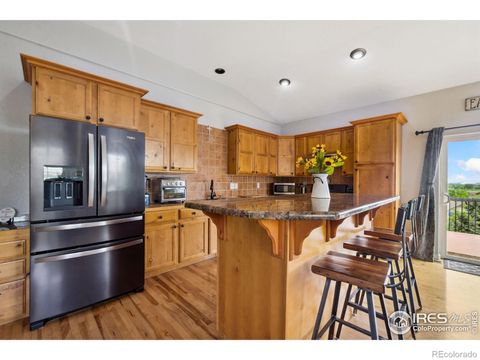
$499,000
4
bds
|
3
ba
|
1,927
sqft
|
built
2017
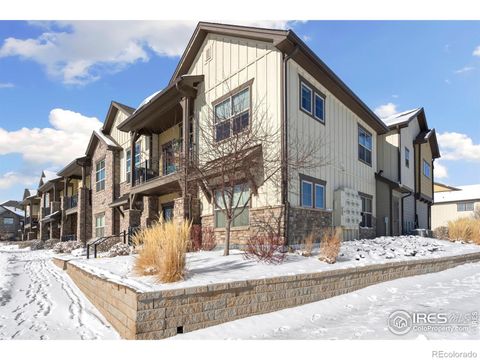
357 Chipman Dr, Windsor, CO 80550
$-673
Cash flow
-7.0%
Cash-on-Cash Return
4.6%
Cap rate
0.6%
Rent to Value Ratio
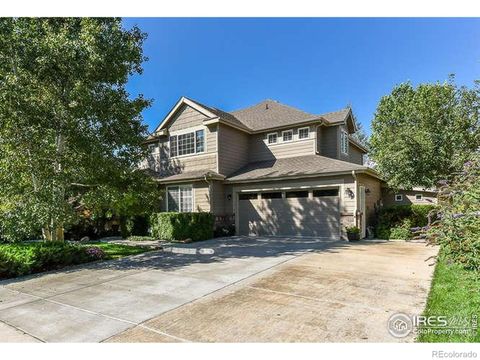
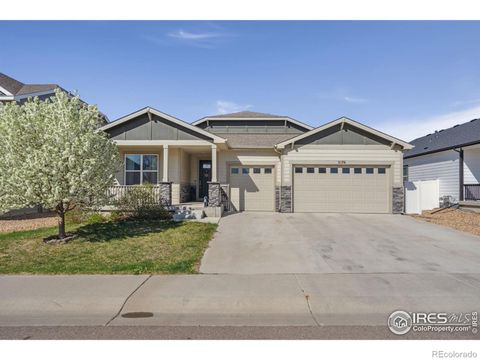
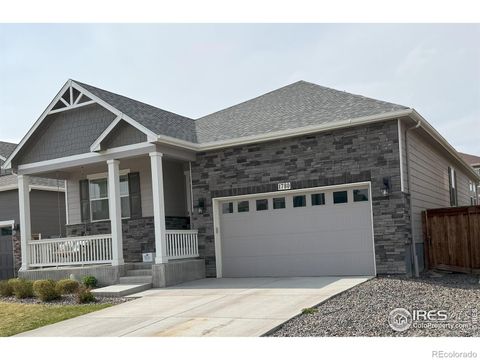
Active
$310,000
2
bds
|
2
ba
|
1,039
sqft
|
built
2003
124 Beacon Way, Windsor, CO 80550
$-821
Cash flow
-13.8%
Cash-on-Cash Return
3.1%
Cap rate
0.6%
Rent to Value Ratio
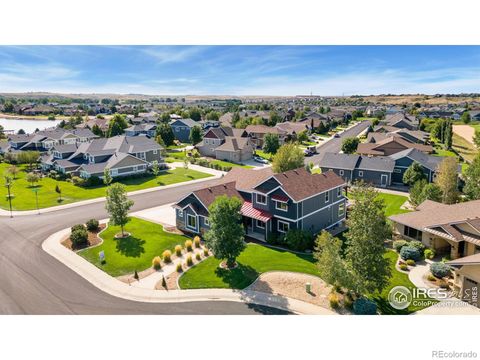
184 out of 224 properties for sale in Windsor, CO
Limited Results Shown
Create a free account, or log in to reveal all property listings and enjoy the complete experience.
Active
$625,000
4
bds
|
3
ba
|
3,495
sqft
|
built
2021
1830 Thrive Dr, Windsor, CO 80550
$-1,559
Cash flow
-13.0%
Cash-on-Cash Return
3.3%
Cap rate
0.5%
Rent to Value Ratio
Active
$5,299,000
4
bds
|
4
ba
|
6,930
sqft
|
built
2014
840 Doce Ln, Windsor, CO 80550
$-24,850
Cash flow
-24.5%
Cash-on-Cash Return
0.6%
Cap rate
0.1%
Rent to Value Ratio
Active
$929,000
5
bds
|
4
ba
|
3,742
sqft
|
built
2012
6780 Crooked Stick Dr, Windsor, CO 80550
$-2,786
Cash flow
-15.6%
Cash-on-Cash Return
2.7%
Cap rate
0.4%
Rent to Value Ratio
Active
$839,900
5
bds
|
4
ba
|
3,913
sqft
|
built
2000
8356 Louden Cir, Windsor, CO 80528
$-2,104
Cash flow
-13.1%
Cash-on-Cash Return
3.3%
Cap rate
0.5%
Rent to Value Ratio
Active
$310,000
2
bds
|
2
ba
|
1,039
sqft
|
built
2003
124 Beacon Way, Windsor, CO 80550
$-821
Cash flow
-13.8%
Cash-on-Cash Return
3.1%
Cap rate
0.6%
Rent to Value Ratio
Active
$1,075,000
4
bds
|
3
ba
|
2,831
sqft
|
built
2013
1860 Seadrift Ct, Windsor, CO 80550
$-2,684
Cash flow
-13.0%
Cash-on-Cash Return
3.3%
Cap rate
0.5%
Rent to Value Ratio
Active
$1,250,000
4
bds
|
6
ba
|
3,761
sqft
|
built
2021
2145 Picture Pointe Dr, Windsor, CO 80550
$-3,647
Cash flow
-15.2%
Cash-on-Cash Return
2.8%
Cap rate
0.5%
Rent to Value Ratio
Active
$875,000
5
bds
|
4
ba
|
3,237
sqft
|
built
2019
7401 Turnbull Ct, Windsor, CO 80550
$-2,514
Cash flow
-15.0%
Cash-on-Cash Return
2.8%
Cap rate
0.4%
Rent to Value Ratio
Active
$618,000
3
bds
|
3
ba
|
2,316
sqft
|
built
2018
2119 Pelican Farm Rd, Windsor, CO 80550
$-1,506
Cash flow
-12.7%
Cash-on-Cash Return
3.3%
Cap rate
0.5%
Rent to Value Ratio
Active
$699,000
5
bds
|
4
ba
|
3,756
sqft
|
built
2018
5176 Chantry Dr, Windsor, CO 80550
$-1,973
Cash flow
-14.7%
Cash-on-Cash Return
2.9%
Cap rate
0.5%
Rent to Value Ratio
Active
$549,000
3
bds
|
2
ba
|
1,636
sqft
|
built
2020
1570 Clarendon Dr, Windsor, CO 80550
$-1,495
Cash flow
-14.2%
Cash-on-Cash Return
3.0%
Cap rate
0.5%
Rent to Value Ratio
Active
$515,000
4
bds
|
3
ba
|
1,859
sqft
|
built
2021
1661 Rise Dr, Windsor, CO 80550
$-1,133
Cash flow
-11.5%
Cash-on-Cash Return
3.6%
Cap rate
0.5%
Rent to Value Ratio
Active
$500,000
4
bds
|
2
ba
|
1,907
sqft
|
built
2020
1780 Floret Dr, Windsor, CO 80550
$-876
Cash flow
-9.1%
Cash-on-Cash Return
4.2%
Cap rate
0.6%
Rent to Value Ratio
Active
$530,000
4
bds
|
3
ba
|
2,064
sqft
|
built
2018
929 Charlton Dr, Windsor, CO 80550
$-1,166
Cash flow
-11.5%
Cash-on-Cash Return
3.6%
Cap rate
0.5%
Rent to Value Ratio
Active
$1,850,000
5
bds
|
5
ba
|
4,611
sqft
|
built
2021
2123 Picture Pointe Dr, Windsor, CO 80550
$-6,895
Cash flow
-19.4%
Cash-on-Cash Return
1.8%
Cap rate
0.3%
Rent to Value Ratio
Active
$725,000
3
bds
|
3
ba
|
2,234
sqft
|
built
2022
1869 Blossom Grove Dr, Windsor, CO 80550
$-1,627
Cash flow
-11.7%
Cash-on-Cash Return
3.6%
Cap rate
0.5%
Rent to Value Ratio
Active
$729,900
5
bds
|
3
ba
|
3,260
sqft
|
built
2018
524 Vermilion Peak Dr, Windsor, CO 80550
$-1,996
Cash flow
-14.3%
Cash-on-Cash Return
3.0%
Cap rate
0.4%
Rent to Value Ratio
Active
$1,185,000
3
bds
|
4
ba
|
3,465
sqft
|
built
2021
1769 Beachside Dr, Windsor, CO 80550
$-2,944
Cash flow
-13.0%
Cash-on-Cash Return
3.3%
Cap rate
0.5%
Rent to Value Ratio
Active
$825,000
5
bds
|
5
ba
|
4,421
sqft
|
built
2017
2275 Stonefish Dr, Windsor, CO 80550
$-2,343
Cash flow
-14.8%
Cash-on-Cash Return
2.9%
Cap rate
0.4%
Rent to Value Ratio
Active
$400,000
2
bds
|
2
ba
|
1,192
sqft
|
built
2017
6690 Crystal Downs Dr, Windsor, CO 80550
$-1,242
Cash flow
-16.2%
Cash-on-Cash Return
2.5%
Cap rate
0.5%
Rent to Value Ratio
Active
$775,000
6
bds
|
4
ba
|
3,421
sqft
|
built
2021
336 Bluestar Dr, Windsor, CO 80550
$-2,063
Cash flow
-13.9%
Cash-on-Cash Return
3.1%
Cap rate
0.5%
Rent to Value Ratio
Active
$798,500
5
bds
|
4
ba
|
3,125
sqft
|
built
2006
7018 Aladar Dr, Windsor, CO 80550
$-1,804
Cash flow
-11.8%
Cash-on-Cash Return
3.6%
Cap rate
0.5%
Rent to Value Ratio
Active
$369,500
2
bds
|
2
ba
|
1,175
sqft
|
built
2021
2086 Autumn Moon Dr, Windsor, CO 80550
$-1,026
Cash flow
-14.5%
Cash-on-Cash Return
2.9%
Cap rate
0.6%
Rent to Value Ratio
Active
$899,000
4
bds
|
3
ba
|
2,918
sqft
|
built
2015
8481 Allenbrook Dr, Windsor, CO 80550
$-2,781
Cash flow
-16.1%
Cash-on-Cash Return
2.6%
Cap rate
0.4%
Rent to Value Ratio
Active
$825,000
5
bds
|
4
ba
|
2,774
sqft
|
built
2019
1958 Autumn Moon Dr, Windsor, CO 80550
$-2,410
Cash flow
-15.2%
Cash-on-Cash Return
2.8%
Cap rate
0.4%
Rent to Value Ratio
Active
$1,500,000
5
bds
|
4
ba
|
4,846
sqft
|
built
2013
8738 Longs Peak Cir, Windsor, CO 80550
$-5,660
Cash flow
-19.7%
Cash-on-Cash Return
1.7%
Cap rate
0.3%
Rent to Value Ratio
Active
$835,000
5
bds
|
4
ba
|
3,470
sqft
|
built
2017
8241 White Owl Ct, Windsor, CO 80550
$-2,692
Cash flow
-16.8%
Cash-on-Cash Return
2.4%
Cap rate
0.4%
Rent to Value Ratio
Active
$772,100
4
bds
|
3
ba
|
3,192
sqft
|
built
2018
6049 Carmon Dr, Windsor, CO 80550
$-2,080
Cash flow
-14.1%
Cash-on-Cash Return
3.0%
Cap rate
0.5%
Rent to Value Ratio
Active
$1,595,000
6
bds
|
5
ba
|
5,315
sqft
|
built
2003
1769 Merlin Ln, Windsor, CO 80550
$-6,645
Cash flow
-21.7%
Cash-on-Cash Return
1.3%
Cap rate
0.2%
Rent to Value Ratio
Active
$740,000
5
bds
|
3
ba
|
3,624
sqft
|
built
2019
273 Saskatoon Dr, Windsor, CO 80550
$-2,018
Cash flow
-14.2%
Cash-on-Cash Return
3.0%
Cap rate
0.5%
Rent to Value Ratio

Active
$389,000
2
bds
|
2
ba
|
1,132
sqft
|
built
2020
6510 Crystal Downs Dr, Windsor, CO 80550
$-1,089
Cash flow
-14.6%
Cash-on-Cash Return
2.9%
Cap rate
0.6%
Rent to Value Ratio
Active
$650,000
5
bds
|
3
ba
|
2,679
sqft
|
built
2021
4550 Bishopsgate Dr, Windsor, CO 80550
$-1,637
Cash flow
-13.1%
Cash-on-Cash Return
3.2%
Cap rate
0.5%
Rent to Value Ratio
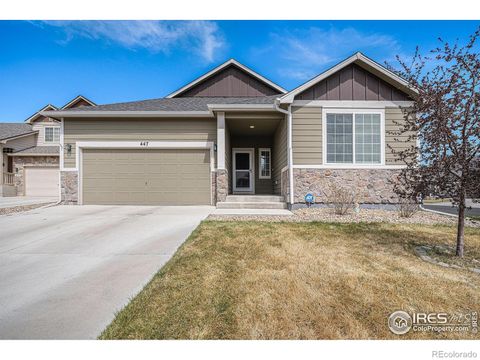
Active
$489,500
3
bds
|
2
ba
|
1,554
sqft
|
built
2016
447 Havenbrook Dr, Windsor, CO 80550
$-1,240
Cash flow
-13.2%
Cash-on-Cash Return
3.2%
Cap rate
0.5%
Rent to Value Ratio
Active
$510,000
3
bds
|
2
ba
|
1,554
sqft
|
built
2020
1884 Covered Bridge Pkwy, Windsor, CO 80550
$-1,092
Cash flow
-11.2%
Cash-on-Cash Return
3.7%
Cap rate
0.5%
Rent to Value Ratio
Active
$720,000
5
bds
|
3
ba
|
3,176
sqft
|
built
2013
7405 Rosecroft Dr, Windsor, CO 80550
$-1,968
Cash flow
-14.3%
Cash-on-Cash Return
3.0%
Cap rate
0.4%
Rent to Value Ratio
Active
$653,000
6
bds
|
4
ba
|
3,719
sqft
|
built
2015
1540 Reynolds Dr, Windsor, CO 80550
$-1,680
Cash flow
-13.4%
Cash-on-Cash Return
3.2%
Cap rate
0.5%
Rent to Value Ratio
Active
$745,000
5
bds
|
4
ba
|
3,934
sqft
|
built
2005
1755 Dolores River Dr, Windsor, CO 80550
$-2,051
Cash flow
-14.4%
Cash-on-Cash Return
3.0%
Cap rate
0.4%
Rent to Value Ratio
Active
$849,900
4
bds
|
4
ba
|
3,257
sqft
|
built
2002
445 Whitney Hbr, Windsor, CO 80550
$-2,532
Cash flow
-15.5%
Cash-on-Cash Return
2.7%
Cap rate
0.4%
Rent to Value Ratio
Active
$499,000
4
bds
|
3
ba
|
1,927
sqft
|
built
2017
357 Chipman Dr, Windsor, CO 80550
$-673
Cash flow
-7.0%
Cash-on-Cash Return
4.6%
Cap rate
0.6%
Rent to Value Ratio
Active
$853,000
4
bds
|
5
ba
|
3,263
sqft
|
built
2021
2144 Setting Sun Dr, Windsor, CO 80550
$-2,587
Cash flow
-15.8%
Cash-on-Cash Return
2.6%
Cap rate
0.4%
Rent to Value Ratio