Windsor, CO Investment Properties for Sale
Browse homes for sale and investment properties in Windsor, CO. Refine your search by price, property type, or more.
Best cash flowing properties in Windsor, CO

Active
$170,000
1
bds
|
1
ba
|
560
sqft
|
built
1971
804 Stone Mountain Dr, Windsor, CO 80550
$-330
Cash flow
-10.1%
Cash-on-Cash Return
3.9%
Cap rate
0.8%
Rent to Value Ratio
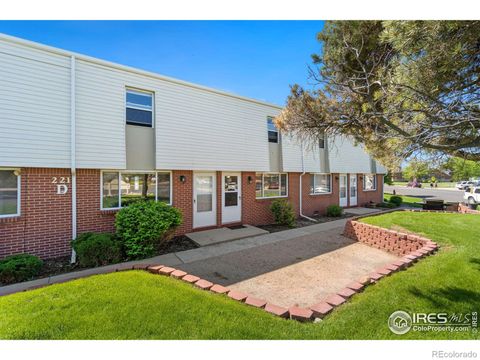
Active
$269,000
2
bds
|
2
ba
|
928
sqft
|
built
1971
221 Chestnut St, Windsor, CO 80550
$-701
Cash flow
-13.6%
Cash-on-Cash Return
3.1%
Cap rate
0.6%
Rent to Value Ratio
185 out of 225 properties for sale in Windsor, CO
Limited Results Shown
Create a free account, or log in to reveal all property listings and enjoy the complete experience.
Active
$699,900
5
bds
|
4
ba
|
3,505
sqft
|
built
2000
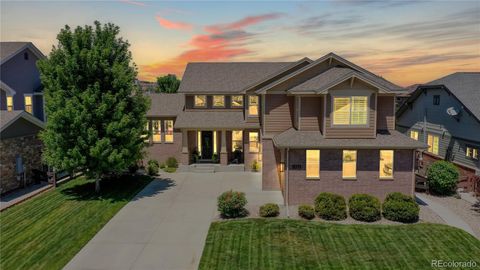
116 Rock Bridge Ct, Windsor, CO 80550
$-1,668
Cash flow
-12.4%
Cash-on-Cash Return
3.4%
Cap rate
0.5%
Rent to Value Ratio
Active
$830,000
3
bds
|
3
ba
|
2,335
sqft
|
built
2001
5013 Country Farms Dr, Windsor, CO 80528
$-2,399
Cash flow
-15.1%
Cash-on-Cash Return
2.8%
Cap rate
0.4%
Rent to Value Ratio
Active
$333,900
1
bds
|
1
ba
|
898
sqft
|
built
2023
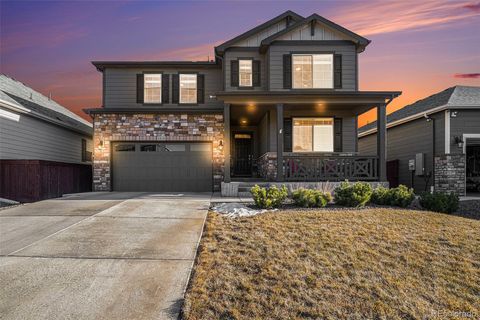
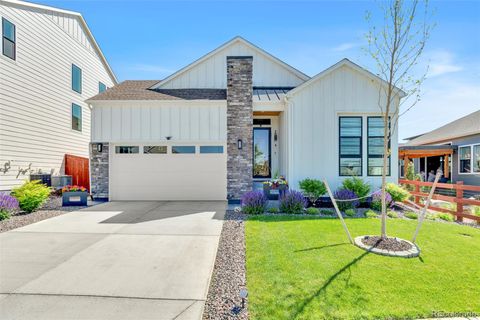
2110 Setting Sun Dr, Windsor, CO 80550
$-1,018
Cash flow
-15.9%
Cash-on-Cash Return
2.6%
Cap rate
0.6%
Rent to Value Ratio
Active
$975,000
6
bds
|
5
ba
|
6,190
sqft
|
built
2011
1988 Cataluna Dr, Windsor, CO 80550
$-2,681
Cash flow
-14.3%
Cash-on-Cash Return
3.0%
Cap rate
0.5%
Rent to Value Ratio
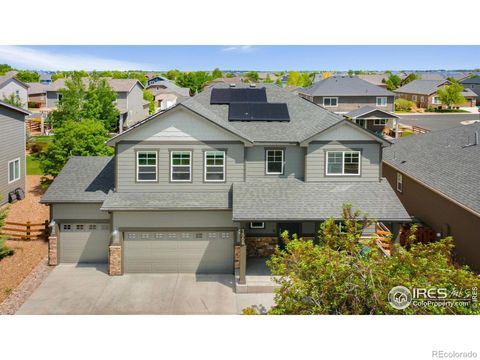
Active
$650,000
5
bds
|
4
ba
|
2,802
sqft
|
built
2019
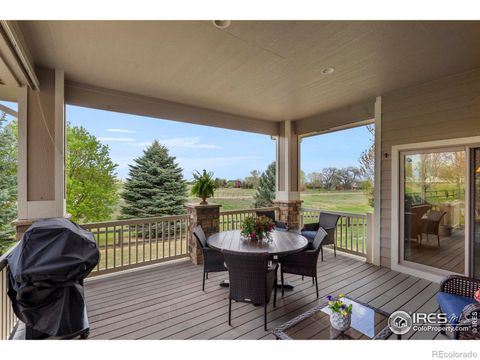
1819 Hydrangea Dr, Windsor, CO 80550
$-1,741
Cash flow
-14.0%
Cash-on-Cash Return
3.0%
Cap rate
0.5%
Rent to Value Ratio
Active
$860,000
4
bds
|
4
ba
|
3,994
sqft
|
built
2006
6836 Spanish Bay Dr, Windsor, CO 80550
$-3,066
Cash flow
-18.6%
Cash-on-Cash Return
2.0%
Cap rate
0.4%
Rent to Value Ratio
Active
$549,500
3
bds
|
3
ba
|
2,053
sqft
|
built
2017
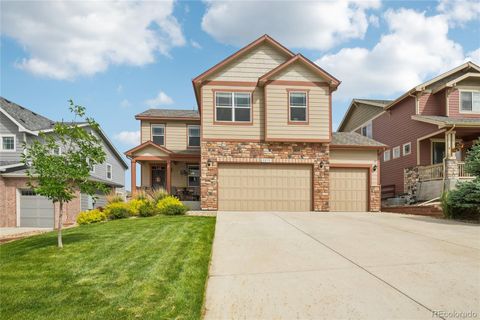
2273 Stonefish Dr, Windsor, CO 80550
$-1,095
Cash flow
-10.4%
Cash-on-Cash Return
3.9%
Cap rate
0.6%
Rent to Value Ratio
Active
$170,000
1
bds
|
1
ba
|
560
sqft
|
built
1971
804 Stone Mountain Dr, Windsor, CO 80550
$-330
Cash flow
-10.1%
Cash-on-Cash Return
3.9%
Cap rate
0.8%
Rent to Value Ratio
Active
$874,000
5
bds
|
4
ba
|
3,950
sqft
|
built
2022
1881 Blossom Grove Dr, Windsor, CO 80550
$-2,467
Cash flow
-14.7%
Cash-on-Cash Return
2.9%
Cap rate
0.4%
Rent to Value Ratio

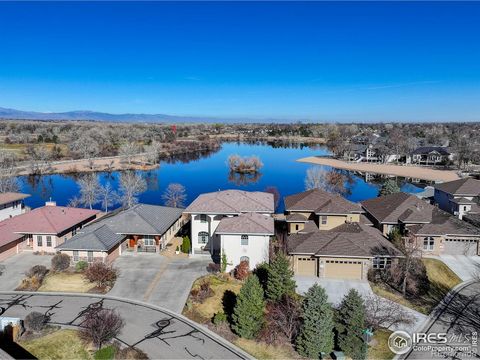
Active
$1,399,000
5
bds
|
3
ba
|
5,865
sqft
|
built
1999
335 N Shore Cir, Windsor, CO 80550
$-5,414
Cash flow
-20.2%
Cash-on-Cash Return
1.6%
Cap rate
0.3%
Rent to Value Ratio
Active
$785,000
3
bds
|
4
ba
|
3,399
sqft
|
built
2005
6771 Crooked Stick Dr, Windsor, CO 80550
$-2,545
Cash flow
-16.9%
Cash-on-Cash Return
2.4%
Cap rate
0.4%
Rent to Value Ratio
Active
$1,025,000
4
bds
|
4
ba
|
4,675
sqft
|
built
2006
6535 Half Moon Bay Dr, Windsor, CO 80550
$-3,715
Cash flow
-18.9%
Cash-on-Cash Return
1.9%
Cap rate
0.4%
Rent to Value Ratio
Active
$985,000
5
bds
|
5
ba
|
4,856
sqft
|
built
2001
305 Habitat Cv, Windsor, CO 80550
$-3,214
Cash flow
-17.0%
Cash-on-Cash Return
2.3%
Cap rate
0.4%
Rent to Value Ratio
Active
$668,000
6
bds
|
4
ba
|
3,608
sqft
|
built
2016
1568 Grand Ave, Windsor, CO 80550
$-1,744
Cash flow
-13.6%
Cash-on-Cash Return
3.1%
Cap rate
0.5%
Rent to Value Ratio
Active
$785,000
5
bds
|
4
ba
|
3,875
sqft
|
built
2021
2156 Setting Sun Dr, Windsor, CO 80550
$-2,474
Cash flow
-16.4%
Cash-on-Cash Return
2.5%
Cap rate
0.4%
Rent to Value Ratio
Active
$269,000
2
bds
|
2
ba
|
928
sqft
|
built
1971
221 Chestnut St, Windsor, CO 80550
$-701
Cash flow
-13.6%
Cash-on-Cash Return
3.1%
Cap rate
0.6%
Rent to Value Ratio
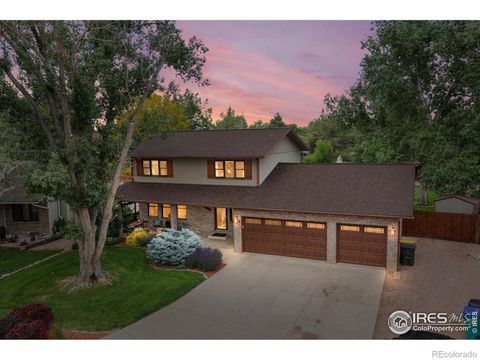
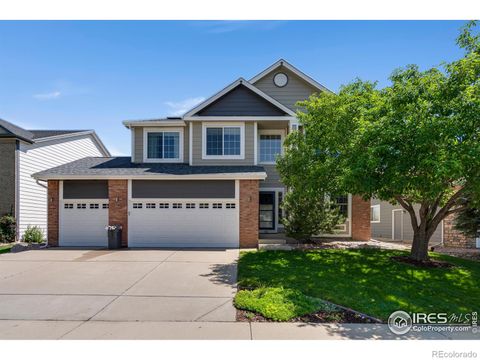
Active
$678,000
4
bds
|
4
ba
|
2,932
sqft
|
built
1986
1021 Pinyon Dr, Windsor, CO 80550
$-1,847
Cash flow
-14.2%
Cash-on-Cash Return
3.0%
Cap rate
0.4%
Rent to Value Ratio
Active
$1,133,000
4
bds
|
5
ba
|
4,735
sqft
|
built
2005
400 Crystal Beach Dr, Windsor, CO 80550
$-2,754
Cash flow
-12.7%
Cash-on-Cash Return
3.3%
Cap rate
0.4%
Rent to Value Ratio
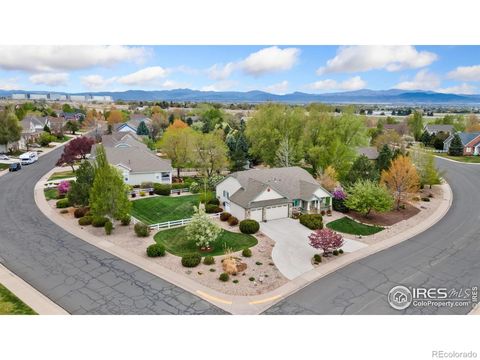
Active
$620,000
4
bds
|
3
ba
|
2,875
sqft
|
built
2006
1701 Platte River Dr, Windsor, CO 80550
$-1,083
Cash flow
-9.1%
Cash-on-Cash Return
4.2%
Cap rate
0.5%
Rent to Value Ratio
Active
$685,000
4
bds
|
4
ba
|
3,410
sqft
|
built
2020
290 Sutherland Dr, Windsor, CO 80550
$-1,838
Cash flow
-14.0%
Cash-on-Cash Return
3.0%
Cap rate
0.5%
Rent to Value Ratio
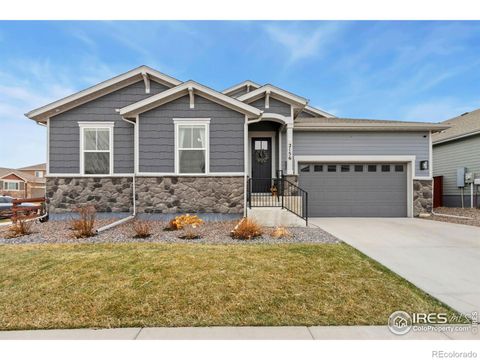
Active
$449,000
3
bds
|
2
ba
|
1,685
sqft
|
built
2022
2080 Autumn Moon Dr, Windsor, CO 80550
$-1,329
Cash flow
-15.4%
Cash-on-Cash Return
2.7%
Cap rate
0.6%
Rent to Value Ratio
Active
$650,000
3
bds
|
2
ba
|
1,736
sqft
|
built
2021
5521 Shady Oaks Dr, Windsor, CO 80528
$-1,631
Cash flow
-13.1%
Cash-on-Cash Return
3.3%
Cap rate
0.5%
Rent to Value Ratio
Active
$570,000
4
bds
|
3
ba
|
2,302
sqft
|
built
2021
1963 Golden Horizon Dr, Windsor, CO 80550
$-1,351
Cash flow
-12.4%
Cash-on-Cash Return
3.4%
Cap rate
0.5%
Rent to Value Ratio
Active
$1,555,000
4
bds
|
4
ba
|
5,234
sqft
|
built
2004
1780 Merlin Ln, Windsor, CO 80550
$-5,248
Cash flow
-17.6%
Cash-on-Cash Return
2.2%
Cap rate
0.4%
Rent to Value Ratio
Active
$645,000
6
bds
|
4
ba
|
3,061
sqft
|
built
2018
5664 Osbourne Dr, Windsor, CO 80550
$-1,668
Cash flow
-13.5%
Cash-on-Cash Return
3.2%
Cap rate
0.5%
Rent to Value Ratio