Woburn, MA Investment Properties for Sale
Browse homes for sale and investment properties in Woburn, MA. Refine your search by price, property type, or more.
Best cash flowing properties in Woburn, MA
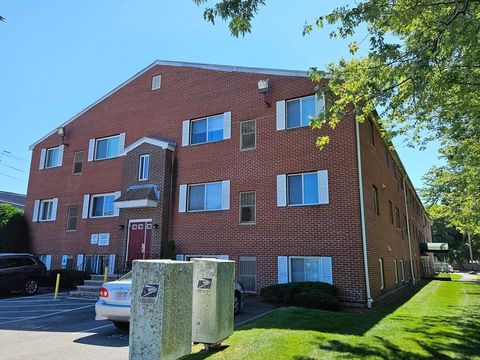
Active
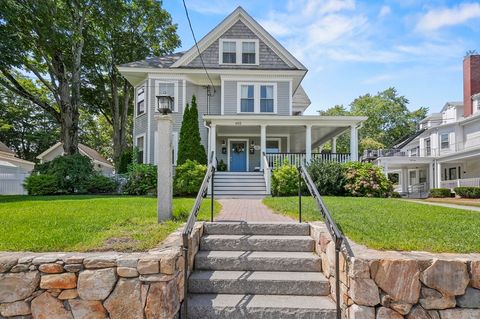
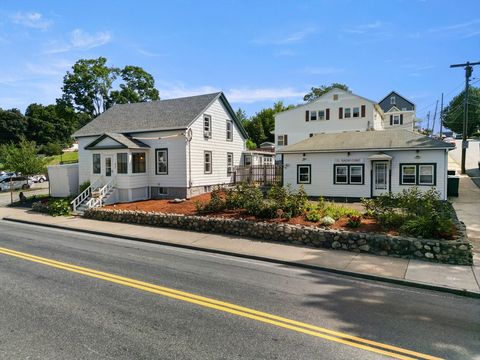
$299,900
1
bds
|
1
ba
|
630
sqft
|
built
1987
35 Prospect St, Woburn, MA 01801
$-414
Cash flow
-7.2%
Cash-on-Cash Return
4.0%
Cap rate
0.7%
Rent to Value Ratio
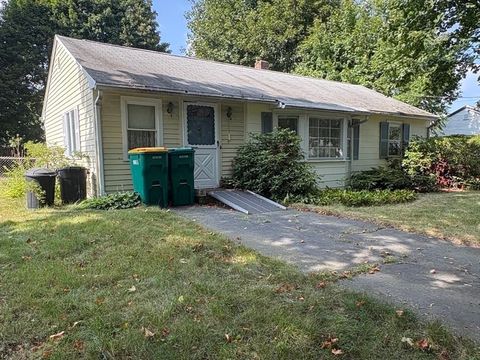
Active
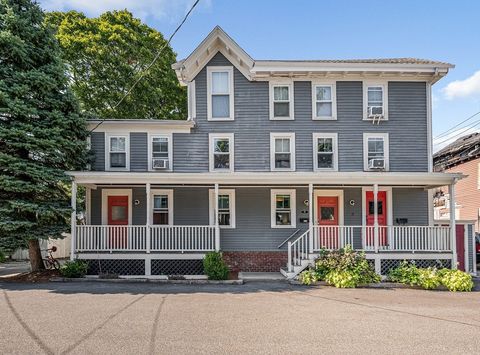
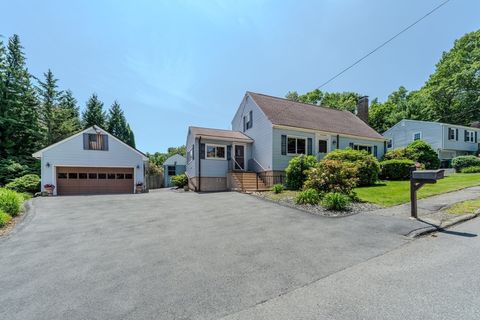
$449,900
2
bds
|
1
ba
|
1,005
sqft
|
built
1947
8 Boyd Rd, Woburn, MA 01801
$-561
Cash flow
-6.5%
Cash-on-Cash Return
4.2%
Cap rate
0.6%
Rent to Value Ratio
17 out of 34 properties for sale in Woburn, MA
Limited Results Shown
Create a free account, or log in to reveal all property listings and enjoy the complete experience.
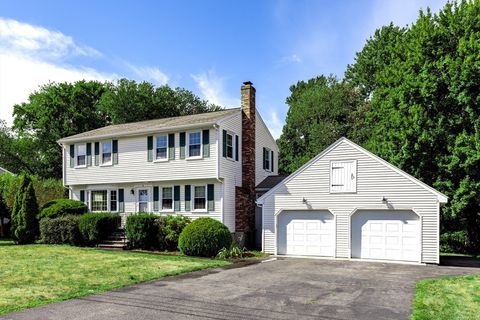
Active
$879,000
4
bds
|
2
ba
|
2,100
sqft
|
built
1980
20 Barbara Cir, Woburn, MA 01801
$-1,956
Cash flow
-11.6%
Cash-on-Cash Return
3.0%
Cap rate
0.5%
Rent to Value Ratio
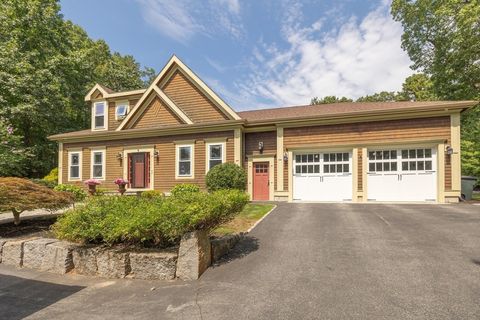
Active
$1,575,000
5
bds
|
4
ba
|
4,578
sqft
|
built
2014
9 Washington Ave, Woburn, MA 01801
$-2,357
Cash flow
-7.8%
Cash-on-Cash Return
3.9%
Cap rate
0.6%
Rent to Value Ratio
Active
$679,000
3
bds
|
2
ba
|
1,075
sqft
|
built
1895
602 Main St, Woburn, MA 01801
$-1,594
Cash flow
-12.2%
Cash-on-Cash Return
2.9%
Cap rate
0.5%
Rent to Value Ratio
Active
$549,949
2
bds
|
3
ba
|
1,528
sqft
|
built
1930
3 Richmond Park, Woburn, MA 01801
$-983
Cash flow
-9.3%
Cash-on-Cash Return
3.5%
Cap rate
0.6%
Rent to Value Ratio
Active
$865,000
3
bds
|
3
ba
|
1,800
sqft
|
built
2017
100 Baldwin Ave, Woburn, MA 01801
$-2,094
Cash flow
-12.6%
Cash-on-Cash Return
2.8%
Cap rate
0.5%
Rent to Value Ratio
Active
$599,778
3
bds
|
2
ba
|
1,703
sqft
|
built
1957
15 Seneca Rd, Woburn, MA 01801
$-802
Cash flow
-7.0%
Cash-on-Cash Return
4.1%
Cap rate
0.6%
Rent to Value Ratio
Active
$1,195,000
3
bds
|
2
ba
|
2,485
sqft
|
built
1850
92 Arlington Rd, Woburn, MA 01801
$-2,302
Cash flow
-10.1%
Cash-on-Cash Return
3.4%
Cap rate
0.5%
Rent to Value Ratio
Active
$839,000
4
bds
|
2
ba
|
2,198
sqft
|
built
1968
2 Otis St, Woburn, MA 01801
$-1,540
Cash flow
-9.6%
Cash-on-Cash Return
3.5%
Cap rate
0.5%
Rent to Value Ratio
Active
$929,000
5
bds
|
3
ba
|
2,474
sqft
|
built
1981
35 Sylvanus Wood Ln, Woburn, MA 01801
$-1,463
Cash flow
-8.2%
Cash-on-Cash Return
3.8%
Cap rate
0.5%
Rent to Value Ratio
Active
$799,000
3
bds
|
1
ba
|
1,800
sqft
|
built
1964
212 Cambridge Rd, Woburn, MA 01801
$-1,973
Cash flow
-12.9%
Cash-on-Cash Return
2.7%
Cap rate
0.4%
Rent to Value Ratio
Active
$999,000
4
bds
|
3
ba
|
2,272
sqft
|
built
1960
25 Indian Hill Rd, Woburn, MA 01801
$-2,505
Cash flow
-13.1%
Cash-on-Cash Return
2.7%
Cap rate
0.4%
Rent to Value Ratio
Active
$999,000
5
bds
|
3
ba
|
2,732
sqft
|
built
1840
30 Forest Park Rd, Woburn, MA 01801
$-2,216
Cash flow
-11.6%
Cash-on-Cash Return
3.0%
Cap rate
0.4%
Rent to Value Ratio
Active
$295,000
1
bds
|
1
ba
|
410
sqft
|
built
1984
10 Beacon St, Woburn, MA 01801
$-601
Cash flow
-10.6%
Cash-on-Cash Return
3.2%
Cap rate
0.5%
Rent to Value Ratio
Active
$1,499,000
5
bds
|
4
ba
|
3,556
sqft
|
built
2025
7 Locust St, Woburn, MA 01801
$-5,231
Cash flow
-18.2%
Cash-on-Cash Return
1.5%
Cap rate
0.2%
Rent to Value Ratio
Active
$452,000
2
bds
|
1
ba
|
856
sqft
|
built
1965
31 Arlington Rd, Woburn, MA 01801
$-1,112
Cash flow
-12.8%
Cash-on-Cash Return
2.7%
Cap rate
0.6%
Rent to Value Ratio