33009 Investment Properties for Sale
Browse homes for sale and investment properties in 33009. Refine your search by price, property type, or more.
Best cash flowing properties in 33009
Active
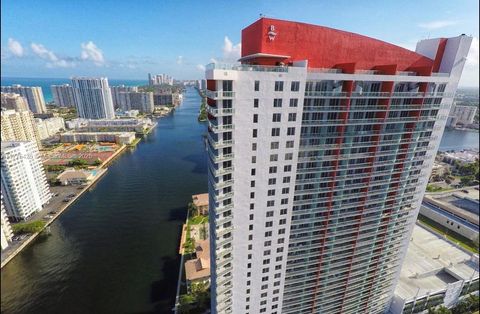
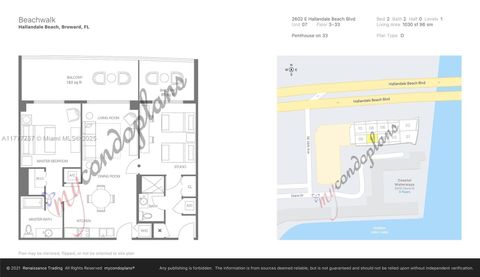
$415,000
2
bds
|
2
ba
|
1,030
sqft
|
built
2015
2602 E Hallandale Beach Blvd, Hallandale Beach, FL 33009
$0
Cash flow
n/a
Cash-on-Cash Return
n/a
Cap rate
n/a
Rent to Value Ratio

Active
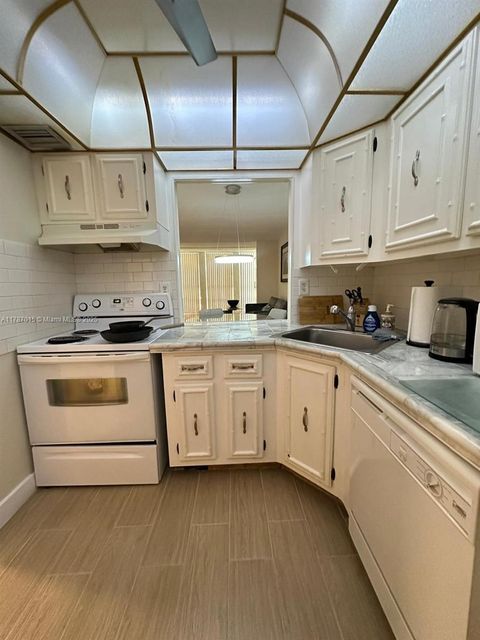
$488,000
2
bds
|
2
ba
|
1,030
sqft
|
built
2015
2602 E Hallandale Beach Blvd, Hallandale Beach, FL 33009
$0
Cash flow
n/a
Cash-on-Cash Return
n/a
Cap rate
n/a
Rent to Value Ratio
593 out of 683 properties for sale in 33009
Limited Results Shown
Create a free account, or log in to reveal all property listings and enjoy the complete experience.
Active
$230,000
1
bds
|
1
ba
|
820
sqft
|
built
1974
851 Three Islands Blvd, Hallandale Beach, FL 33009
$-798
Cash flow
-18.1%
Cash-on-Cash Return
2.0%
Cap rate
0.8%
Rent to Value Ratio
Active
$1,099,000
3
bds
|
3
ba
|
1,920
sqft
|
built
1974
1880 S Ocean Dr, Hallandale Beach, FL 33009
$-5,089
Cash flow
-24.2%
Cash-on-Cash Return
0.6%
Cap rate
0.4%
Rent to Value Ratio
Active
$749,000
2
bds
|
2
ba
|
1,680
sqft
|
built
1980
2667 S Parkview Dr, Hallandale Beach, FL 33009
$-903
Cash flow
-6.3%
Cash-on-Cash Return
4.7%
Cap rate
0.9%
Rent to Value Ratio
Active
$325,000
1
bds
|
2
ba
|
828
sqft
|
built
1974
500 Three Islands Blvd, Hallandale Beach, FL 33009
$-1,165
Cash flow
-18.7%
Cash-on-Cash Return
1.8%
Cap rate
0.8%
Rent to Value Ratio
Active
$150,000
1
bds
|
1
ba
|
720
sqft
|
built
1965
700 Layne Blvd, Hallandale Beach, FL 33009
$-394
Cash flow
-13.7%
Cash-on-Cash Return
3.0%
Cap rate
1.3%
Rent to Value Ratio
Active
$299,000
2
bds
|
2
ba
|
1,150
sqft
|
built
1972
427 Golden Isles Dr, Hallandale Beach, FL 33009
$-627
Cash flow
-10.9%
Cash-on-Cash Return
3.6%
Cap rate
1.0%
Rent to Value Ratio
Active
$299,000
1
bds
|
2
ba
|
950
sqft
|
built
1980
2500 Parkview Dr, Hallandale Beach, FL 33009
$-1,320
Cash flow
-23.0%
Cash-on-Cash Return
0.9%
Cap rate
0.8%
Rent to Value Ratio
Active
$730,000
1
bds
|
1
ba
|
844
sqft
|
built
2006
1830 S Ocean Dr, Hallandale Beach, FL 33009
$-2,101
Cash flow
-15.0%
Cash-on-Cash Return
2.7%
Cap rate
0.7%
Rent to Value Ratio

Active
$320,000
2
bds
|
2
ba
|
1,092
sqft
|
built
1971
3161 S Ocean Dr, Hallandale Beach, FL 33009
$-632
Cash flow
-10.3%
Cash-on-Cash Return
3.8%
Cap rate
0.9%
Rent to Value Ratio
Active
$249,900
2
bds
|
2
ba
|
945
sqft
|
built
1980
1913 S Ocean Dr, Hallandale Beach, FL 33009
$-765
Cash flow
-16.0%
Cash-on-Cash Return
2.5%
Cap rate
1.0%
Rent to Value Ratio
Active
$295,000
1
bds
|
2
ba
|
950
sqft
|
built
1980
2500 Parkview Dr, Hallandale Beach, FL 33009
$-1,374
Cash flow
-24.3%
Cash-on-Cash Return
0.6%
Cap rate
0.7%
Rent to Value Ratio
Active
$715,000
2
bds
|
1
ba
|
1,086
sqft
|
built
2005
1850 S Ocean Dr, Hallandale Beach, FL 33009
$-2,902
Cash flow
-21.2%
Cash-on-Cash Return
1.3%
Cap rate
0.6%
Rent to Value Ratio
Active
$399,990
2
bds
|
2
ba
|
1,052
sqft
|
built
2007
1755 E Hallandale Beach Blvd, Hallandale Beach, FL 33009
$-1,517
Cash flow
-19.8%
Cash-on-Cash Return
1.6%
Cap rate
0.8%
Rent to Value Ratio
Active
$239,900
1
bds
|
2
ba
|
780
sqft
|
built
1969
1825 S Ocean Dr, Hallandale Beach, FL 33009
$-756
Cash flow
-16.4%
Cash-on-Cash Return
2.4%
Cap rate
0.9%
Rent to Value Ratio
Active
$159,000
1
bds
|
1
ba
|
320
sqft
|
built
1960
26 Diplomat Pkwy, Hallandale Beach, FL 33009
$-170
Cash flow
-5.6%
Cash-on-Cash Return
4.9%
Cap rate
1.1%
Rent to Value Ratio
Active
$435,000
bds
|
0
ba
|
1,000
sqft
|
built
1957
756 NW 5th St, Hallandale Beach, FL 33009
$-1,681
Cash flow
-20.2%
Cash-on-Cash Return
1.5%
Cap rate
0.4%
Rent to Value Ratio
Active
$225,000
2
bds
|
2
ba
|
1,200
sqft
|
built
1974
2101 Atlantic Shores Blvd, Hallandale Beach, FL 33009
$-556
Cash flow
-12.9%
Cash-on-Cash Return
3.2%
Cap rate
1.1%
Rent to Value Ratio
Active
$239,000
1
bds
|
2
ba
|
950
sqft
|
built
1980
2500 Parkview Dr, Hallandale Beach, FL 33009
$-832
Cash flow
-18.2%
Cash-on-Cash Return
2.0%
Cap rate
1.0%
Rent to Value Ratio
Active
$349,000
1
bds
|
2
ba
|
850
sqft
|
built
1979
3140 S Ocean Dr, Hallandale Beach, FL 33009
$-1,236
Cash flow
-18.5%
Cash-on-Cash Return
1.9%
Cap rate
0.8%
Rent to Value Ratio

Active
$619,000
2
bds
|
2
ba
|
1,240
sqft
|
built
1971
1950 S Ocean Dr, Hallandale Beach, FL 33009
$-2,564
Cash flow
-21.6%
Cash-on-Cash Return
1.2%
Cap rate
0.6%
Rent to Value Ratio
Active
$299,900
2
bds
|
2
ba
|
1,176
sqft
|
built
1969
1817 S Ocean Dr, Hallandale Beach, FL 33009
$-1,203
Cash flow
-20.9%
Cash-on-Cash Return
1.3%
Cap rate
0.9%
Rent to Value Ratio

Active
$690,000
1
bds
|
1
ba
|
844
sqft
|
built
2006
1830 S Ocean Dr, Hallandale Beach, FL 33009
$-2,357
Cash flow
-17.8%
Cash-on-Cash Return
2.0%
Cap rate
0.7%
Rent to Value Ratio
Active
$397,000
2
bds
|
2
ba
|
1,030
sqft
|
built
2015
2602 E Hallandale Beach Blvd, Hallandale Beach, FL 33009
$0
Cash flow
n/a
Cash-on-Cash Return
n/a
Cap rate
n/a
Rent to Value Ratio
Active
$4,499,000
5
bds
|
5
ba
|
4,083
sqft
|
built
2016
907 Diplomat Pkwy, Hallandale Beach, FL 33009
$-23,792
Cash flow
-27.6%
Cash-on-Cash Return
-0.2%
Cap rate
0.1%
Rent to Value Ratio
Active
$680,000
2
bds
|
2
ba
|
1,130
sqft
|
built
2002
2080 S Ocean Dr, Hallandale Beach, FL 33009
$-2,826
Cash flow
-21.7%
Cash-on-Cash Return
1.2%
Cap rate
0.6%
Rent to Value Ratio

Active
$325,000
2
bds
|
2
ba
|
1,075
sqft
|
built
1979
600 Parkview Dr, Hallandale Beach, FL 33009
$-1,197
Cash flow
-19.2%
Cash-on-Cash Return
1.7%
Cap rate
0.8%
Rent to Value Ratio
Active
$550,000
2
bds
|
2
ba
|
1,275
sqft
|
built
1970
1965 S Ocean Dr, Hallandale Beach, FL 33009
$-1,297
Cash flow
-12.3%
Cash-on-Cash Return
3.3%
Cap rate
0.6%
Rent to Value Ratio
Active
$499,000
2
bds
|
1
ba
|
999
sqft
|
built
2007
1945 S Ocean Dr, Hallandale Beach, FL 33009
$-1,691
Cash flow
-17.7%
Cash-on-Cash Return
2.1%
Cap rate
0.7%
Rent to Value Ratio

Active
$339,000
2
bds
|
2
ba
|
1,300
sqft
|
built
1970
401 Golden Isles Dr, Hallandale Beach, FL 33009
$-1,449
Cash flow
-22.3%
Cash-on-Cash Return
1.0%
Cap rate
0.8%
Rent to Value Ratio

Active
$330,000
2
bds
|
2
ba
|
1,400
sqft
|
built
1975
600 Three Islands Blvd, Hallandale Beach, FL 33009
$-1,429
Cash flow
-22.6%
Cash-on-Cash Return
0.9%
Cap rate
0.8%
Rent to Value Ratio
Active
$200,000
1
bds
|
2
ba
|
847
sqft
|
built
1969
619 NE 14th Ave, Hallandale Beach, FL 33009
$-378
Cash flow
-9.9%
Cash-on-Cash Return
3.9%
Cap rate
1.0%
Rent to Value Ratio
Active
$175,000
1
bds
|
2
ba
|
847
sqft
|
built
1968
219 NE 14th Ave, Hallandale Beach, FL 33009
$-372
Cash flow
-11.1%
Cash-on-Cash Return
3.6%
Cap rate
1.0%
Rent to Value Ratio

Active
$170,000
1
bds
|
1
ba
|
580
sqft
|
built
1963
230 SW 11th Ave, Hallandale Beach, FL 33009
$-340
Cash flow
-10.4%
Cash-on-Cash Return
3.7%
Cap rate
0.9%
Rent to Value Ratio

Active
$265,000
1
bds
|
1
ba
|
851
sqft
|
built
1972
3180 S Ocean Dr, Hallandale Beach, FL 33009
$-1,118
Cash flow
-22.0%
Cash-on-Cash Return
1.1%
Cap rate
0.9%
Rent to Value Ratio
Active
$950,000
bds
|
0
ba
|
1,998
sqft
|
built
1960
1010 NW 3rd Ave, Hallandale Beach, FL 33009
$-4,529
Cash flow
-24.9%
Cash-on-Cash Return
0.4%
Cap rate
0.2%
Rent to Value Ratio

Active
$329,000
2
bds
|
2
ba
|
1,250
sqft
|
built
1976
3113 S Ocean Dr, Hallandale Beach, FL 33009
$-679
Cash flow
-10.8%
Cash-on-Cash Return
3.7%
Cap rate
0.9%
Rent to Value Ratio
Active
$572,900
2
bds
|
2
ba
|
1,240
sqft
|
built
1971
1950 S Ocean Dr, Hallandale Beach, FL 33009
$-1,779
Cash flow
-16.2%
Cash-on-Cash Return
2.4%
Cap rate
0.5%
Rent to Value Ratio

Active
$565,000
3
bds
|
2
ba
|
1,680
sqft
|
built
2003
101 NW 2nd Ave, Hallandale Beach, FL 33009
$-1,021
Cash flow
-9.4%
Cash-on-Cash Return
4.0%
Cap rate
0.6%
Rent to Value Ratio