33019 Investment Properties for Sale
Browse homes for sale and investment properties in 33019. Refine your search by price, property type, or more.
Best cash flowing properties in 33019
Active
$999,000
3
bds
|
2
ba
|
1,686
sqft
|
built
1951
737 Hollywood Blvd, Hollywood, FL 33019
$-387
Cash flow
-2.0%
Cash-on-Cash Return
5.7%
Cap rate
0.9%
Rent to Value Ratio
Active
$759,000
3
bds
|
3
ba
|
0
sqft
|
built
1956
1163 Johnson St, Hollywood, FL 33019
$-701
Cash flow
-4.8%
Cash-on-Cash Return
5.0%
Cap rate
0.7%
Rent to Value Ratio
434 out of 541 properties for sale in 33019
Limited Results Shown
Create a free account, or log in to reveal all property listings and enjoy the complete experience.
Active
$325,000
1
bds
|
1
ba
|
590
sqft
|
built
1968
2501 S Ocean Dr, Hollywood, FL 33019
$-1,554
Cash flow
-24.9%
Cash-on-Cash Return
0.4%
Cap rate
0.6%
Rent to Value Ratio
Active
$565,000
2
bds
|
2
ba
|
1,380
sqft
|
built
1970
1501 S Ocean Dr, Hollywood, FL 33019
$-986
Cash flow
-9.1%
Cash-on-Cash Return
4.1%
Cap rate
0.6%
Rent to Value Ratio

Active
$505,000
1
bds
|
1
ba
|
761
sqft
|
built
2017
777 N Ocean Dr, Hollywood, FL 33019
$-2,176
Cash flow
-22.5%
Cash-on-Cash Return
1.0%
Cap rate
0.6%
Rent to Value Ratio
Active
$879,000
2
bds
|
2
ba
|
1,768
sqft
|
built
1973
2751 S Ocean Dr, Hollywood, FL 33019
$-2,983
Cash flow
-17.7%
Cash-on-Cash Return
2.1%
Cap rate
0.7%
Rent to Value Ratio
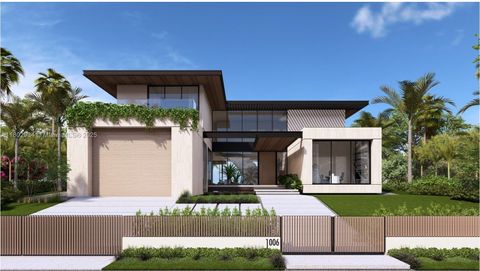
Active
$4,800,000
3
bds
|
4
ba
|
3,206
sqft
|
built
1960
1006 N Southlake Dr, Hollywood, FL 33019
$-19,412
Cash flow
-21.1%
Cash-on-Cash Return
1.3%
Cap rate
0.2%
Rent to Value Ratio

Active
$599,000
1
bds
|
2
ba
|
1,143
sqft
|
built
1973
2751 S Ocean Dr, Hollywood, FL 33019
$-2,670
Cash flow
-23.3%
Cash-on-Cash Return
0.8%
Cap rate
0.5%
Rent to Value Ratio

Active
$575,000
2
bds
|
2
ba
|
1,110
sqft
|
built
1968
3505 S Ocean Dr, Hollywood, FL 33019
$-1,012
Cash flow
-9.2%
Cash-on-Cash Return
4.0%
Cap rate
0.7%
Rent to Value Ratio
Active
$420,000
2
bds
|
2
ba
|
1,270
sqft
|
built
1973
3800 S Ocean Dr, Hollywood, FL 33019
$-1,384
Cash flow
-17.2%
Cash-on-Cash Return
2.2%
Cap rate
0.8%
Rent to Value Ratio
Active
$1,900,000
3
bds
|
3
ba
|
2,308
sqft
|
built
2005
3101 S Ocean Dr, Hollywood, FL 33019
$-7,220
Cash flow
-19.8%
Cash-on-Cash Return
1.6%
Cap rate
0.5%
Rent to Value Ratio
Active
$785,000
2
bds
|
2
ba
|
1,000
sqft
|
built
1970
400 N Surf Rd, Hollywood, FL 33019
$-3,316
Cash flow
-22.0%
Cash-on-Cash Return
1.1%
Cap rate
0.5%
Rent to Value Ratio
Active
$480,000
1
bds
|
2
ba
|
835
sqft
|
built
1968
2501 S Ocean Dr, Hollywood, FL 33019
$-1,629
Cash flow
-17.7%
Cash-on-Cash Return
2.1%
Cap rate
0.7%
Rent to Value Ratio

Active
$1,090,000
3
bds
|
2
ba
|
1,679
sqft
|
built
1969
1103 Washington St, Hollywood, FL 33019
$-2,176
Cash flow
-10.4%
Cash-on-Cash Return
3.8%
Cap rate
0.5%
Rent to Value Ratio

Active
$279,900
1
bds
|
2
ba
|
787
sqft
|
built
1966
1901 S Ocean Dr, Hollywood, FL 33019
$-1,049
Cash flow
-19.6%
Cash-on-Cash Return
1.7%
Cap rate
0.9%
Rent to Value Ratio

Active
$995,000
3
bds
|
3
ba
|
2,025
sqft
|
built
1999
6001 N Ocean Dr, Hollywood, FL 33019
$-4,163
Cash flow
-21.8%
Cash-on-Cash Return
1.1%
Cap rate
0.7%
Rent to Value Ratio
Active
$539,000
2
bds
|
2
ba
|
1,400
sqft
|
built
1973
2101 S Ocean Dr, Hollywood, FL 33019
$-2,466
Cash flow
-23.9%
Cash-on-Cash Return
0.7%
Cap rate
0.6%
Rent to Value Ratio
Active
$539,000
1
bds
|
2
ba
|
835
sqft
|
built
1968
2501 S Ocean Dr, Hollywood, FL 33019
$-2,398
Cash flow
-23.2%
Cash-on-Cash Return
0.8%
Cap rate
0.5%
Rent to Value Ratio
Active
$500,000
1
bds
|
1
ba
|
745
sqft
|
built
1968
2501 S Ocean Dr, Hollywood, FL 33019
$-2,256
Cash flow
-23.5%
Cash-on-Cash Return
0.7%
Cap rate
0.6%
Rent to Value Ratio

Active
$497,000
2
bds
|
2
ba
|
1,170
sqft
|
built
1966
3001 S Ocean Dr, Hollywood, FL 33019
$-2,036
Cash flow
-21.4%
Cash-on-Cash Return
1.2%
Cap rate
0.6%
Rent to Value Ratio

Active
$1,275,000
4
bds
|
4
ba
|
2,120
sqft
|
built
1955
1318 Washington St, Hollywood, FL 33019
$-1,827
Cash flow
-7.5%
Cash-on-Cash Return
4.4%
Cap rate
0.8%
Rent to Value Ratio

Active
$2,299,000
3
bds
|
3
ba
|
2,115
sqft
|
built
2005
3101 S Ocean Dr, Hollywood, FL 33019
$-7,689
Cash flow
-17.4%
Cash-on-Cash Return
2.1%
Cap rate
0.4%
Rent to Value Ratio

Active
$707,800
2
bds
|
2
ba
|
1,430
sqft
|
built
1970
1501 S Ocean Dr, Hollywood, FL 33019
$-2,109
Cash flow
-15.5%
Cash-on-Cash Return
2.6%
Cap rate
0.7%
Rent to Value Ratio

Active
$894,999
2
bds
|
2
ba
|
1,570
sqft
|
built
1982
1201 S Ocean Dr, Hollywood, FL 33019
$-3,503
Cash flow
-20.4%
Cash-on-Cash Return
1.5%
Cap rate
0.6%
Rent to Value Ratio
Active
$1,795,000
3
bds
|
4
ba
|
2,859
sqft
|
built
1999
999 Harbor Vw N, Hollywood, FL 33019
$-5,708
Cash flow
-16.6%
Cash-on-Cash Return
2.3%
Cap rate
0.5%
Rent to Value Ratio
Active
$635,000
2
bds
|
2
ba
|
1,570
sqft
|
built
1982
1201 S Ocean Dr, Hollywood, FL 33019
$-2,900
Cash flow
-23.8%
Cash-on-Cash Return
0.7%
Cap rate
0.6%
Rent to Value Ratio
Active
$699,000
2
bds
|
2
ba
|
1,290
sqft
|
built
1978
2301 S Ocean Dr, Hollywood, FL 33019
$-2,995
Cash flow
-22.4%
Cash-on-Cash Return
1.0%
Cap rate
0.6%
Rent to Value Ratio

Active
$518,000
2
bds
|
2
ba
|
1,553
sqft
|
built
1973
3800 S Ocean Dr, Hollywood, FL 33019
$-2,353
Cash flow
-23.7%
Cash-on-Cash Return
0.7%
Cap rate
0.8%
Rent to Value Ratio

Active
$545,000
1
bds
|
1
ba
|
874
sqft
|
built
1969
3801 S Ocean Dr, Hollywood, FL 33019
$-2,263
Cash flow
-21.7%
Cash-on-Cash Return
1.2%
Cap rate
0.6%
Rent to Value Ratio

Active
$498,800
1
bds
|
2
ba
|
835
sqft
|
built
2004
2501 S Ocean Dr, Hollywood, FL 33019
$-2,015
Cash flow
-21.1%
Cash-on-Cash Return
1.3%
Cap rate
0.7%
Rent to Value Ratio

Active
$1,250,000
3
bds
|
4
ba
|
2,000
sqft
|
built
1998
381 Franklin St, Hollywood, FL 33019
$-4,214
Cash flow
-17.6%
Cash-on-Cash Return
2.1%
Cap rate
0.5%
Rent to Value Ratio

Active
$629,999
3
bds
|
3
ba
|
1,748
sqft
|
built
1997
1125 Canella Ln, Hollywood, FL 33019
$-2,091
Cash flow
-17.3%
Cash-on-Cash Return
2.2%
Cap rate
0.6%
Rent to Value Ratio

Active
$295,000
1
bds
|
1
ba
|
366
sqft
|
built
2018
777 N Ocean Dr, Hollywood, FL 33019
$-837
Cash flow
-14.8%
Cash-on-Cash Return
2.7%
Cap rate
0.9%
Rent to Value Ratio
Active
$545,000
1
bds
|
2
ba
|
820
sqft
|
built
1970
400 N Surf Rd, Hollywood, FL 33019
$-1,458
Cash flow
-14.0%
Cash-on-Cash Return
2.9%
Cap rate
0.6%
Rent to Value Ratio

Active
$590,000
2
bds
|
1
ba
|
1,270
sqft
|
built
1947
1340 Adams St, Hollywood, FL 33019
$-798
Cash flow
-7.1%
Cash-on-Cash Return
4.5%
Cap rate
0.6%
Rent to Value Ratio
Active
$1,749,000
3
bds
|
3
ba
|
2,308
sqft
|
built
2005
3101 S Ocean Dr, Hollywood, FL 33019
$-8,025
Cash flow
-23.9%
Cash-on-Cash Return
0.6%
Cap rate
0.5%
Rent to Value Ratio

Active
$649,900
3
bds
|
2
ba
|
1,420
sqft
|
built
1996
1630 Sweetbay Way, Hollywood, FL 33019
$-1,648
Cash flow
-13.2%
Cash-on-Cash Return
3.1%
Cap rate
0.7%
Rent to Value Ratio

Active
$510,000
3
bds
|
3
ba
|
1,604
sqft
|
built
1995
1551 Seagrape Way, Hollywood, FL 33019
$-1,412
Cash flow
-14.4%
Cash-on-Cash Return
2.8%
Cap rate
0.7%
Rent to Value Ratio

Active
$460,000
2
bds
|
2
ba
|
1,270
sqft
|
built
1973
3800 S Ocean Dr, Hollywood, FL 33019
$-1,754
Cash flow
-19.9%
Cash-on-Cash Return
1.6%
Cap rate
0.8%
Rent to Value Ratio
Active
$385,000
1
bds
|
1
ba
|
883
sqft
|
built
1966
3001 S Ocean Dr, Hollywood, FL 33019
$-1,695
Cash flow
-23.0%
Cash-on-Cash Return
0.9%
Cap rate
0.7%
Rent to Value Ratio