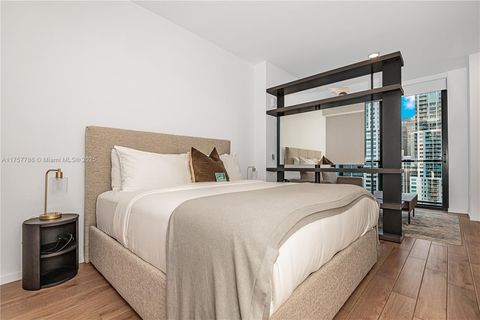
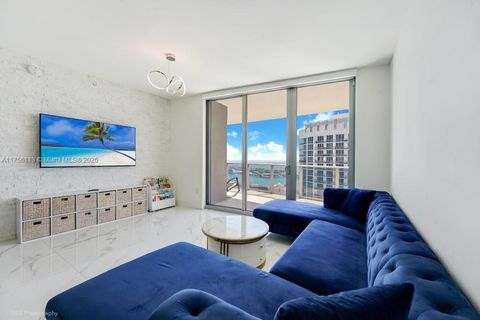
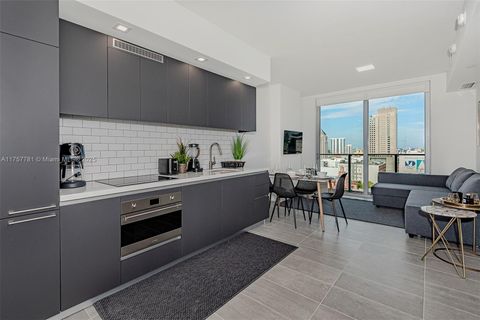
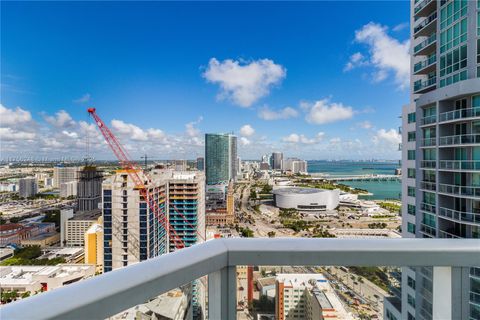
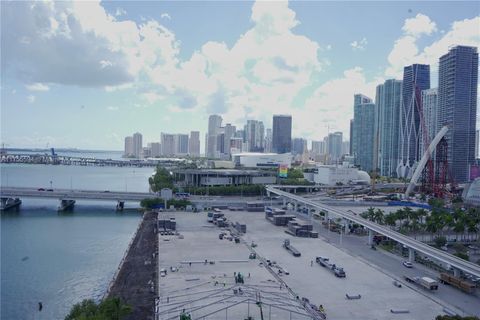
33132 Investment Properties for Sale
Browse homes for sale and investment properties in 33132. Refine your search by price, property type, or more.
Best cash flowing properties in 33132

Active
$299,000
bds
|
1
ba
|
567
sqft
|
built
2007
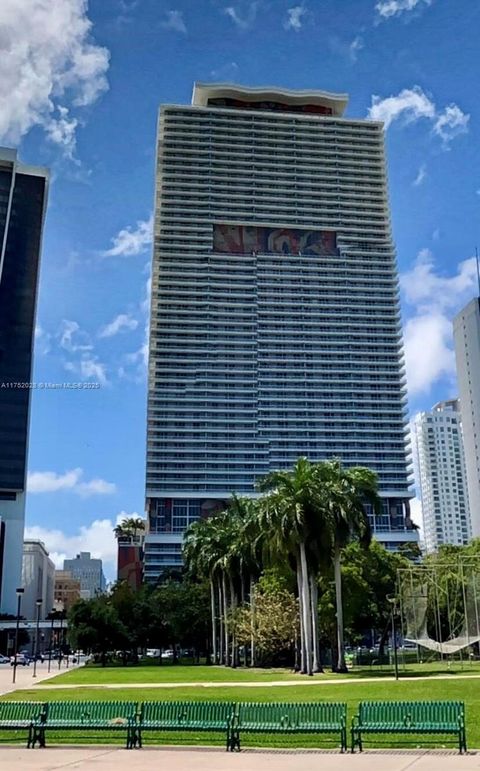
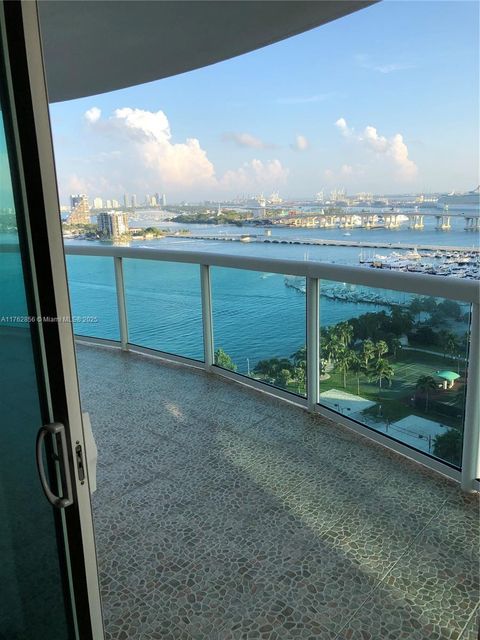
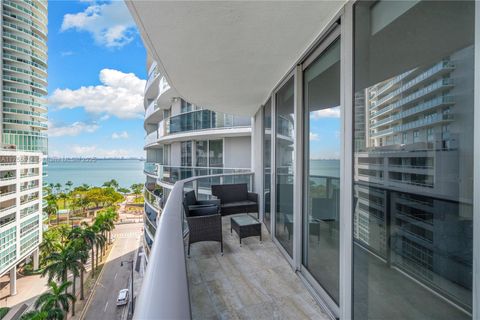
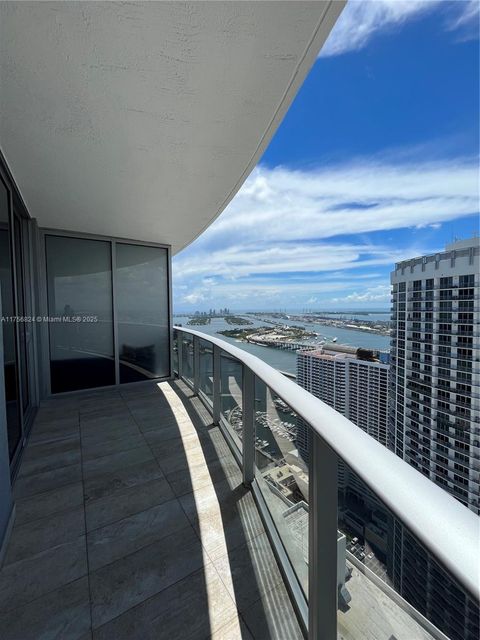
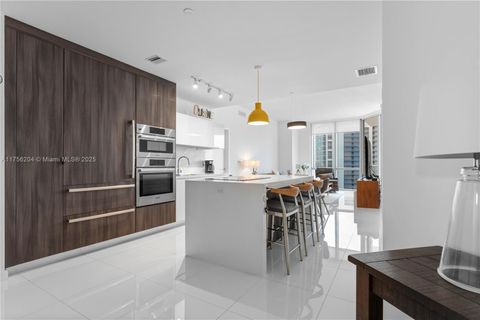
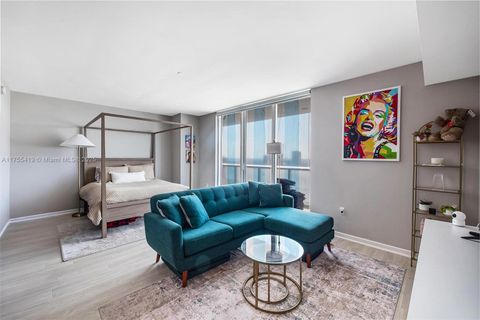
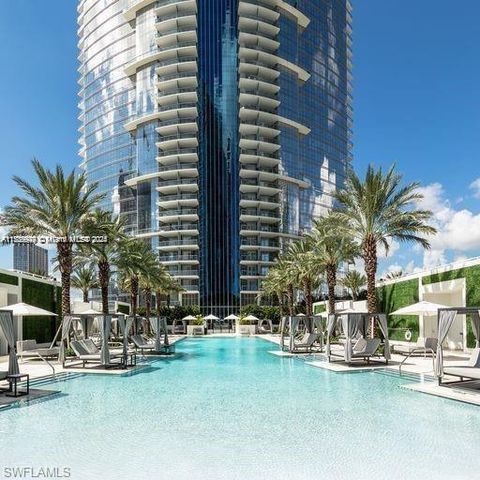
50 Biscayne Blvd, Miami, FL 33132
$-779
Cash flow
-13.6%
Cash-on-Cash Return
3.0%
Cap rate
0.9%
Rent to Value Ratio
Active
$374,900
bds
|
1
ba
|
449
sqft
|
built
2007
50 Biscayne Blvd, Miami, FL 33132
$-860
Cash flow
-12.0%
Cash-on-Cash Return
3.4%
Cap rate
0.8%
Rent to Value Ratio
416 out of 499 properties for sale in 33132
Limited Results Shown
Create a free account, or log in to reveal all property listings and enjoy the complete experience.
Active
$660,000
1
bds
|
2
ba
|
948
sqft
|
built
2008
888 Biscayne Blvd, Miami, FL 33132
$-2,143
Cash flow
-16.9%
Cash-on-Cash Return
2.3%
Cap rate
0.7%
Rent to Value Ratio

Active
$579,000
2
bds
|
2
ba
|
1,058
sqft
|
built
2008
244 Biscayne Blvd, Miami, FL 33132
$-3,398
Cash flow
-30.6%
Cash-on-Cash Return
-0.9%
Cap rate
0.6%
Rent to Value Ratio
Active
$399,000
2
bds
|
1
ba
|
950
sqft
|
built
2007
133 NE 2nd Ave, Miami, FL 33132
$-1,464
Cash flow
-19.1%
Cash-on-Cash Return
1.7%
Cap rate
0.7%
Rent to Value Ratio
Active
$499,000
bds
|
1
ba
|
455
sqft
|
built
2023
398 NE 5th St, Miami, FL 33132
$-2,690
Cash flow
-28.1%
Cash-on-Cash Return
-0.3%
Cap rate
0.7%
Rent to Value Ratio
Active
$659,000
2
bds
|
2
ba
|
1,048
sqft
|
built
2008
1750 N Bayshore Dr, Miami, FL 33132
$-3,181
Cash flow
-25.2%
Cash-on-Cash Return
0.4%
Cap rate
0.7%
Rent to Value Ratio
Active
$750,000
1
bds
|
1
ba
|
1,267
sqft
|
built
2005
1749 NE Miami Ct, Miami, FL 33132
$-2,752
Cash flow
-19.1%
Cash-on-Cash Return
1.7%
Cap rate
0.6%
Rent to Value Ratio
Active
$398,000
1
bds
|
1
ba
|
825
sqft
|
built
2007
1750 N Bayshore Dr, Miami, FL 33132
$-1,419
Cash flow
-18.6%
Cash-on-Cash Return
1.9%
Cap rate
0.7%
Rent to Value Ratio
Active
$352,500
1
bds
|
2
ba
|
840
sqft
|
built
1980
555 NE 15th St, Miami, FL 33132
$-1,661
Cash flow
-24.6%
Cash-on-Cash Return
0.5%
Cap rate
0.7%
Rent to Value Ratio
Active
$1,499,000
3
bds
|
3
ba
|
2,189
sqft
|
built
2007
1800 N Bayshore Dr, Miami, FL 33132
$-6,841
Cash flow
-23.8%
Cash-on-Cash Return
0.7%
Cap rate
0.4%
Rent to Value Ratio
Active
$899,000
2
bds
|
3
ba
|
1,441
sqft
|
built
2018
488 NE 18th St, Miami, FL 33132
$-2,851
Cash flow
-16.5%
Cash-on-Cash Return
2.3%
Cap rate
0.7%
Rent to Value Ratio
Active
$300,000
1
bds
|
2
ba
|
506
sqft
|
built
2008
253 NE 2nd St, Miami, FL 33132
$-1,012
Cash flow
-17.6%
Cash-on-Cash Return
2.1%
Cap rate
0.8%
Rent to Value Ratio
Active
$435,000
1
bds
|
1
ba
|
651
sqft
|
built
2007
1900 N Bayshore Dr, Miami, FL 33132
$-1,509
Cash flow
-18.1%
Cash-on-Cash Return
2.0%
Cap rate
0.6%
Rent to Value Ratio
Active
$1,349,000
2
bds
|
3
ba
|
1,560
sqft
|
built
2019
851 NE 1st Ave, Miami, FL 33132
$-6,607
Cash flow
-25.6%
Cash-on-Cash Return
0.3%
Cap rate
0.5%
Rent to Value Ratio
Active
$1,650,000
3
bds
|
4
ba
|
2,204
sqft
|
built
2019
851 NE 1st Ave, Miami, FL 33132
$-7,137
Cash flow
-22.6%
Cash-on-Cash Return
1.0%
Cap rate
0.7%
Rent to Value Ratio
Active
$700,000
1
bds
|
2
ba
|
1,018
sqft
|
built
2019
851 NE 1st St, Miami, FL 33132
$-3,070
Cash flow
-22.9%
Cash-on-Cash Return
0.9%
Cap rate
0.7%
Rent to Value Ratio
Active
$885,000
2
bds
|
2
ba
|
1,357
sqft
|
built
2007
50 Biscayne Blvd, Miami, FL 33132
$-3,389
Cash flow
-20.0%
Cash-on-Cash Return
1.6%
Cap rate
0.6%
Rent to Value Ratio
Active
$635,000
bds
|
1
ba
|
362
sqft
|
built
2022
398 NE 5th St, Miami, FL 33132
$-1,843
Cash flow
-15.1%
Cash-on-Cash Return
2.7%
Cap rate
0.6%
Rent to Value Ratio
Active
$1,200,000
2
bds
|
3
ba
|
1,229
sqft
|
built
2018
488 NE 18th St, Miami, FL 33132
$-4,976
Cash flow
-21.6%
Cash-on-Cash Return
1.2%
Cap rate
0.4%
Rent to Value Ratio

Active
$345,000
1
bds
|
1
ba
|
662
sqft
|
built
2007
133 NE 2nd Ave, Miami, FL 33132
$-951
Cash flow
-14.4%
Cash-on-Cash Return
2.8%
Cap rate
0.7%
Rent to Value Ratio
Active
$429,000
1
bds
|
1
ba
|
516
sqft
|
built
2022
227 NE 2nd St, Miami, FL 33132
$-1,154
Cash flow
-14.0%
Cash-on-Cash Return
2.9%
Cap rate
0.8%
Rent to Value Ratio
Active
$725,000
2
bds
|
2
ba
|
1,203
sqft
|
built
2008
253 NE 2nd St, Miami, FL 33132
$-3,479
Cash flow
-25.0%
Cash-on-Cash Return
0.4%
Cap rate
0.5%
Rent to Value Ratio
Active
$859,000
2
bds
|
3
ba
|
1,171
sqft
|
built
2018
488 NE 18th St, Miami, FL 33132
$-2,921
Cash flow
-17.7%
Cash-on-Cash Return
2.1%
Cap rate
0.6%
Rent to Value Ratio
Active
$1,125,000
2
bds
|
3
ba
|
1,547
sqft
|
built
2019
851 NE 1st Ave, Miami, FL 33132
$-4,177
Cash flow
-19.4%
Cash-on-Cash Return
1.7%
Cap rate
0.8%
Rent to Value Ratio
Active
$407,000
bds
|
1
ba
|
567
sqft
|
built
2007
50 Biscayne Blvd, Miami, FL 33132
$-1,616
Cash flow
-20.7%
Cash-on-Cash Return
1.4%
Cap rate
0.6%
Rent to Value Ratio
Active
$419,000
1
bds
|
1
ba
|
549
sqft
|
built
2022
227 NE 2nd St, Miami, FL 33132
$-1,579
Cash flow
-19.7%
Cash-on-Cash Return
1.6%
Cap rate
0.8%
Rent to Value Ratio
Active
$368,000
1
bds
|
2
ba
|
840
sqft
|
built
1980
555 NE 15th St, Miami, FL 33132
$-1,143
Cash flow
-16.2%
Cash-on-Cash Return
2.4%
Cap rate
0.9%
Rent to Value Ratio
Active
$1,651,111
2
bds
|
2
ba
|
818
sqft
|
built
2022
398 NE 5th St, Miami, FL 33132
$-7,203
Cash flow
-22.8%
Cash-on-Cash Return
0.9%
Cap rate
0.4%
Rent to Value Ratio
Active
$355,000
1
bds
|
1
ba
|
825
sqft
|
built
2007
1750 N Bayshore Dr, Miami, FL 33132
$-1,973
Cash flow
-29.0%
Cash-on-Cash Return
-0.5%
Cap rate
0.8%
Rent to Value Ratio
Active
$396,000
1
bds
|
1
ba
|
791
sqft
|
built
2007
1750 N Bayshore Dr, Miami, FL 33132
$-1,581
Cash flow
-20.8%
Cash-on-Cash Return
1.4%
Cap rate
0.7%
Rent to Value Ratio
Active
$1,245,000
2
bds
|
3
ba
|
1,560
sqft
|
built
2019
851 NE 1st Ave, Miami, FL 33132
$-5,403
Cash flow
-22.6%
Cash-on-Cash Return
0.9%
Cap rate
0.6%
Rent to Value Ratio
Active
$449,000
1
bds
|
2
ba
|
1,094
sqft
|
built
1986
1717 N Bayshore Dr, Miami, FL 33132
$-1,531
Cash flow
-17.8%
Cash-on-Cash Return
2.1%
Cap rate
0.6%
Rent to Value Ratio

Active
$360,000
bds
|
1
ba
|
580
sqft
|
built
2018
1600 NE 1st Ave, Miami, FL 33132
$-1,225
Cash flow
-17.8%
Cash-on-Cash Return
2.1%
Cap rate
0.7%
Rent to Value Ratio

Active
$1,750,000
3
bds
|
4
ba
|
2,188
sqft
|
built
2019
851 NE 1st Ave, Miami, FL 33132
$-7,716
Cash flow
-23.0%
Cash-on-Cash Return
0.9%
Cap rate
0.6%
Rent to Value Ratio

Active
$1,499,000
3
bds
|
3
ba
|
1,150
sqft
|
built
2022
398 NE 5th St, Miami, FL 33132
$-5,650
Cash flow
-19.7%
Cash-on-Cash Return
1.6%
Cap rate
0.5%
Rent to Value Ratio
Active
$375,000
1
bds
|
1
ba
|
825
sqft
|
built
2007
1750 N Bayshore Dr, Miami, FL 33132
$-1,211
Cash flow
-16.8%
Cash-on-Cash Return
2.3%
Cap rate
0.7%
Rent to Value Ratio

Active
$445,000
1
bds
|
1
ba
|
825
sqft
|
built
2008
1750 N Bayshore Dr, Miami, FL 33132
$-1,558
Cash flow
-18.3%
Cash-on-Cash Return
1.9%
Cap rate
0.7%
Rent to Value Ratio

Active
$419,000
1
bds
|
1
ba
|
825
sqft
|
built
2008
1750 N Bayshore Dr, Miami, FL 33132
$-1,669
Cash flow
-20.8%
Cash-on-Cash Return
1.4%
Cap rate
0.7%
Rent to Value Ratio
Active
$329,900
1
bds
|
1
ba
|
825
sqft
|
built
2008
1750 N Bayshore Dr, Miami, FL 33132
$-1,189
Cash flow
-18.8%
Cash-on-Cash Return
1.8%
Cap rate
0.8%
Rent to Value Ratio