33137 Investment Properties for Sale
Browse homes for sale and investment properties in 33137. Refine your search by price, property type, or more.
Best cash flowing properties in 33137
Active
$425,000
1
bds
|
2
ba
|
990
sqft
|
built
1973
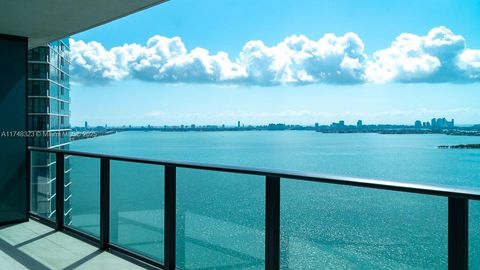
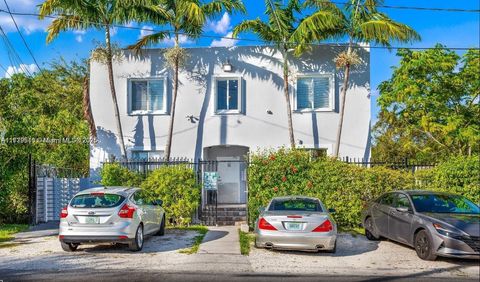
600 NE 36th St, Miami, FL 33137
$-925
Cash flow
-11.4%
Cash-on-Cash Return
3.5%
Cap rate
0.8%
Rent to Value Ratio

Active
$290,000
bds
|
1
ba
|
488
sqft
|
built
2015
4250 Biscayne Blvd, Miami, FL 33137
$-1,239
Cash flow
-22.3%
Cash-on-Cash Return
1.0%
Cap rate
0.8%
Rent to Value Ratio
381 out of 408 properties for sale in 33137
Limited Results Shown
Create a free account, or log in to reveal all property listings and enjoy the complete experience.

Active
$585,000
1
bds
|
1
ba
|
711
sqft
|
built
2019
3900 Biscayne Blvd, Miami, FL 33137
$-1,848
Cash flow
-16.5%
Cash-on-Cash Return
2.4%
Cap rate
0.8%
Rent to Value Ratio

Active
$460,000
1
bds
|
1
ba
|
683
sqft
|
built
2018
121 NE 34th St, Miami, FL 33137
$-2,110
Cash flow
-23.9%
Cash-on-Cash Return
0.6%
Cap rate
0.6%
Rent to Value Ratio

Active
$928,888
2
bds
|
2
ba
|
1,045
sqft
|
built
2018
121 NE 34th St, Miami, FL 33137
$-3,727
Cash flow
-20.9%
Cash-on-Cash Return
1.3%
Cap rate
0.6%
Rent to Value Ratio

Active
$1,090,000
2
bds
|
3
ba
|
1,143
sqft
|
built
2019
480 NE 31st St, Miami, FL 33137
$-4,918
Cash flow
-23.5%
Cash-on-Cash Return
0.7%
Cap rate
0.5%
Rent to Value Ratio

Active
$570,000
2
bds
|
2
ba
|
988
sqft
|
built
2015
4250 Biscayne Blvd, Miami, FL 33137
$-2,052
Cash flow
-18.8%
Cash-on-Cash Return
1.8%
Cap rate
0.8%
Rent to Value Ratio

Active
$920,000
2
bds
|
2
ba
|
1,067
sqft
|
built
2018
650 NE 32nd St, Miami, FL 33137
$-3,602
Cash flow
-20.4%
Cash-on-Cash Return
1.4%
Cap rate
0.6%
Rent to Value Ratio

Active
$530,000
1
bds
|
1
ba
|
673
sqft
|
built
2018
121 NE 34th St, Miami, FL 33137
$-2,042
Cash flow
-20.1%
Cash-on-Cash Return
1.5%
Cap rate
0.7%
Rent to Value Ratio

Active
$2,185,000
2
bds
|
0
ba
|
2,499
sqft
|
built
1945
4727 NE 1st Ct, Miami, FL 33137
$-7,569
Cash flow
-18.1%
Cash-on-Cash Return
2.0%
Cap rate
0.3%
Rent to Value Ratio
Active
$1,550,000
2
bds
|
3
ba
|
1,673
sqft
|
built
2010
2020 N Bayshore Dr, Miami, FL 33137
$-7,750
Cash flow
-26.1%
Cash-on-Cash Return
0.1%
Cap rate
0.4%
Rent to Value Ratio

Active
$595,000
2
bds
|
2
ba
|
944
sqft
|
built
2018
501 NE 31st St, Miami, FL 33137
$-2,360
Cash flow
-20.7%
Cash-on-Cash Return
1.4%
Cap rate
0.7%
Rent to Value Ratio

Active
$579,000
2
bds
|
2
ba
|
1,218
sqft
|
built
1973
600 NE 36th St, Miami, FL 33137
$-1,977
Cash flow
-17.8%
Cash-on-Cash Return
2.0%
Cap rate
0.7%
Rent to Value Ratio
Active
$630,000
1
bds
|
1
ba
|
700
sqft
|
built
2019
3900 Biscayne Blvd, Miami, FL 33137
$-2,755
Cash flow
-22.8%
Cash-on-Cash Return
0.9%
Cap rate
0.6%
Rent to Value Ratio
Active
$650,000
2
bds
|
3
ba
|
1,158
sqft
|
built
2005
601 NE 36th St, Miami, FL 33137
$-2,704
Cash flow
-21.7%
Cash-on-Cash Return
1.2%
Cap rate
0.7%
Rent to Value Ratio

Active
$5,300,000
4
bds
|
4
ba
|
3,543
sqft
|
built
1956
530 Sabal Palm Rd, Miami, FL 33137
$-24,192
Cash flow
-23.8%
Cash-on-Cash Return
0.7%
Cap rate
0.2%
Rent to Value Ratio

Active
$820,000
2
bds
|
3
ba
|
1,060
sqft
|
built
2017
2900 NE 7th Ave, Miami, FL 33137
$-2,782
Cash flow
-17.7%
Cash-on-Cash Return
2.1%
Cap rate
0.7%
Rent to Value Ratio

Active
$685,000
2
bds
|
2
ba
|
864
sqft
|
built
2018
121 NE 34th St, Miami, FL 33137
$-3,203
Cash flow
-24.4%
Cash-on-Cash Return
0.5%
Cap rate
0.6%
Rent to Value Ratio

Active
$560,000
1
bds
|
2
ba
|
773
sqft
|
built
2006
601 NE 36th St, Miami, FL 33137
$-2,157
Cash flow
-20.1%
Cash-on-Cash Return
1.5%
Cap rate
0.6%
Rent to Value Ratio
Active
$925,000
2
bds
|
3
ba
|
1,151
sqft
|
built
2018
650 NE 32nd St, Miami, FL 33137
$-3,152
Cash flow
-17.8%
Cash-on-Cash Return
2.1%
Cap rate
0.7%
Rent to Value Ratio

Active
$489,900
1
bds
|
1
ba
|
593
sqft
|
built
2018
121 NE 34th St, Miami, FL 33137
$-1,841
Cash flow
-19.6%
Cash-on-Cash Return
1.6%
Cap rate
0.6%
Rent to Value Ratio

Active
$595,000
1
bds
|
1
ba
|
713
sqft
|
built
2018
121 NE 34th St, Miami, FL 33137
$-2,492
Cash flow
-21.9%
Cash-on-Cash Return
1.1%
Cap rate
0.6%
Rent to Value Ratio

Active
$750,000
2
bds
|
2
ba
|
912
sqft
|
built
2017
2900 NE 7th Ave, Miami, FL 33137
$-2,277
Cash flow
-15.8%
Cash-on-Cash Return
2.5%
Cap rate
0.7%
Rent to Value Ratio

Active
$1,125,000
2
bds
|
2
ba
|
1,128
sqft
|
built
2010
2020 N Bayshore Dr, Miami, FL 33137
$-4,359
Cash flow
-20.2%
Cash-on-Cash Return
1.5%
Cap rate
0.5%
Rent to Value Ratio

Active
$1,190,000
2
bds
|
3
ba
|
1,870
sqft
|
built
2005
601 NE 36th St, Miami, FL 33137
$-5,122
Cash flow
-22.5%
Cash-on-Cash Return
1.0%
Cap rate
0.6%
Rent to Value Ratio

Active
$4,790,000
4
bds
|
3
ba
|
2,559
sqft
|
built
1957
550 Pidgeon Plum Ln, Miami, FL 33137
$-21,869
Cash flow
-23.8%
Cash-on-Cash Return
0.7%
Cap rate
0.1%
Rent to Value Ratio

Active
$550,000
1
bds
|
1
ba
|
819
sqft
|
built
2016
601 NE 27th St, Miami, FL 33137
$-1,781
Cash flow
-16.9%
Cash-on-Cash Return
2.3%
Cap rate
0.6%
Rent to Value Ratio
Active
$959,999
2
bds
|
2
ba
|
1,535
sqft
|
built
2007
3250 NE 1st Ave, Miami, FL 33137
$-1,911
Cash flow
-10.4%
Cash-on-Cash Return
3.8%
Cap rate
0.8%
Rent to Value Ratio

Active
$920,000
2
bds
|
3
ba
|
1,186
sqft
|
built
2018
480 NE 31st St, Miami, FL 33137
$-3,497
Cash flow
-19.8%
Cash-on-Cash Return
1.6%
Cap rate
0.7%
Rent to Value Ratio

Active
$795,000
2
bds
|
2
ba
|
1,104
sqft
|
built
2015
460 NE 28th St, Miami, FL 33137
$-2,735
Cash flow
-17.9%
Cash-on-Cash Return
2.0%
Cap rate
0.7%
Rent to Value Ratio
Active
$460,000
2
bds
|
2
ba
|
1,092
sqft
|
built
2004
2000 N Bayshore Dr, Miami, FL 33137
$-1,833
Cash flow
-20.8%
Cash-on-Cash Return
1.4%
Cap rate
0.7%
Rent to Value Ratio
Active
$1,065,000
2
bds
|
2
ba
|
1,088
sqft
|
built
2018
3131 NE 7th Ave, Miami, FL 33137
$-4,258
Cash flow
-20.9%
Cash-on-Cash Return
1.3%
Cap rate
0.5%
Rent to Value Ratio

Active
$665,000
2
bds
|
2
ba
|
1,082
sqft
|
built
2007
3250 NE 1st Ave, Miami, FL 33137
$-2,983
Cash flow
-23.4%
Cash-on-Cash Return
0.8%
Cap rate
0.6%
Rent to Value Ratio
Active
$1,750,000
12
bds
|
0
ba
|
4,176
sqft
|
built
1924
121 NE 55th St, Miami, FL 33137
$-7,761
Cash flow
-23.1%
Cash-on-Cash Return
0.8%
Cap rate
0.2%
Rent to Value Ratio

Active
$530,000
1
bds
|
2
ba
|
618
sqft
|
built
2018
501 NE 31st St, Miami, FL 33137
$-1,822
Cash flow
-17.9%
Cash-on-Cash Return
2.0%
Cap rate
0.7%
Rent to Value Ratio

Active
$2,350,000
3
bds
|
4
ba
|
2,201
sqft
|
built
2010
2020 N Bayshore Dr, Miami, FL 33137
$-11,387
Cash flow
-25.3%
Cash-on-Cash Return
0.3%
Cap rate
0.4%
Rent to Value Ratio

Active
$720,000
2
bds
|
2
ba
|
1,107
sqft
|
built
2015
460 NE 28th St, Miami, FL 33137
$-2,756
Cash flow
-20.0%
Cash-on-Cash Return
1.6%
Cap rate
0.7%
Rent to Value Ratio

Active
$630,000
2
bds
|
2
ba
|
988
sqft
|
built
2015
4250 Biscayne Blvd, Miami, FL 33137
$-3,063
Cash flow
-25.4%
Cash-on-Cash Return
0.3%
Cap rate
0.6%
Rent to Value Ratio
Active
$1,200,000
2
bds
|
2
ba
|
1,088
sqft
|
built
2018
3131 NE 7th Ave, Miami, FL 33137
$-4,427
Cash flow
-19.2%
Cash-on-Cash Return
1.7%
Cap rate
0.5%
Rent to Value Ratio
Active
$384,000
1
bds
|
2
ba
|
835
sqft
|
built
2004
455 NE 25th St, Miami, FL 33137
$-1,363
Cash flow
-18.5%
Cash-on-Cash Return
1.9%
Cap rate
0.7%
Rent to Value Ratio