33141 Investment Properties for Sale
Browse homes for sale and investment properties in 33141. Refine your search by price, property type, or more.
Best cash flowing properties in 33141
Active
$360,000
1
bds
|
2
ba
|
864
sqft
|
built
1982
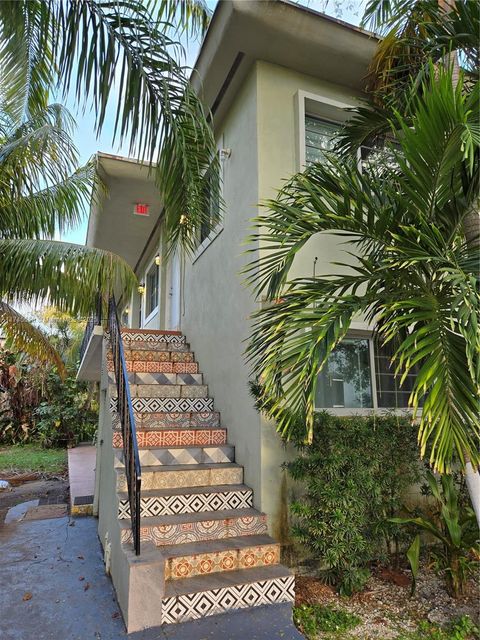
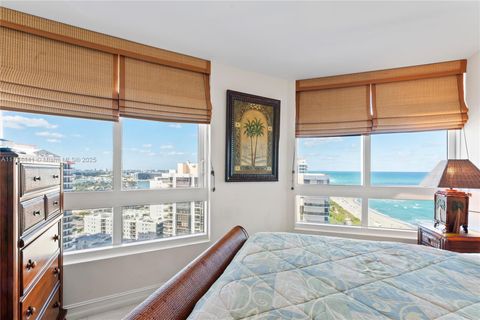
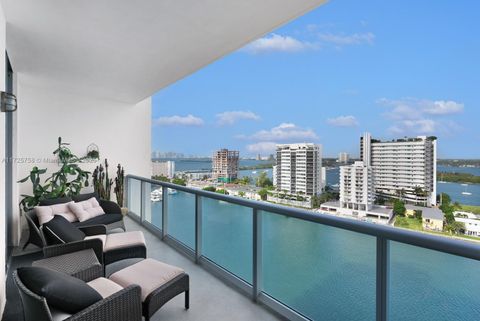
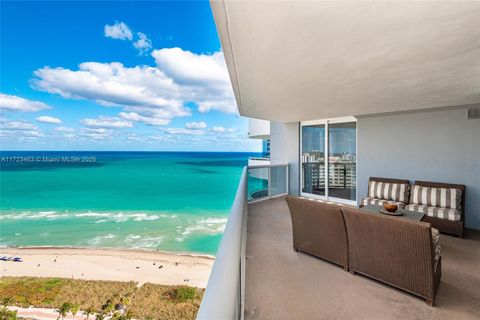
8100 Byron Ave, Miami Beach, FL 33141
$-425
Cash flow
-6.2%
Cash-on-Cash Return
4.7%
Cap rate
0.8%
Rent to Value Ratio

Active
$179,999
1
bds
|
1
ba
|
620
sqft
|
built
1972
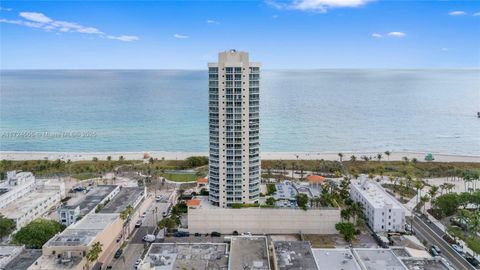
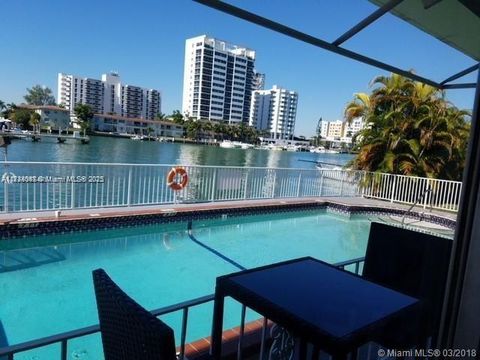
1801 S Treasure Dr, North Bay Village, FL 33141
$-551
Cash flow
-16.0%
Cash-on-Cash Return
2.5%
Cap rate
1.0%
Rent to Value Ratio
379 out of 422 properties for sale in 33141
Limited Results Shown
Create a free account, or log in to reveal all property listings and enjoy the complete experience.
Active
$399,000
2
bds
|
2
ba
|
1,030
sqft
|
built
1987
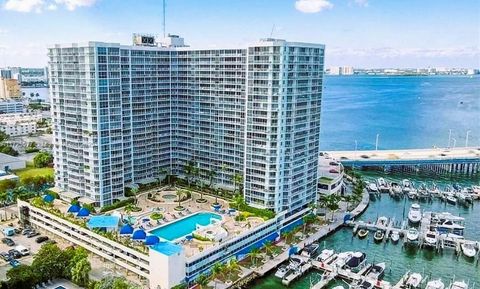
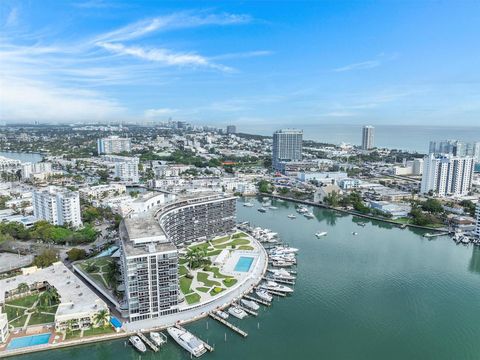
7601 E Treasure Dr, North Bay Village, FL 33141
$-1,090
Cash flow
-14.3%
Cash-on-Cash Return
2.9%
Cap rate
0.7%
Rent to Value Ratio

Active
$6,550,000
4
bds
|
3
ba
|
3,650
sqft
|
built
1953
765 N Shore Dr, Miami Beach, FL 33141
$-28,277
Cash flow
-22.5%
Cash-on-Cash Return
1.0%
Cap rate
0.1%
Rent to Value Ratio
Active
$370,000
2
bds
|
2
ba
|
885
sqft
|
built
1980
6445 Indian Creek Dr, Miami Beach, FL 33141
$-1,256
Cash flow
-17.7%
Cash-on-Cash Return
2.1%
Cap rate
0.6%
Rent to Value Ratio
Active
$7,500,000
4
bds
|
4
ba
|
3,625
sqft
|
built
1949
1670 Daytonia Rd, Miami Beach, FL 33141
$-37,235
Cash flow
-25.9%
Cash-on-Cash Return
0.2%
Cap rate
0.1%
Rent to Value Ratio
Active
$1,765,000
10
bds
|
0
ba
|
4,254
sqft
|
built
1955
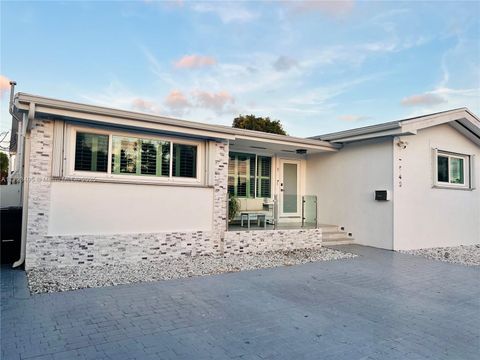
7025 Rue Granville, Miami Beach, FL 33141
$-7,573
Cash flow
-22.4%
Cash-on-Cash Return
1.0%
Cap rate
0.2%
Rent to Value Ratio
Active
$549,000
2
bds
|
3
ba
|
1,113
sqft
|
built
2009
7928 East Dr, North Bay Village, FL 33141
$-2,310
Cash flow
-22.0%
Cash-on-Cash Return
1.1%
Cap rate
0.7%
Rent to Value Ratio
Active
$399,000
1
bds
|
2
ba
|
910
sqft
|
built
1968
6770 Indian Creek Dr, Miami Beach, FL 33141
$-551
Cash flow
-7.2%
Cash-on-Cash Return
4.5%
Cap rate
0.7%
Rent to Value Ratio
Active
$310,000
1
bds
|
2
ba
|
910
sqft
|
built
1968
6770 Indian Creek Dr, Miami Beach, FL 33141
$-1,281
Cash flow
-21.6%
Cash-on-Cash Return
1.2%
Cap rate
0.7%
Rent to Value Ratio
Active
$800,000
2
bds
|
2
ba
|
1,805
sqft
|
built
1976
6423 Collins Ave, Miami Beach, FL 33141
$-2,766
Cash flow
-18.0%
Cash-on-Cash Return
2.0%
Cap rate
0.7%
Rent to Value Ratio

Active
$450,000
2
bds
|
2
ba
|
1,299
sqft
|
built
1970
401 69th St, Miami Beach, FL 33141
$-2,066
Cash flow
-24.0%
Cash-on-Cash Return
0.6%
Cap rate
0.7%
Rent to Value Ratio

Active
$749,000
2
bds
|
2
ba
|
1,035
sqft
|
built
2008
6799 Collins Ave, Miami Beach, FL 33141
$-1,005
Cash flow
-7.0%
Cash-on-Cash Return
4.5%
Cap rate
0.7%
Rent to Value Ratio

Active
$539,000
2
bds
|
2
ba
|
1,061
sqft
|
built
1987
7601 E Treasure Dr, North Bay Village, FL 33141
$-2,052
Cash flow
-19.9%
Cash-on-Cash Return
1.6%
Cap rate
0.6%
Rent to Value Ratio
Active
$350,000
1
bds
|
2
ba
|
820
sqft
|
built
1981
6830 Indian Creek Dr, Miami Beach, FL 33141
$-1,005
Cash flow
-15.0%
Cash-on-Cash Return
2.7%
Cap rate
0.7%
Rent to Value Ratio

Active
$300,000
1
bds
|
2
ba
|
980
sqft
|
built
1972
6801 Indian Creek Dr, Miami Beach, FL 33141
$-773
Cash flow
-13.4%
Cash-on-Cash Return
3.1%
Cap rate
0.9%
Rent to Value Ratio
Active
$449,000
1
bds
|
1
ba
|
720
sqft
|
built
1999
7800 Collins Ave, Miami Beach, FL 33141
$-1,771
Cash flow
-20.6%
Cash-on-Cash Return
1.4%
Cap rate
0.5%
Rent to Value Ratio

Active
$850,000
1
bds
|
1
ba
|
820
sqft
|
built
2008
6899 Collins Ave, Miami Beach, FL 33141
$-2,772
Cash flow
-17.0%
Cash-on-Cash Return
2.2%
Cap rate
0.8%
Rent to Value Ratio
Active
$399,000
2
bds
|
2
ba
|
1,020
sqft
|
built
1964
7441 Wayne Ave, Miami Beach, FL 33141
$-1,744
Cash flow
-22.8%
Cash-on-Cash Return
0.9%
Cap rate
0.7%
Rent to Value Ratio
Active
$3,299,000
3
bds
|
3
ba
|
1,761
sqft
|
built
2004
6365 Collins Ave, Miami Beach, FL 33141
$-14,068
Cash flow
-22.2%
Cash-on-Cash Return
1.0%
Cap rate
0.3%
Rent to Value Ratio
Active
$15,999,000
5
bds
|
3
ba
|
2,293
sqft
|
built
1925
7837 Atlantic Way, Miami Beach, FL 33141
$-83,770
Cash flow
-27.3%
Cash-on-Cash Return
-0.1%
Cap rate
0.1%
Rent to Value Ratio

Active
$320,000
2
bds
|
2
ba
|
1,181
sqft
|
built
1964
7441 Wayne Ave, Miami Beach, FL 33141
$-785
Cash flow
-12.8%
Cash-on-Cash Return
3.2%
Cap rate
1.0%
Rent to Value Ratio

Active
$355,000
2
bds
|
2
ba
|
1,065
sqft
|
built
1965
7501 E Treasure Dr, North Bay Village, FL 33141
$-1,925
Cash flow
-28.3%
Cash-on-Cash Return
-0.4%
Cap rate
0.4%
Rent to Value Ratio
Active
$399,000
1
bds
|
2
ba
|
910
sqft
|
built
1968
6770 Indian Creek Dr, Miami Beach, FL 33141
$-786
Cash flow
-10.3%
Cash-on-Cash Return
3.8%
Cap rate
0.9%
Rent to Value Ratio
Active
$4,199,000
6
bds
|
0
ba
|
3,930
sqft
|
built
1949
1995 Calais Dr, Miami Beach, FL 33141
$-21,014
Cash flow
-26.1%
Cash-on-Cash Return
0.1%
Cap rate
0.1%
Rent to Value Ratio
Active
$699,000
2
bds
|
3
ba
|
1,410
sqft
|
built
2009
7930 East Dr, North Bay Village, FL 33141
$-3,091
Cash flow
-23.1%
Cash-on-Cash Return
0.8%
Cap rate
0.7%
Rent to Value Ratio

Active
$310,999
1
bds
|
1
ba
|
678
sqft
|
built
1963
900 Bay Dr, Miami Beach, FL 33141
$-812
Cash flow
-13.6%
Cash-on-Cash Return
3.0%
Cap rate
0.8%
Rent to Value Ratio
Active
$1,375,000
2
bds
|
2
ba
|
1,410
sqft
|
built
1999
7330 Ocean Ter, Miami Beach, FL 33141
$-4,932
Cash flow
-18.7%
Cash-on-Cash Return
1.8%
Cap rate
0.5%
Rent to Value Ratio
Active
$355,000
2
bds
|
2
ba
|
1,030
sqft
|
built
1987
7601 E Treasure Dr, North Bay Village, FL 33141
$-1,107
Cash flow
-16.3%
Cash-on-Cash Return
2.4%
Cap rate
0.8%
Rent to Value Ratio
Active
$1,499,000
3
bds
|
2
ba
|
2,078
sqft
|
built
1955
7549 Adventure Ave, North Bay Village, FL 33141
$-4,336
Cash flow
-15.1%
Cash-on-Cash Return
2.7%
Cap rate
0.5%
Rent to Value Ratio
Active
$1,175,000
2
bds
|
2
ba
|
1,250
sqft
|
built
1996
6301 Collins Ave, Miami Beach, FL 33141
$-3,765
Cash flow
-16.7%
Cash-on-Cash Return
2.3%
Cap rate
0.6%
Rent to Value Ratio
Active
$550,000
2
bds
|
2
ba
|
970
sqft
|
built
1958
7920 East Dr, North Bay Village, FL 33141
$-2,266
Cash flow
-21.5%
Cash-on-Cash Return
1.2%
Cap rate
0.5%
Rent to Value Ratio
Active
$349,500
1
bds
|
2
ba
|
1,003
sqft
|
built
1963
900 Bay Dr, Miami Beach, FL 33141
$-1,420
Cash flow
-21.2%
Cash-on-Cash Return
1.3%
Cap rate
0.8%
Rent to Value Ratio

Active
$1,250,000
2
bds
|
2
ba
|
1,200
sqft
|
built
2008
6801 Collins Ave, Miami Beach, FL 33141
$-4,665
Cash flow
-19.5%
Cash-on-Cash Return
1.7%
Cap rate
0.4%
Rent to Value Ratio
Active
$1,225,000
3
bds
|
3
ba
|
1,712
sqft
|
built
2006
6580 Indian Creek Dr, Miami Beach, FL 33141
$-4,745
Cash flow
-20.2%
Cash-on-Cash Return
1.5%
Cap rate
0.6%
Rent to Value Ratio
Active
$339,000
2
bds
|
2
ba
|
1,130
sqft
|
built
1965
7501 E Treasure Dr, North Bay Village, FL 33141
$-1,119
Cash flow
-17.2%
Cash-on-Cash Return
2.2%
Cap rate
0.8%
Rent to Value Ratio

Active
$525,000
2
bds
|
2
ba
|
1,251
sqft
|
built
2007
7900 Harbor Island Dr, North Bay Village, FL 33141
$-2,140
Cash flow
-21.3%
Cash-on-Cash Return
1.3%
Cap rate
0.6%
Rent to Value Ratio
Active
$1,475,000
3
bds
|
4
ba
|
2,203
sqft
|
built
2004
6103 Aqua Ave, Miami Beach, FL 33141
$-7,350
Cash flow
-26.0%
Cash-on-Cash Return
0.2%
Cap rate
0.6%
Rent to Value Ratio
Active
$1,250,000
3
bds
|
2
ba
|
1,171
sqft
|
built
1939
2130 Verdun Dr, Miami Beach, FL 33141
$-2,652
Cash flow
-11.1%
Cash-on-Cash Return
3.6%
Cap rate
0.6%
Rent to Value Ratio
Active
$230,000
bds
|
1
ba
|
0
sqft
|
built
1973
2000 Biarritz Dr, Miami Beach, FL 33141
$-583
Cash flow
-13.2%
Cash-on-Cash Return
3.1%
Cap rate
0.7%
Rent to Value Ratio