85018 Investment Properties for Sale
Browse homes for sale and investment properties in 85018. Refine your search by price, property type, or more.
Best cash flowing properties in 85018
Active
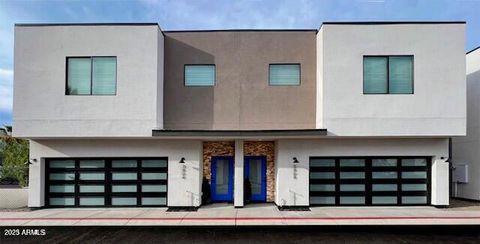
$189,990
1
bds
|
1
ba
|
622
sqft
|
built
1979
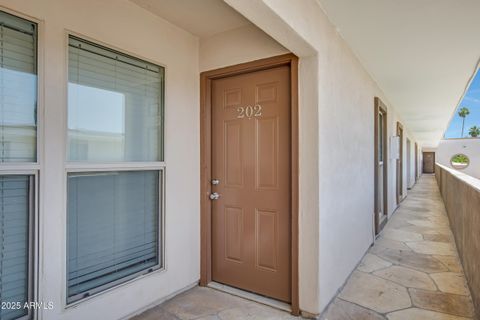
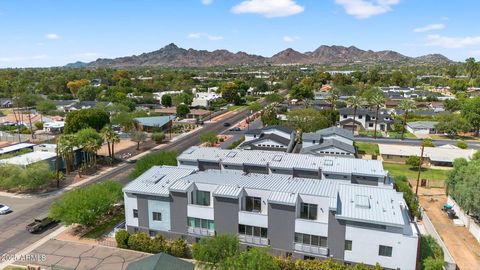
3619 E Monterosa St, Phoenix, AZ 85018
$-375
Cash flow
-10.3%
Cash-on-Cash Return
3.3%
Cap rate
0.7%
Rent to Value Ratio
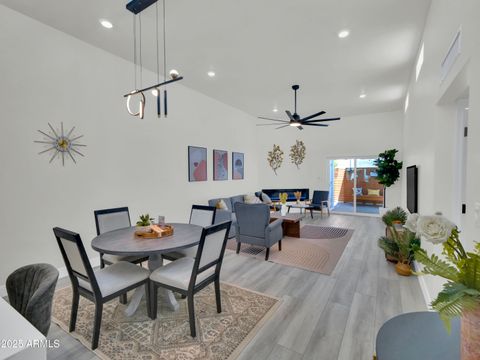
Active
$875,000
3
bds
|
3
ba
|
2,213
sqft
|
built
2016
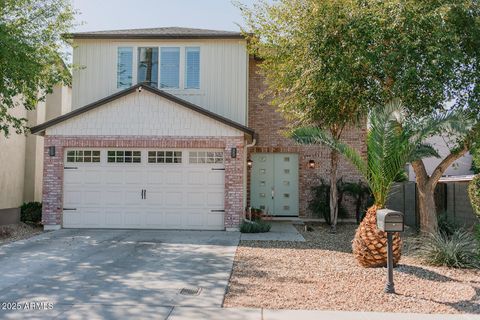
3845 E Earll Dr, Phoenix, AZ 85018
$-917
Cash flow
-5.5%
Cash-on-Cash Return
4.4%
Cap rate
0.6%
Rent to Value Ratio
140 out of 149 properties for sale in 85018
Limited Results Shown
Create a free account, or log in to reveal all property listings and enjoy the complete experience.
Active
$434,899
2
bds
|
2
ba
|
1,149
sqft
|
built
1989
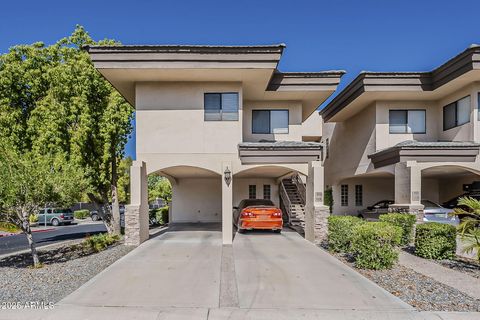
3235 E Camelback Rd, Phoenix, AZ 85018
$-1,175
Cash flow
-14.1%
Cash-on-Cash Return
2.4%
Cap rate
0.5%
Rent to Value Ratio
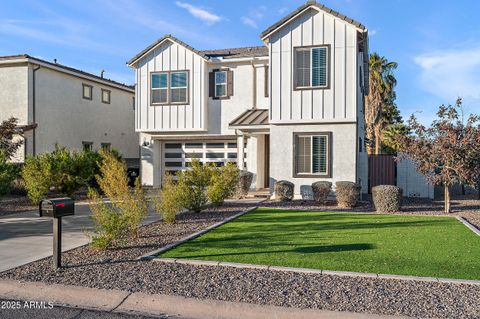
Active
$725,000
4
bds
|
2
ba
|
1,677
sqft
|
built
1957
4140 E Glenrosa Ave, Phoenix, AZ 85018
$-1,367
Cash flow
-9.8%
Cash-on-Cash Return
3.4%
Cap rate
0.4%
Rent to Value Ratio
Active
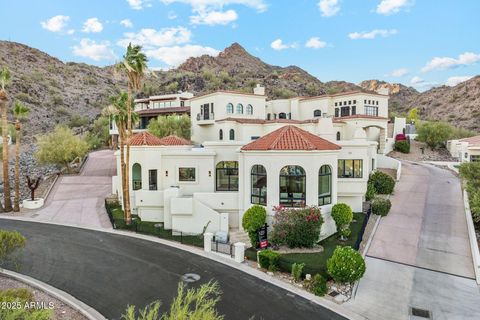
$9,250,000
bds
|
0
ba
|
0
sqft
|
built
2024
3804 E Monterey Way, Phoenix, AZ 85018
$-43,583
Cash flow
-24.6%
Cash-on-Cash Return
0.0%
Cap rate
0.0%
Rent to Value Ratio
Active
$2,479,000
3
bds
|
3
ba
|
3,912
sqft
|
built
1987
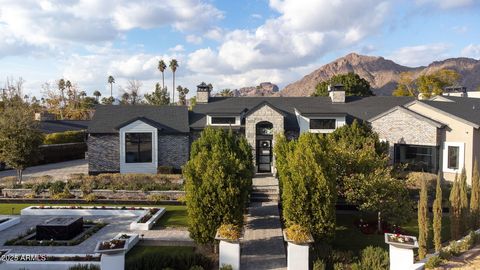
3800 E Lincoln Dr, Phoenix, AZ 85018
$-9,200
Cash flow
-19.4%
Cash-on-Cash Return
1.2%
Cap rate
0.3%
Rent to Value Ratio
Active
$1,150,000
3
bds
|
4
ba
|
2,372
sqft
|
built
1954
4246 E Mulberry Dr, Phoenix, AZ 85018
$-2,557
Cash flow
-11.6%
Cash-on-Cash Return
3.0%
Cap rate
0.4%
Rent to Value Ratio
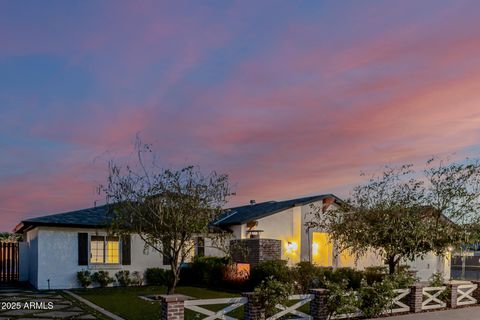
Active
$2,900,000
4
bds
|
4
ba
|
3,251
sqft
|
built
1961
4142 E Stanford Dr, Phoenix, AZ 85018
$-9,223
Cash flow
-16.6%
Cash-on-Cash Return
1.9%
Cap rate
0.2%
Rent to Value Ratio
Active
$1,575,000
3
bds
|
3
ba
|
2,366
sqft
|
built
2018
4525 N 40th St, Phoenix, AZ 85018
$-5,167
Cash flow
-17.1%
Cash-on-Cash Return
1.7%
Cap rate
0.3%
Rent to Value Ratio
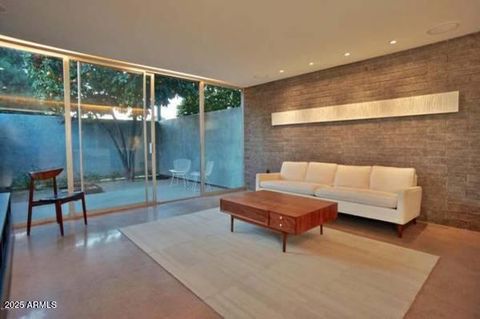
Active
$2,200,000
5
bds
|
3
ba
|
2,460
sqft
|
built
1958
5611 E Calle Camelia, Phoenix, AZ 85018
$-7,020
Cash flow
-16.6%
Cash-on-Cash Return
1.8%
Cap rate
0.3%
Rent to Value Ratio
Active
$5,124,850
5
bds
|
7
ba
|
4,941
sqft
|
built
2020
5712 E Calle Camelia, Phoenix, AZ 85018
$-19,095
Cash flow
-19.4%
Cash-on-Cash Return
1.2%
Cap rate
0.2%
Rent to Value Ratio

Active
$2,990,000
4
bds
|
3
ba
|
3,188
sqft
|
built
1972
5919 N 45th St, Phoenix, AZ 85018
$-7,445
Cash flow
-13.0%
Cash-on-Cash Return
2.7%
Cap rate
0.4%
Rent to Value Ratio
Active
$3,995,000
4
bds
|
4
ba
|
3,675
sqft
|
built
1968
4218 E Palo Verde Dr, Phoenix, AZ 85018
$-15,178
Cash flow
-19.8%
Cash-on-Cash Return
1.1%
Cap rate
0.2%
Rent to Value Ratio
Active
$530,000
2
bds
|
2
ba
|
1,494
sqft
|
built
1981
3401 N 37th St, Phoenix, AZ 85018
$-1,605
Cash flow
-15.8%
Cash-on-Cash Return
2.0%
Cap rate
0.4%
Rent to Value Ratio
Active
$985,000
4
bds
|
3
ba
|
2,589
sqft
|
built
2021
3750 E Earll Dr, Phoenix, AZ 85018
$-1,509
Cash flow
-8.0%
Cash-on-Cash Return
3.8%
Cap rate
0.5%
Rent to Value Ratio

Active
$4,395,000
5
bds
|
5
ba
|
4,496
sqft
|
built
1966
5156 N 45th Pl, Phoenix, AZ 85018
$-14,733
Cash flow
-17.5%
Cash-on-Cash Return
1.7%
Cap rate
0.2%
Rent to Value Ratio
Active
$2,385,000
5
bds
|
4
ba
|
2,874
sqft
|
built
2013
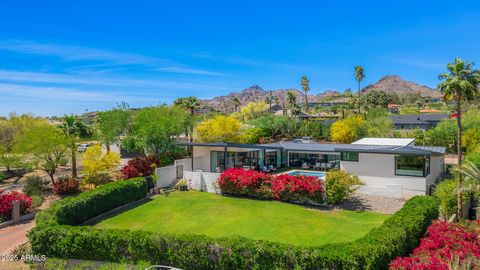
4021 E Glenrosa Ave, Phoenix, AZ 85018
$-6,843
Cash flow
-15.0%
Cash-on-Cash Return
2.2%
Cap rate
0.3%
Rent to Value Ratio
Active
$474,900
2
bds
|
2
ba
|
1,024
sqft
|
built
1963
4401 N 40th St, Phoenix, AZ 85018
$-1,408
Cash flow
-15.5%
Cash-on-Cash Return
2.1%
Cap rate
0.4%
Rent to Value Ratio
Active
$725,000
3
bds
|
2
ba
|
1,192
sqft
|
built
1955
4023 E Devonshire Ave, Phoenix, AZ 85018
$-1,781
Cash flow
-12.8%
Cash-on-Cash Return
2.7%
Cap rate
0.4%
Rent to Value Ratio

Active
$2,300,000
4
bds
|
3
ba
|
2,712
sqft
|
built
1971
5803 N 45th St, Phoenix, AZ 85018
$-7,303
Cash flow
-16.6%
Cash-on-Cash Return
1.9%
Cap rate
0.3%
Rent to Value Ratio