Jefferson County Investment Properties for Sale
Browse homes for sale and investment properties in Jefferson County. Refine your search by price, property type, or more.
Best cash flowing properties in Jefferson County

Active
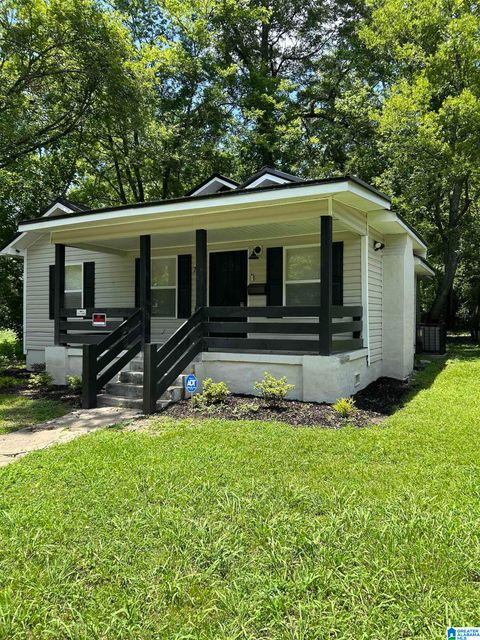
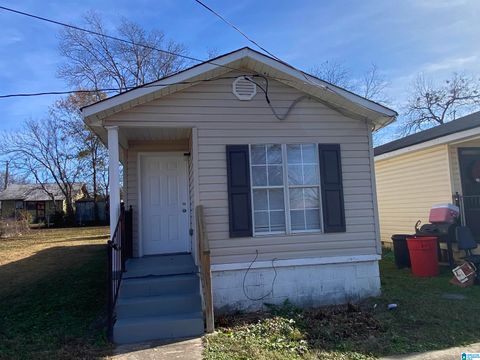
$65,000
3
bds
|
0
ba
|
1,170
sqft
|
built
1949
1414 27th Street Ensley, Birmingham, AL 35218
$828
Cash flow
14.8%
Cash-on-Cash Return
15.3%
Cap rate
1.8%
Rent to Value Ratio

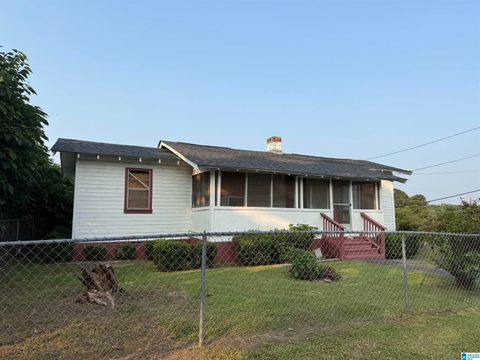
Active
$74,900
2
bds
|
0
ba
|
1,121
sqft
|
built
1920
3645 Pine Ave SW, Birmingham, AL 35221
$759
Cash flow
11.8%
Cash-on-Cash Return
12.2%
Cap rate
1.5%
Rent to Value Ratio
1,500 out of 2,186 properties for sale in Jefferson County
Limited Results Shown
Create a free account, or log in to reveal all property listings and enjoy the complete experience.
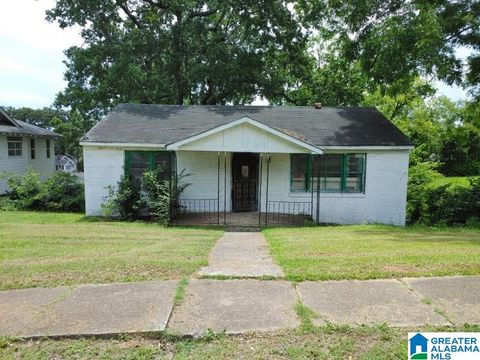
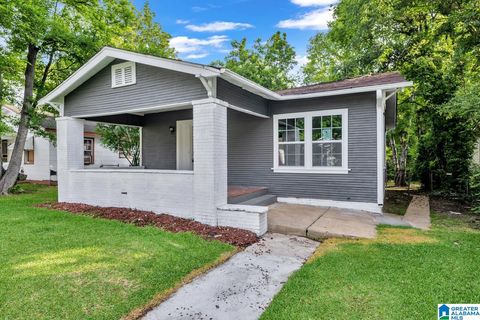
Active
$146,900
3
bds
|
0
ba
|
1,107
sqft
|
built
1935
7708 6th Ave N, Birmingham, AL 35206
$61
Cash flow
2.2%
Cash-on-Cash Return
6.8%
Cap rate
0.8%
Rent to Value Ratio

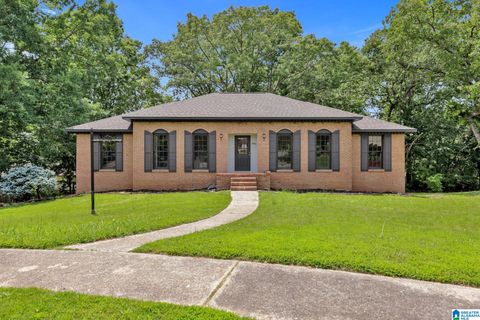
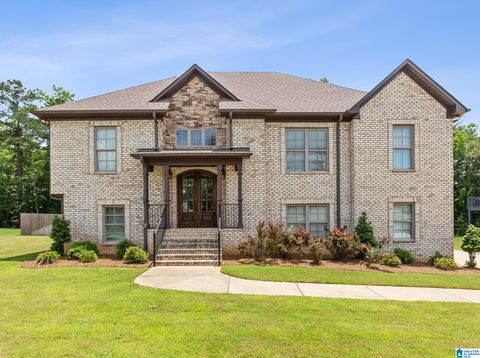
Active
$750,000
5
bds
|
0
ba
|
3,650
sqft
|
built
2007
1455 Haddon Cv, Hoover, AL 35226
$-1,806
Cash flow
-12.6%
Cash-on-Cash Return
3.4%
Cap rate
0.4%
Rent to Value Ratio

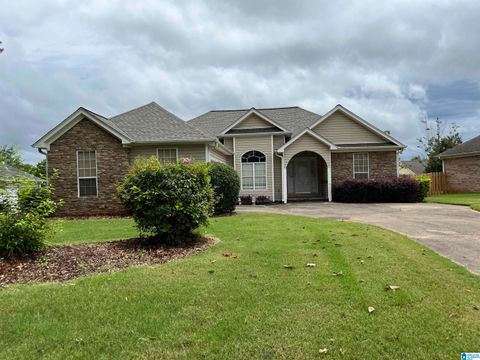
Active
$149,900
2
bds
|
0
ba
|
1,328
sqft
|
built
1950
445 Plaza Dr, Birmingham, AL 35235
$183
Cash flow
6.4%
Cash-on-Cash Return
7.7%
Cap rate
0.9%
Rent to Value Ratio
Active
$50,000
2
bds
|
0
ba
|
986
sqft
|
built
1930
7424 England Ave, Birmingham, AL 35224
$690
Cash flow
16.1%
Cash-on-Cash Return
16.6%
Cap rate
2.0%
Rent to Value Ratio

Active
$390,000
4
bds
|
0
ba
|
3,454
sqft
|
built
2008
5105 Marie Cir, Birmingham, AL 35215
$-656
Cash flow
-8.8%
Cash-on-Cash Return
4.2%
Cap rate
0.5%
Rent to Value Ratio

Active
$289,000
3
bds
|
0
ba
|
1,004
sqft
|
built
1957
4736 Maryland Ave, Irondale, AL 35210
$-129
Cash flow
-2.3%
Cash-on-Cash Return
5.7%
Cap rate
0.7%
Rent to Value Ratio
Active
$84,900
3
bds
|
0
ba
|
962
sqft
|
built
1955
16 Norwood Cir, Birmingham, AL 35234
$247
Cash flow
15.2%
Cash-on-Cash Return
9.8%
Cap rate
1.2%
Rent to Value Ratio

Active
$169,999
2
bds
|
0
ba
|
1,873
sqft
|
built
1950
1507 Monticello Rd, Irondale, AL 35210
$354
Cash flow
10.9%
Cash-on-Cash Return
8.8%
Cap rate
1.1%
Rent to Value Ratio
Active
$275,000
4
bds
|
0
ba
|
2,703
sqft
|
built
1977
2416 6th Pl NW, Center Point, AL 35215
$-194
Cash flow
-3.7%
Cash-on-Cash Return
5.4%
Cap rate
0.7%
Rent to Value Ratio
Active
$215,000
3
bds
|
0
ba
|
2,392
sqft
|
built
1975
5711 Woodcreek Rd, Pinson, AL 35126
$120
Cash flow
2.9%
Cash-on-Cash Return
6.9%
Cap rate
0.8%
Rent to Value Ratio
Active
$115,000
4
bds
|
0
ba
|
1,352
sqft
|
built
1934
2129 Pike Rd, Birmingham, AL 35218
$159
Cash flow
7.2%
Cash-on-Cash Return
7.9%
Cap rate
1.0%
Rent to Value Ratio
Active
$160,000
3
bds
|
0
ba
|
1,669
sqft
|
built
1930
2101 Clarendon Ave, Bessemer, AL 35020
$131
Cash flow
4.3%
Cash-on-Cash Return
7.2%
Cap rate
0.9%
Rent to Value Ratio
Active
$229,900
3
bds
|
0
ba
|
1,161
sqft
|
built
2000
4291 Candle Brook Ln, Bessemer, AL 35022
$-96
Cash flow
-2.2%
Cash-on-Cash Return
5.8%
Cap rate
0.7%
Rent to Value Ratio
Active
$74,900
2
bds
|
0
ba
|
1,121
sqft
|
built
1920
3645 Pine Ave SW, Birmingham, AL 35221
$759
Cash flow
11.8%
Cash-on-Cash Return
12.2%
Cap rate
1.5%
Rent to Value Ratio

Active
$749,900
4
bds
|
0
ba
|
5,087
sqft
|
built
1995
3609 Carisbrooke Pkwy, Hoover, AL 35226
$-1,470
Cash flow
-10.2%
Cash-on-Cash Return
3.9%
Cap rate
0.5%
Rent to Value Ratio

Active
$135,000
3
bds
|
0
ba
|
965
sqft
|
built
1955
1225 Lynn Acres Dr, Birmingham, AL 35215
$54
Cash flow
2.1%
Cash-on-Cash Return
6.7%
Cap rate
0.8%
Rent to Value Ratio

Active
$349,900
3
bds
|
0
ba
|
1,512
sqft
|
built
1930
1138 14th Ave S, Birmingham, AL 35205
$-861
Cash flow
-12.8%
Cash-on-Cash Return
3.3%
Cap rate
0.4%
Rent to Value Ratio

Active
$99,900
4
bds
|
0
ba
|
2,540
sqft
|
built
1930
2800 20th Street Ensley, Birmingham, AL 35208
$444
Cash flow
23.2%
Cash-on-Cash Return
11.6%
Cap rate
1.4%
Rent to Value Ratio

Active
$699,900
4
bds
|
0
ba
|
2,313
sqft
|
built
2011
637 Preserve Way, Hoover, AL 35226
$-1,554
Cash flow
-11.6%
Cash-on-Cash Return
3.6%
Cap rate
0.5%
Rent to Value Ratio
Active
$65,000
3
bds
|
0
ba
|
1,170
sqft
|
built
1949
1414 27th Street Ensley, Birmingham, AL 35218
$828
Cash flow
14.8%
Cash-on-Cash Return
15.3%
Cap rate
1.8%
Rent to Value Ratio

Active
$205,000
3
bds
|
0
ba
|
1,164
sqft
|
built
2012
149 Martin Dr, Birmingham, AL 35215
$-104
Cash flow
-2.6%
Cash-on-Cash Return
5.7%
Cap rate
0.7%
Rent to Value Ratio

Active
$425,000
4
bds
|
0
ba
|
2,250
sqft
|
built
1969
2329 Mountain Oaks Ln, Hoover, AL 35226
$-701
Cash flow
-8.6%
Cash-on-Cash Return
4.3%
Cap rate
0.5%
Rent to Value Ratio
Active
$270,000
3
bds
|
0
ba
|
1,517
sqft
|
built
2006
4374 Sunny Side Cir, Warrior, AL 35180
$-178
Cash flow
-3.4%
Cash-on-Cash Return
5.5%
Cap rate
0.7%
Rent to Value Ratio

Active
$230,000
4
bds
|
0
ba
|
2,352
sqft
|
built
1976
2232 Cedar Crest Dr, Birmingham, AL 35214
$-28
Cash flow
-0.6%
Cash-on-Cash Return
6.1%
Cap rate
0.7%
Rent to Value Ratio

Active
$279,900
5
bds
|
0
ba
|
2,041
sqft
|
built
1979
6806 Green Acre Cir, Pinson, AL 35126
$-288
Cash flow
-5.4%
Cash-on-Cash Return
5.0%
Cap rate
0.6%
Rent to Value Ratio
Active
$499,900
3
bds
|
0
ba
|
1,633
sqft
|
built
1950
2000 21st Ave S, Birmingham, AL 35209
$-609
Cash flow
-6.4%
Cash-on-Cash Return
4.8%
Cap rate
0.6%
Rent to Value Ratio

Active
$259,000
2
bds
|
0
ba
|
1,285
sqft
|
built
1930
3410 17th Ave N, Birmingham, AL 35234
$-524
Cash flow
-10.6%
Cash-on-Cash Return
3.8%
Cap rate
0.5%
Rent to Value Ratio
Active
$126,000
3
bds
|
0
ba
|
988
sqft
|
built
1979
223 Woodward Dr, Bessemer, AL 35023
$101
Cash flow
4.2%
Cash-on-Cash Return
7.2%
Cap rate
0.9%
Rent to Value Ratio

Active
$1,595,000
5
bds
|
0
ba
|
4,959
sqft
|
built
2017
427 Renaissance Dr, Hoover, AL 35226
$-4,433
Cash flow
-14.5%
Cash-on-Cash Return
2.9%
Cap rate
0.4%
Rent to Value Ratio

Active
$399,000
4
bds
|
0
ba
|
2,907
sqft
|
built
1973
2041 Longmeadow Ln, Hoover, AL 35216
$-703
Cash flow
-9.2%
Cash-on-Cash Return
4.2%
Cap rate
0.5%
Rent to Value Ratio

Active
$104,900
4
bds
|
0
ba
|
0
sqft
|
built
1939
3944 40th St N, Birmingham, AL 35217
$211
Cash flow
10.5%
Cash-on-Cash Return
8.7%
Cap rate
1.0%
Rent to Value Ratio
Active
$127,000
3
bds
|
0
ba
|
1,400
sqft
|
built
1960
2100 Baker Dr, Birmingham, AL 35217
$303
Cash flow
12.4%
Cash-on-Cash Return
9.1%
Cap rate
1.1%
Rent to Value Ratio

Active
$395,000
4
bds
|
0
ba
|
2,420
sqft
|
built
1991
140 Russet Hill Dr, Hoover, AL 35244
$-130
Cash flow
-1.7%
Cash-on-Cash Return
5.9%
Cap rate
0.7%
Rent to Value Ratio
Active
$80,000
2
bds
|
0
ba
|
572
sqft
|
built
1930
727 3rd Ave N, Bessemer, AL 35020
$203
Cash flow
13.2%
Cash-on-Cash Return
9.3%
Cap rate
1.1%
Rent to Value Ratio
Active
$530,000
5
bds
|
0
ba
|
3,276
sqft
|
built
2021
913 Aster Pl, Bessemer, AL 35022
$-864
Cash flow
-8.5%
Cash-on-Cash Return
4.3%
Cap rate
0.5%
Rent to Value Ratio
Active
$89,900
3
bds
|
0
ba
|
1,068
sqft
|
built
1930
314 43rd St, Fairfield, AL 35064
$152
Cash flow
8.8%
Cash-on-Cash Return
8.3%
Cap rate
1.0%
Rent to Value Ratio
Active
$249,900
3
bds
|
0
ba
|
1,461
sqft
|
built
1996
1837 Brandon Way, Bessemer, AL 35022
$-76
Cash flow
-1.6%
Cash-on-Cash Return
5.9%
Cap rate
0.7%
Rent to Value Ratio

Active
$185,000
2
bds
|
0
ba
|
1,700
sqft
|
built
1986
3416 Cedar Crest Cir, Hoover, AL 35216
$276
Cash flow
7.8%
Cash-on-Cash Return
8.1%
Cap rate
1.0%
Rent to Value Ratio

Active
$57,000
2
bds
|
0
ba
|
0
sqft
|
built
1957
1125 Thomason Ave, Birmingham, AL 35217
$690
Cash flow
14.1%
Cash-on-Cash Return
14.5%
Cap rate
1.8%
Rent to Value Ratio

Active
$169,000
3
bds
|
0
ba
|
1,918
sqft
|
built
1958
233 Walker Rd, Birmingham, AL 35214
$360
Cash flow
11.1%
Cash-on-Cash Return
8.8%
Cap rate
1.1%
Rent to Value Ratio